What is the Gold-to-copper ratio and why is it important? And more importantly, what could it be telling us? The Gold-To-Copper Ratio Health Check Copper is often referred to as a barometer for economic growth and gold has historically been the safe-haven, a risk-off asset of choice for investors, so naturally comparing the two allows one to take a decent look at broader market sentiment.
Why Copper? Copper is one of the most widely used metals from both established and emerging economies and on top of that it is the only base metal used throughout all aspects of industrialization. Therefore increase in industrialization equates to an increasing demand in copper which ultimately relates to higher copper prices.
For this reason, the metal holds the moniker of "Dr. Copper." and why we can use it as an indicator of economic growth. The Ratio Explained In layman's terms, the gold-to-copper ratio is the current gold price divided by the current copper price.
However what is more import is what this ratio indicates and how it can help us get a firmer understand of the macro forces at play within the market. The gold-to-copper ratio is effectively a visual representation of risk-on/risk-off sentiment. The higher the ratio means that fewer people are buying copper and more are buying gold so what we see is a risk-off sentiment, meaning that people are more cautious with their money and investments, sticking to low-risk products.
The lower the ratio equates to the inverse, vis-à-vis risk-on sentiment and more stimulus into the economy. Gold-to-Copper Ratio Historical Traits In June of 2016, the story on everybody’s radar was bond yields at the lowest since the middle of the financial crisis with the U.S. 10-year yield printing lows at 1.3579% in and then for the next few weeks we saw the yield sit at around the lows and the 1.50% level. Was the gold-to-copper ratio signaling a shift to us?
The ratio peaked in early September 2016 but very quickly began to tumble as Gold prices started to see sell-offs and Copper started to see pretty heavy buying, this resulted in seeing the ratio price drop by about a third. It was during the second leg lower for the ratio that we started to see a bid in bond yields and the transition to a more risk-off environment, which we can see in the chart below that shows both the U.S. 10yr Bond yield (orange line) and the Dow Jones Industrial Index (white shaded line) begin their rally higher. U.S. 10yr Bond yield & Dow Jones Industrial Index So how can we utilise this within our trading?
To quote Samuel Goldwyn “The harder you work, the luckier you get.” and in this case, the harder you work to understand the interconnectivity of financial markets the ‘luckier’ you get with trading. Understanding how certain assets can be used to evaluate market/economic sentiment allows you to move away from being dependent on the obvious indicators, i.e. economic data & mainstream media sources and will enable you to be ahead of the curve, active as a pose to reactive. So, with the Gold price just popping above $1200 an ounce and Copper prices pushing lower on the back of poor Chile exports, we could see the gold-to-copper begin to push higher again, was the Gold-to-copper ratio flashing a warning to us before the significant equity market sell-off on Wednesday the 10th?
Will a push higher in the ratio signal a further sell-off in equities? We will be watching closely, both the commodity prices and equity indices to see where the market takes us next. This article is written by a GO Markets Analyst and is based on their independent analysis.
They remain fully responsible for the views expressed as well as any remaining error or omissions. Trading Forex and Derivatives carries a high level of risk. Sources: Bloomberg
By
GO Markets
The information provided is of general nature only and does not take into account your personal objectives, financial situations or needs. Before acting on any information provided, you should consider whether the information is suitable for you and your personal circumstances and if necessary, seek appropriate professional advice. All opinions, conclusions, forecasts or recommendations are reasonably held at the time of compilation but are subject to change without notice. Past performance is not an indication of future performance. Go Markets Pty Ltd, ABN 85 081 864 039, AFSL 254963 is a CFD issuer, and trading carries significant risks and is not suitable for everyone. You do not own or have any interest in the rights to the underlying assets. You should consider the appropriateness by reviewing our TMD, FSG, PDS and other CFD legal documents to ensure you understand the risks before you invest in CFDs.
Los precios del petróleo tienden a subir cuando la demanda es fuerte, la oferta está limitada o los eventos geopolíticos interrumpen los flujos comerciales normales. En este caso, Estados Unidos e Israel parecieron actuar de manera preventiva en lo que vieron como un movimiento defensivo. El impacto más amplio en el mercado se ha sentido más ampliamente.
Cuando los precios del petróleo se mueven, rara vez se mueven de forma aislada. El aumento de los precios del crudo puede afectar la inflación, las expectativas del banco central, los costos de envío y los márgenes corporativos en toda la economía mundial.
¿Qué está pasando?
Hay tres formas generales en que las empresas pueden beneficiarse de los precios más altos del petróleo:
1. Producir petróleo y gas, mediante la venta de la mercancía a un precio más alto 2. Prestación de servicios y equipos a los productores 3. Transportar petróleo alrededor del mundo
Cada una de las acciones a continuación representa uno de esos tipos de exposición, con un perfil de riesgo diferente cuando el crudo sube.
1. Exxon Mobile (NYSE: XOM)
Exxon Mobil es una de las compañías petroleras integradas más grandes del mundo, involucrada en todo, desde explorar y producir petróleo hasta refinarlo en combustible y producir productos químicos. Cuando los precios del petróleo suben, su negocio ascendente puede beneficiarse de márgenes más amplios, mientras que su tamaño y diversificación pueden ayudar a amortiguar los puntos más débiles en el ciclo.
Exxon tiene posiciones importantes en regiones de crecimiento como la Cuenca Pérmica de Estados Unidos y grandes proyectos offshore, que están diseñados para entregar barriles de bajo costo relativamente bajo durante muchos años. Cuando los precios son altos, la producción de bajo costo puede apoyar el flujo de caja libre y la capacidad de la compañía para dividendos, recompras o mayor inversión.
Desempeño de Exxon Mobil (XOM) frente al Brent Crude a 6 meses
Durante el año pasado, Exxon Mobil ha superado al crudo Brent, con el precio de sus acciones subiendo casi 35% en comparación con un aumento del 30% en el crudo Brent. Al momento de escribir este artículo, ambos cotizan poco más del 3% por debajo de sus máximos históricos, aunque Exxon se mantiene más cerca de su máximo de 52 semanas que el Brent. | Fuente: Share Trader
Consensus: Comprar
Según TradingView, el sentimiento de los analistas hacia Exxon es ampliamente positivo, con una calificación de compra consensuada. De los 31 analistas rastreados, 15 califican la acción como Strong Buy or Buy, mientras que 13 la califican Hold.
El punto de vista positivo está ligado a la fortaleza del balance de Exxon y a la producción de mayor margen, con los analistas más optimistas proyectando un objetivo de precios a 1 año tan alto como US$183.00. No obstante, una pequeña minoría de 3 analistas ha emitido una calificación de Sell o Strong Sell, lo que contribuye a un precio objetivo promedio de US$145,00, que se ubica alrededor de 3.6% por debajo del precio de negociación actual.
Pronóstico del precio de Exxon Mobil y calificaciones al miércoles, 11 Marzo 2026 | Fuente: TradingView
2. Chevron (NYSE: CVX)
Chevron es otra importante global integrada que se ha beneficiado del reciente movimiento al alza en crudo, con sus acciones cotizando cerca de máximos de 52 semanas. Al igual que Exxon, Chevron opera en toda la cadena de valor, incluida la producción inicial, refinación y comercialización. La adquisición completa de Hess por parte de Chevron agrega Guyana y otros activos upstream, que algunos analistas ven como un apoyo a lo largo del tiempo, aunque el impacto en las ganancias sigue sujeto a la integración, la ejecución de proyectos y los riesgos del precio de los productos.
En un entorno en el que los precios del petróleo y el gas pueden ser volátiles, esa diversificación puede ayudar a suavizar las ganancias y, al mismo tiempo, proporcionar apalancamiento para precios de la energía más fuertes.
Desempeño de Exxon Mobil vs Chevron, gráfico de 6 meses
Consensus: Comprar
Chevron se ve de manera similar a Exxon, con el sentimiento de los corredores que sigue siendo ampliamente constructivo. Los agregados recientes de TradingView muestran a 30 analistas cubriendo las acciones en los últimos tres meses, con 17 calificándola Strong Buy o Buy, 11 en Hold, 1 en Sell y 1 en Strong Sell. Analistas han destacado su cartera diversificada y la contribución potencial de Hess, aunque la volatilidad de los precios de las materias primas y los riesgos de ejecución pueden mantener a algunos más cautelosos.
Previsión del precio de Chevron y calificaciones al miércoles 11 de marzo de 2026. | Fuente: TradingView
3. SLB (NYSE: SLB)
El aumento de los precios del petróleo no sólo afecta a los productores. En este caso, SLB (antes Schlumberger) es una de las empresas de servicios petroleros más grandes del mundo, proporcionando tecnología, equipos y servicios que ayudan a los productores a encontrar y extraer hidrocarburos de manera más eficiente. Cuando el crudo tiene una tendencia al alza, los productores pueden aumentar la actividad de perforación y terminación, lo que puede elevar la demanda de servicios y software de SLB. Los comentarios recientes también han apuntado al creciente negocio digital de la compañía y su exposición global, lo que podría respaldar el crecimiento de las ganancias si el ciclo de reciclaje continúa.
Consenso: Comprar
Según TradingView, el consenso de los analistas sobre SLB es Buy, lo que indica un sentimiento ampliamente positivo. De los 33 analistas rastreados, 27 califican la acción Compra o Compra Fuerte, mientras que 4 la califican Hold y 2 la califican Sell o Strong Sell.
El sentimiento de los analistas parece reflejar las expectativas en torno a la posición de SLB como socio tecnológico más amplio. El precio objetivo promedio de US$55.71 implica 15,8% al alza con respecto a los niveles actuales, mientras que el objetivo más alto se encuentra en US$74.00. Estos pronósticos parecen estar vinculados a las expectativas de una mayor actividad internacional de perforación y una recuperación en los mercados de aguas profundas en alta mar.
Analistas de SLB son alcistas sobre el crecimiento digital e internacional | TradingView
4. Baker Hughes (NYSE: BKR)
Baker Hughes es otro importante proveedor de servicios y equipos para yacimientos petrolíferos, con exposición adicional a segmentos industriales como GNL e infraestructura eléctrica. Incluso cuando los precios del petróleo no están en máximos extremos, los avances en la tecnología de perforación y los menores costos de equilibrio han ayudado a mantener rentables muchas obras de esquisto, apoyando la demanda de sus servicios.
La compañía ha sido descrita como bien posicionada debido a su balance general y su exposición a la actividad continua de exploración y producción. En un período de precios del petróleo más altos, o incluso de estabilidad a empresa, esa combinación de servicios y tecnología energética puede crear varios impulsores de ingresos.
Consenso: Compra fuerte
El sentimiento de los brókers hacia Baker Hughes es ampliamente positivo, similar al de SLB. Más del 75% de los analistas de cobertura califican las acciones como Compra o Compra Fuerte, con el resto generalmente en Retén. Los analistas han señalado su exposición tanto a los servicios tradicionales de yacimientos petrolíferos como a la tecnología energética e industrial, incluida la infraestructura de GNL.
[GRÁFICO]
Transporte y exposición de envío
5. Operadores mundiales de petroleros
Las compañías petroleras pueden beneficiarse cuando los precios más altos, los cambios de política de la OPEP+ y las tensiones geopolíticas aumentan los envíos de larga distancia e interrumpen las rutas habituales.
Informes recientes han apuntado a tarifas de flete más fuertes y altos volúmenes de petróleo en tránsito, ya que el aumento de la producción de Oriente Medio y el crecimiento de la oferta de Estados Unidos, Brasil, Guyana y Canadá fluyen hacia los mercados asiáticos. Esa demanda de “tonelada-milla” puede respaldar las tarifas diarias de los petroleros y la rentabilidad, incluso cuando el mercado energético en general es volátil.
Consenso: N/A
Esta es una categoría de la industria más amplia en lugar de una sola acción que cotiza en bolsa, por lo que no existe un único consenso de bróker para ello. Las opiniones de los analistas tendrían que evaluarse a nivel de empresa, como Frontline plc (FRO), Euronav (EURN) o Scorpio Tankers (STNG). En términos más generales, el sector suele verse como cíclico, aunque las condiciones actuales pueden apoyar las tarifas de flete cuando las perturbaciones geopolíticas alargan las rutas marítimas.
6. Woodside Energy (ASX: WDS)
Woodside agrega un nombre con sede en Australia con exposición global a GNL y petróleo. Sus resultados anuales de 2024 mostraron que las ganancias subyacentes bajaron 13%, principalmente debido a los menores precios del petróleo y el gas alcanzados, según el anuncio de resultados de todo el año de la compañía. Eso pone de relieve lo sensibles que pueden ser las ganancias a la realización de los precios de las materias primas.
Si los precios del crudo y de la energía conexa se fortalecen, las perspectivas de ganancias de Woodside podrían mejorar, aunque el alcance de ese cambio seguirá dependiendo de factores específicos de la compañía y de los precios logrados.
Consenso: Sostenga
En contraste con las grandes grandes estadounidenses, el sentimiento de los corredores hacia este productor con sede en Australia es más cauteloso, con consenso generalmente en Hold. La mayoría de los analistas prefieren mantener las posiciones existentes en lugar de aumentar la exposición. Esa visión más mesurada a menudo está relacionada con su exposición a los precios del GNL, una menor reducción de los precios de las materias primas y las presiones regulatorias y de descarbonización a más largo plazo.
[GRÁFICO]
Riesgos y limitaciones
Los precios más altos del petróleo no son un viaje gratis para estas acciones.
Si los precios se disparan demasiado, demasiado rápido, pueden desencadenar la destrucción de la demanda y las respuestas políticas que pesan sobre las ganancias futuras.
Las decisiones políticas de la OPEP+ o de los principales productores pueden revertir un repunte aumentando la oferta.
Las empresas de servicios y petroleros son altamente cíclicas. Cuando el ciclo cambia, el poder de fijación de precios puede desvanecerse rápidamente.
En otras palabras, estos nombres pueden beneficiarse del aumento de los precios del petróleo, pero también conllevan riesgos específicos del sector, geopolíticos y a nivel de empresa que merecen una atención especial.
Observaciones clave del mercado
Los precios más altos del petróleo a menudo apoyan a las grandes integradas como Exxon y Chevron a través de márgenes ascendentes más fuertes y flujos de efectivo diversificados.
Las acciones de servicios petroleros como SLB y Baker Hughes pueden ver una demanda más fuerte cuando los productores aumentan la actividad de perforación y terminación.
Los operadores de petroleros pueden beneficiarse de tarifas de flete más altas cuando la geopolítica y los cambios de suministro aumentan los envíos de larga distancia.
Estas acciones pueden ser volátiles, por lo que la diversificación y el horizonte temporal siguen siendo importantes durante los ciclos de los productos básicos.
Las referencias en este artículo a Exxon Mobil, Chevron, SLB, Baker Hughes, Woodside, operadores de petroleros, calificaciones de consenso de analistas y objetivos de precios se incluyen solo para comentario general del mercado y no constituyen una recomendación u oferta en relación con ningún producto financiero o seguridad. Los datos de terceros, incluidas las calificaciones por consenso y los precios objetivo, pueden cambiar sin previo aviso y no se debe confiar en ellos de forma aislada. Las exposiciones de energía y transporte marítimo son cíclicas y pueden verse afectadas materialmente por la volatilidad de los precios de los productos básicos, la fijación de precios realizados, los cambios en la producción, la ejecución de proyectos, las interrupciones geopolíticas, las condiciones del mercado de carga, los desarrollos regulatorios y los cambios en el sentimiento de los inversores. Cualquier opinión sobre los posibles beneficiarios de los precios más altos del petróleo está sujeta a una incertidumbre significativa.
Antes de que los gráficos comiencen a hablar, la región sí. Durante el fin de semana, Oriente Medio pasó de tenso a cinético. Los ataques conjuntos de Estados Unidos e Israel alcanzaron objetivos dentro de Irán, y múltiples medios informaron que el líder supremo de Irán, el ayatolá Ali Khamenei, fue asesinado. Ese hecho único cambia toda la estructura de las frases del mercado y no se trata solo de geopolítica, sino de que las primas de riesgo están siendo recotizadas en tiempo real, a través de la energía, la volatilidad y las perspectivas de crecimiento mundial.
Los mercados no comercian con la tragedia, más bien comercian con la incertidumbre. Cuando la incertidumbre se encuentra en la cima de las arterias energéticas globales, el descubrimiento de precios se hace alto.
De un vistazo
Lo que pasó: Múltiples medios importantes informaron que el líder supremo de Irán, el ayatolá Ali Jamenei, fue asesinado tras ataques conjuntos de Estados Unidos e Israel dentro de Irán, y los medios estatales iraníes citados confirmaron su muerte.
En qué mercados pueden centrarse ahora: Una rápida refijación de precios de las primas de riesgo geopolítico, liderada por productos crudos y refinados, además de volatilidad entre activos a medida que los titulares impulsan la liquidez, las correlaciones y los rangos intradiarios.
Lo que aún no está sucediendo: Es posible que los mercados estén poniendo más precio a una prima de riesgo global que a una interrupción física sostenida y plenamente evidenciada del suministro.
Próximas 24 a 72 horas: Es probable que la atención se mantenga en las señales de escalada y las restricciones de segundo orden, incluido cualquier impacto en las rutas marítimas del Golfo y la vía política y diplomática, incluida cualquier dinámica del Consejo de Seguridad de la ONU.
Gancho de Australia y Asia: Las interrupciones de vuelo y espacio aéreo ya se están extendiendo más allá de la región. Para los mercados, las sensibilidades frente a Asia pueden aparecer a través de los márgenes de refinería y los costos de envío y seguros, mientras que el AUD puede comportarse como un barómetro de riesgo cuando el apetito global por el riesgo es inestable.
El aceite es el mecanismo de transmisión
El crudo Brent se repuntó hasta en 13% en las primeras operaciones del lunes 2 de marzo, al tocar alrededor de 82 dólares por barril al reportar, ya que el riesgo del Estrecho de Ormuz pasó de teórico a inmediato. El Estrecho importa porque aproximadamente una quinta parte de los envíos mundiales de petróleo y gas pasan a través de él y cuando los petroleros dudan, las aseguradoras vuelven a cotizar y las rutas se vuelven a escribir, la energía se convierte en un producto de volatilidad.
Estuche base: disrupción parcial y mayor “prima de riesgo” en crudo, con grandes oscilaciones intradía. Riesgo al alza: una desaceleración sostenida del transporte marítimo o impactos directos de infraestructura, lo que algunos analistas advierten podría empujar materialmente al alza el crudo. Riesgo a la baja: titulares de reducción de la escalada, respuestas de suministros de emergencia o una protección de envío más clara que comprima la prima de riesgo.
El VIX no se mueve en el vacío, y este aumento en la incertidumbre ya se está derramando en otras clases de activos de una manera bastante “libro de texto”. A medida que la volatilidad repone el precio, el primer instinto del mercado ha sido una fuga hacia la seguridad, junto con una lucha por las materias primas más expuestas al conflicto.
El lunes Asia abrió con ese tono: el Nikkei 225 de Japón se reportó una baja alrededor de 2.4%, y el ASX 200 de Australia bajó antes de estabilizarse. Al mismo tiempo, el posicionamiento defensivo se presentó en los paraísos seguros clásicos. Los futuros del oro subieron aproximadamente un 3% durante el fin de semana, mientras que las monedas de refugio tradicionales, lideradas por el franco suizo, atrajeron entradas inmediatas tanto contra el euro como contra el dólar estadounidense.
El riesgo de renta variable, por el contrario, se llevó el golpe. Los futuros de índices estadounidenses, incluidos el Dow y el S&P 500, abrieron a la baja a medida que los escritorios se movieron al precio en la doble amenaza de un conflicto regional más amplio y el lastre inflacionario que puede seguir a un fuerte salto en los costos de la energía.
El oro se realzó a medida que el mercado llegaba para los seguros. Al reportar el oro subió cerca de 3% en la misma sesión del lunes en que el petróleo subió. Vale la pena destacar para los comerciantes de Australia y Asia: cuando el petróleo salta y el oro salta juntos, el mercado a menudo te dice que está preocupado tanto por la inflación como por el crecimiento. Esa es una mezcla desordenada para los bancos centrales, incluido el RBA, porque la inflación impulsada por la gasolina puede aumentar incluso cuando la demanda se suaviza.
Lo que esto podría significar para la administración de riesgos de CFD
Enfoque 1: mapear el calendario de riesgos de eventos
En los mercados impulsados por los titulares, los precios pueden moverse más rápido que la liquidez. El riesgo no es solo equivocarse; también puede ser riesgo de tiempo y ejecución en condiciones volátiles.
Algunos comerciantes monitorean qué desarrollos podrían cambiar el sentimiento del mercado (por ejemplo, declaraciones oficiales o actualizaciones operativas verificadas). Si elige operar, puede valer la pena entender cómo las brechas de precios y la volatilidad podrían afectar su posición, incluso alrededor de las entradas de sesión y los anuncios importantes.
Los mercados pueden sufrir brechas o moverse rápidamente, y la ejecución de órdenes (incluidas las órdenes stop, si se utilizan) puede no ocurrir en los niveles esperados, especialmente en condiciones rápidas o baja liquidez. Las características y los resultados dependen de los términos del producto y las condiciones del mercado.
Enfoque 2: observe la ruta de la energía a la inflación
Si el crudo se mantiene elevado, los mercados pueden observar si las expectativas de inflación cambian. Si eso ocurre, podría influir en las tasas, la renta variable y los divisas y, aunque los resultados dependen de múltiples factores y pueden cambiar rápidamente.
Eso puede reflejarse en:
Rendimientos mundiales de los bonos, a medida que los mercados de tasas se ajustan.
Sensibilidad a la valoración de la renta variable, particularmente en zonas de larga duración y con alto crecimiento.
Movimientos de divisas, incluso a través del dólar australiano, el yen japonés y algunas monedas vinculadas a materias primas.
Para el contexto general del mercado (no como una recomendación para el comercio), algunos observadores supervisan:
Titulares clave y declaraciones oficiales que apuntan a una escalada o desescalada.
Acción de precios de Brent y WTI, incluyendo si los niveles elevados persisten más allá de un pico inicial.
Expectativas de inflación y precios de tasas, incluidos los movimientos en los rendimientos de los bonos y las medidas de inflación basadas en el mercado.
Señales de sentimiento de riesgo, incluidos los niveles de volatilidad y el comportamiento de futuros del índice de acciones en torno a las sesiones principales.
Asia starts the week with a fresh geopolitical shock that is already being framed in oil terms, not just security terms. The first-order move may be a repricing of risk premia and volatility across energy and macro, while markets wait to see whether this becomes a durable physical disruption or a fast-fading headline premium.
At a glance
What happened: US officials said the US carried out “Operation Absolute Resolve”, including strikes around Caracas, and that Venezuela’s President Nicolás Maduro and his wife were taken into US custody and flown to the United States (subject to ongoing verification against the cited reporting).
What markets may focus on now: Headline-driven risk premia and volatility, especially in products and heavy-crude-sensitive spreads, rather than a clean “missing barrels” shock.
What is not happening yet: Early pricing has so far looked more like a headline risk premium than a confirmed physical supply shock, though this can change quickly, with analysts pointing to ample global supply as a possible cap on sustained upside.
Next 24 to 72 hours: Market participants are likely to focus on the shape of the oil “quarantine”, the UN track, and whether this stays “one and done” or becomes open-ended.
Australia and Asia hook: AUD as a risk barometer, Asia refinery margins in diesel and heavy, and shipping and insurance where the price can show up in friction before it shows up in benchmarks.
What happened, facts fast
Before anyone had time to workshop the talking points, there were strikes, there was a raid, and there was a custody transfer. US officials say the operation culminated in Maduro and his wife being flown to the United States, where court proceedings are expected.
Then came the line that turned a foreign policy story into a markets story. President Trump publicly suggested the US would “run” Venezuela for now, explicitly tying the mission to oil.
Almost immediately after that came a message-discipline correction. Secretary of State Marco Rubio said the US would not govern Venezuela day to day, but would press for changes through an oil “quarantine” or blockade.
That tension, between maximalist presidential rhetoric and a more bureaucratically describable “quarantine”, is where the uncertainty lives. Uncertainty is what gets priced first.
Source: Adobe images
Why this is price relevant now
What’s new versus known for positioning
What’s new, and price relevant, is that the scale and outcome are not incremental. A major military operation, a claimed removal of Venezuela’s leadership from the country, and a US-led custody transfer are not the sort of things markets can safely treat as noise.
Second, the oil framing is explicit. Even if you assume the language gets sanded down later, the stated lever is petroleum. Flows, enforcement, and pressure via exports.
Third, the embargo is not just a talking point anymore. Reporting says PDVSA has begun asking some joint ventures to cut output because exports have been halted and storage is tightening, with heavy-crude and diluent constraints featuring prominently.
What’s still unknown, and where volatility comes from
Key unknowns include how strict enforcement is on water, what exemptions look like in practice, how stable the on-the-ground situation is, and which countries recognise what comes next. Those are not philosophical questions. Those are the inputs for whether this is a temporary risk premium or a durable regime shift.
Political and legal reaction, why this drives tail risk
The fastest way to understand the tail here is to watch who calls this illegal, and who calls it effective, then ask what those camps can actually do.
Internationally, reaction has been fast, with emphasis on international law and the UN Charter from key partners, and UN processes in view. In the US, lawmakers and commentators have begun debating the legal basis, including questions of authority and war powers. That matters for markets because it helps define whether this is a finite operation with an aftershock, or the opening chapter of a rolling policy regime that keeps generating headlines.
Market mechanism, the core “so what”
Here’s the key thing about oil shocks. Sometimes the headline is the shock. Sometimes the plumbing is the shock.
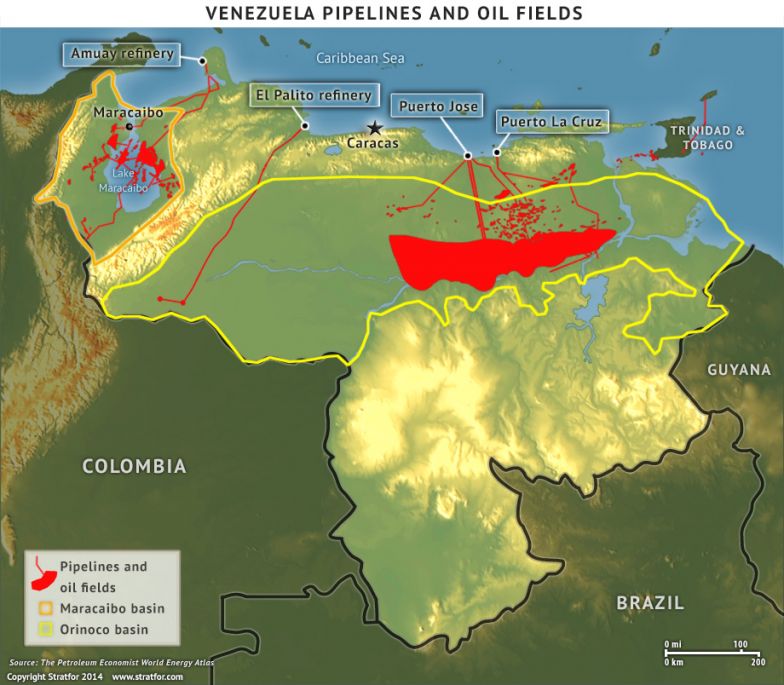
Venezuela’s heavy-crude system: Orinoco production, key pipelines, and export/refining bottlenecks.
Volumes and cushion
Venezuela is not the world’s swing producer. Its production is meaningful at the margin, but not enough by itself to imply “the world runs out of oil tomorrow”. The risk is not just volume. It is duration, disruption, and friction.
The market’s mental brake is spare capacity and the broader supply backdrop. Reporting over the weekend pointed to ample global supply as a likely cap on sustained gains, even as prices respond to risk.
Quality and transmission
Venezuela’s barrels are disproportionately extra heavy, and extra heavy crude is not just “oil”. It is oil that often needs diluent or condensate to move and process. That is exactly the kind of constraint that shows up as grade-specific tightness and product effects.
Reporting has highlighted diluent constraints and storage pressure as exports stall. Translation: even if Brent stays relatively civil, watch cracks, diesel and distillates, and any signals that “heavy substitution” is getting expensive.
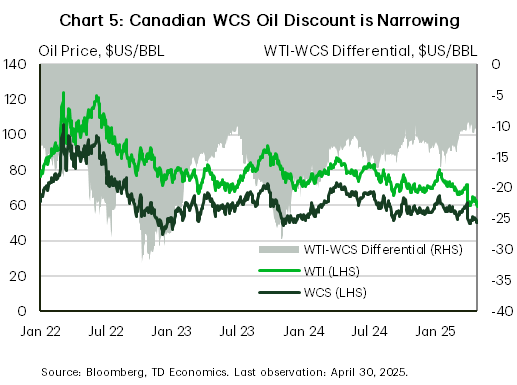
Heavy-light spread as a stress gauge: rising differentials can signal costly substitution and tighter heavy supply.
Products transmission, volatility first, pump later
If crude is the headline, products are the receipt, because products tell you what refiners can actually do with the crude they can actually get. The short-run pattern is usually: futures reprice risk fast, implied volatility pops; physical flows adapt more slowly; retail follows with a lag, and often with less drama than the first weekend of commentary promised.
For Australia and Asia desks, the bigger point is transmission. Energy moves can influence inflation expectations, which can feed into rates pricing and the dollar, and in turn affect Asia FX and broader risk, though the links are not mechanical and can vary by regime.
Some market participants also monitor refined-product benchmarks, including gasoline contracts such as reformulated gasoline blendstock, as part of that chain rather than as a stand-alone signal.
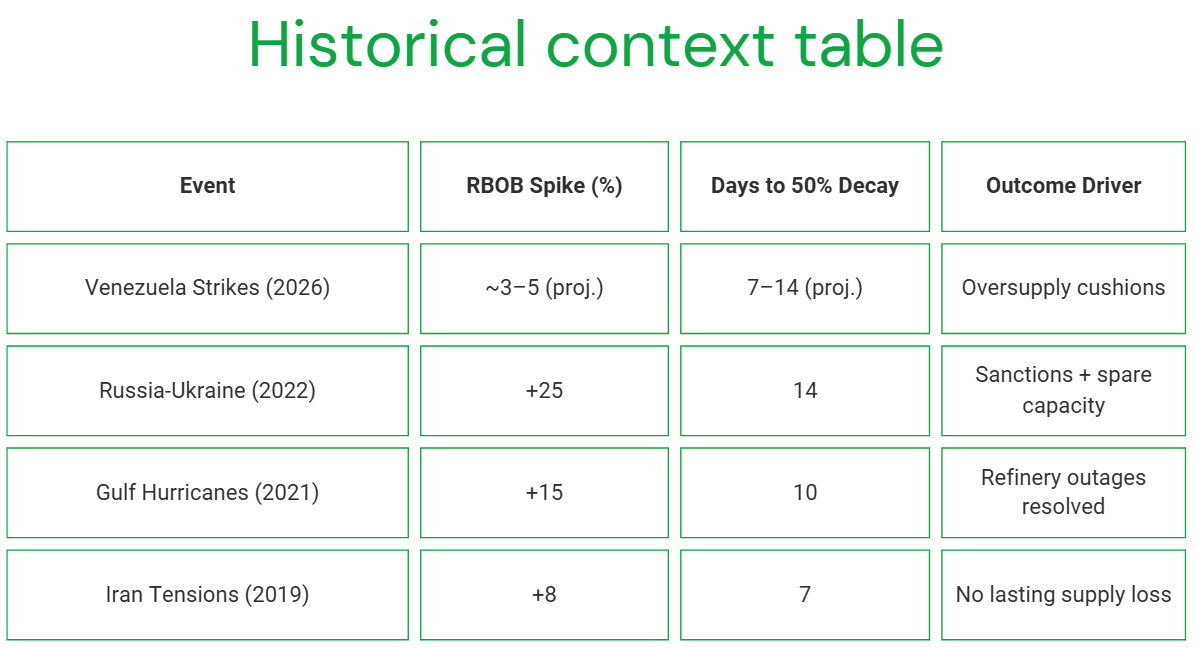
Historical context, the two patterns that matter
Two patterns matter more than any single episode.
Pattern A: scare premium. Big headline, limited lasting outage. A spike, then a fade as the market decides the plumbing still works.
Pattern B: structural. Real barrels are lost or restrictions lock in; the forward curve reprices; the premium migrates from front-month drama to whole-curve reality.
One commonly observed pattern is that when it is only premium, volatility tends to spike more than price. When it is structural, levels and time spreads move more durably.
The three possible market reactions
Contained, rhetorical: quarantine exists but porous; diplomacy churns; no second-wave actions. Premium bleeds out; volatility mean-reverts.
Escalation, prolonged control risk: “not governing” language loses credibility; repeated operations; allies fracture further. Longer-duration premium; broader risk-off impulse across FX and rates.
Australia and Asia angle
For Sydney, Singapore, and Hong Kong screens, this is less about Venezuelan retail politics and more about how a Western Hemisphere intervention bleeds into Asia pricing.
AUD is the quick and dirty risk proxy. Asia refiners care about the kind of oil and the friction cost. Heavy crude plus diluent dependency makes substitution non-trivial. If enforcement looks aggressive, the “price” can show up in freight, insurance, and spreads before it shows up in headline Brent.
Catalyst calendar, key developments markets may monitor
US policy detail: quarantine rules, enforcement posture, exemptions.
UN and allies: statements that signal whether this becomes a long legitimacy fight.
Las acciones de defensa de ASX vuelven a estar en más listas de vigilancia y según el Instituto Internacional de Investigación para la Paz de Estocolmo (SIPRI), el gasto militar mundial alcanzó aproximadamente 2.718 billones de dólares en 2024, un alza de 9.4% en términos reales.
El entorno actual de defensa de Australia se establece en la Estrategia de Defensa Nacional de 2024 y los documentos de planificación de inversiones relacionados, que describen las prioridades de financiación de la capacidad a largo plazo. Además, Canberra ha apuntado a una inversión de capacidad de 330 mil millones de dólares australianos hasta 2034, incluida la financiación adicional para combatientes de superficie, preparación, ataque de largo alcance y sistemas autónomos.
Aquí está la parte que la mayoría de la gente extraña: no todas las acciones de defensa ASX son del mismo comercio. Algunos se sientan cerca de la construcción naval. Algunos son nombres de contra-drones y algunos son operadores más pequeños y de mayor riesgo donde un contrato puede importar mucho más de lo que el mercado supone.
Estos cinco nombres no son una lista de compras, sino que son una lista de vigilancia práctica para los inversores que intentan entender dónde puede aparecer realmente el impulso de adquisiciones en el ASX.
1) Austal (ASX: ASB)
Austal es una de las empresas cotizadas en ASX más directamente expuestas al oleoducto de construcción naval de Australia, aunque la ejecución del contrato, los márgenes y el tiempo de entrega siguen siendo variables importantes.
No solo están ganando contratos aleatorios; han firmado un acuerdo legal masivo (el Acuerdo Estratégico de Construcción Naves) que los convierte en el socio oficial para la construcción de la próxima generación de buques militares de tamaño mediano de Australia en Australia Occidental.
En febrero de 2026, el gobierno dio luz verde a Austal a un proyecto de 4 mil millones de dólares. Esto no es para un solo barco, es para 8 buques “Landing Craft Heavy”. Se trata de enormes barcos de transporte (de unos 100 metros de largo) diseñados para llevar tanques pesados y equipos directamente a una playa. Pero aquí está la parte que la mayoría de la gente extraña, la construcción naval es un maratón, no un sprint.
Como puede ver en el cronograma de entrega, mientras que la construcción comienza en 2026, el barco final no se entregará hasta 2038. Para un inversionista, esto significa que Austal tiene un flujo de ingresos “garantizado” para los próximos 12 años, pero tienen que ser muy buenos en el manejo de sus costos durante ese largo período para realmente obtener ganancias.
2) Escudo del DroneShield (ASX: DRO)
Si ha visto imágenes de pequeños drones que interrumpen los campos de batalla modernos, DroneShield está construyendo parte del “interruptor de apagado”. Su enfoque es la tecnología antidrones, que incluye sistemas que detectan, interrumpen o derrotan drones utilizando guerra electrónica, sensores y herramientas dirigidas por software, en lugar de depender solo de municiones tradicionales.
A principios de 2026, DroneShield había ido más allá de la etiqueta de una prometedora start-up y se había adentrado en una fase comercial mucho más grande. Reportó ingresos para el año fiscal 2025 por 216.5 millones de dólares estadounidenses, un 276% más que en el año fiscal 2024, y dijo que inició el año fiscal 2026 con 103.5 millones de dólares de A$ en ingresos comprometidos.
Un punto que el mercado puede pasar por alto es la capa de software en el modelo. DroneShield reportó 11.6 millones de dólares estadounidenses en ingresos de Software como Servicio (SaaS) en el año fiscal 2025 y dijo que está trabajando para que SaaS represente el 30% de los ingresos dentro de cinco años. Su modelo de suscripción incluye actualizaciones de software para sistemas implementados, lo que agrega un flujo creciente de ingresos recurrentes junto con las ventas de hardware.
Entre las acciones de defensa ASX, DroneShield es una de las formas más directas de seguir el tema Counter-UAS. También es uno de los nombres donde el sentimiento puede oscilar rápidamente, porque las historias de crecimiento pueden regenerar tanto hacia arriba como hacia abajo cuando cambia el tiempo de los pedidos.
EOS construye tanto el “cerebro” como el “músculo” para plataformas militares. Es mejor conocido por los sistemas de armas remotas, que permiten a los operadores controlar torretas armadas desde el interior de vehículos protegidos, y por los sistemas láser de alta energía dirigidos a la defensa contra drones. EOS ha dicho que su rezago incondicional alcanzó alrededor de 459.1 millones de dólares estadounidenses a principios de 2026, tras una serie de victorias contractuales hasta 2025. Eso apunta a una base mucho mayor de trabajo seguro, aunque el tiempo de entrega y la conversión de ingresos siguen siendo importantes.
EOS firmó un contrato de 71.4 millones de euros, unos 125 millones de dólares australianos, con un cliente europeo para un sistema de armas láser de alta energía de 100 kilovatios. EOS dice que el sistema está diseñado para un bajo costo por disparo y puede involucrar hasta 20 drones por minuto. El gobierno australiano ha reservado 1.300 millones de dólares australianos a lo largo de 10 años para la adquisición de capacidad de contra-drones, y EOS ha revelado que formó parte de un exitoso equipo de licitación de LAND 156. Eso no garantiza ingresos futuros, pero sí soporta visibilidad a mediano plazo en un mercado al que la compañía ya se dirige.
EOS se lee como una historia de rebote, pero una que aún depende de la ejecución. La compañía se ha reorientado en torno a sistemas de armas remotas, sistemas de contra-drones y láseres, todas áreas vinculadas a un mayor gasto en defensa. La pregunta clave es si puede seguir convirtiendo el backlog y la canalización en ingresos entregados mientras mantiene la disciplina del balance.
4) Codan (ASX: CDA)
Codan a veces se deja fuera de las listas de acciones de defensa casuales porque está más diversificado. Eso puede ser un descuido. En sus resultados del primer semestre fiscal 26, Codan dijo que su negocio de Comunicaciones diseña comunicaciones de misión crítica para los mercados militares y de seguridad pública globales. Los ingresos por comunicaciones subieron 19% a 221,8 millones de dólares de A$. La compañía también dijo que DTC brindó un fuerte crecimiento de la demanda de sistemas no tripulados y de defensa, con ingresos por sistemas no tripulados que aumentaron 68% a A$73 millones. Codan dijo que aproximadamente la mitad de esos ingresos no tripulados estaban vinculados a aplicaciones de defensa operativa en zonas de conflicto.
Aquí es donde la historia se vuelve más matizada. En una canasta de acciones de defensa ASX, Codan puede ofrecer un perfil diferente, con una sensibilidad de titular menos pura, una diversificación operativa más amplia y una exposición significativa a las comunicaciones militares y los sistemas no tripulados sin ser un nombre de tema único. Esa diversificación también puede significar que las acciones no siempre se negocian como un nombre de defensa de juego puro.
HighCom se encuentra en el extremo especulativo de esta lista, y debería etiquetarse de esa manera. La compañía dice que sus dos negocios continuos son HighCom Armor, que suministra protección balística, y HighCom Technology, que suministra y mantiene pequeños y medianos sistemas aéreos no tripulados, sistemas aéreos contra-no tripulados, e ingeniería relacionada, integración, mantenimiento y apoyo logístico para la ADF y otros ejércitos regionales alineados.
En el primer trimestre del año fiscal 26, los ingresos por operaciones continuas cayeron 59% a A$10.9 millones, mientras que el EBITDA pasó a una pérdida de A$5.4 millones desde una ganancia de A$1.9 millones un año antes. HighCom también reveló 5,1 millones de dólares australianos en ingresos de HighCom Technology, incluidos 3,5 millones de dólares australianos de piezas de repuesto para sistemas aéreos no tripulados (SUAS) y 1,6 millones de dólares australianos por servicios de sostenimiento prestados al Departamento de Defensa de Australia.
Entonces sí, HighCom es una de las acciones de defensa ASX más sensibles financieramente en la junta. Pero también es el tipo de nombre más pequeño que puede mostrar cómo las adquisiciones se filtran hacia el soporte, el mantenimiento y el equipo de protección especializado.
Observaciones clave del mercado
Haga un seguimiento de los hitos del programa, no solo los titulares políticos. Las adjudicaciones de contratos, los inicios de fabricación, los cronogramas de entrega y el trabajo de mantenimiento a menudo importan más que un solo día de anuncio.
Separe la exposición pura de la exposición diversificada. DroneShield y EOS están más cerca de los temas concentrados de tecnología de defensa, mientras que Codan aporta exposición a las comunicaciones dentro de una combinación de negocios más amplia.
Vea temas de capacidad soberana en Australia. Austal y EOS están vinculados a la fabricación local, la integración y las cadenas de suministro australianas, lo que respalda el tema de capacidad soberana más amplio en este grupo.
Presta atención a los balances y conversión de efectivo. El impulso de las adquisiciones puede ser real incluso cuando el tiempo se vuelve desordenado. La última mitad de HighCom es un recordatorio de eso.
Los titulares de defensa pueden parecer inmediatos. Por lo general, las ganancias no lo son. El principal trabajo naval de Austal se extiende hasta la próxima década. Los contratos EOS se entregan a lo largo de varios años. El flujo de pedidos de DroneShield parece sólido, pero la compañía aún separa los ingresos comprometidos de una oportunidad de canalización más amplia. HighCom muestra la otra cara de la moneda. La exposición a las adquisiciones no se traduce automáticamente en una ejecución financiera fluida.
Las referencias a las acciones de defensa que cotizan en ASX son solo información general, no una recomendación para comprar, vender o mantener cualquier título o CFD. Estas acciones pueden ser altamente volátiles y son sensibles al momento de los contratos, la política gubernamental, la geopolítica, el riesgo de ejecución y las condiciones del mercado. Las expectativas de backlog, pipeline e ingresos no son garantías de performance futuro.
Tres bancos centrales están decidiendo las tasas simultáneamente, el crudo Brent se balancea salvajemente alrededor de 100 dólares el barril, y una guerra en el Medio Oriente está reescribiendo las perspectivas de inflación en tiempo real. Pase lo que pase esta semana podría marcar la pauta para los mercados para el resto de 2026.
Datos rápidos
El Banco de la Reserva de Australia (RBA) anuncia su próxima decisión sobre la tasa de efectivo el martes, con los mercados ahora valorando una probabilidad del 66% de una segunda subida a 4.1%.
Algunos analistas han advertido que la guerra de Irán podría empujar la inflación estadounidense a 3.5% para fin de año y retrasar los recortes de tipos de la Fed hasta septiembre, lo que convierte el diagrama de puntos del FOMC de esta semana en el más observado en años.
El crudo Brent está coqueteando con 100 dólares el barril después de que Irán lanzara lo que medios estatales describieron como su “operación más intensa desde el comienzo de la guerra”.
RBA: ¿Australia volverá a subir?
El RBA elevó la tasa de caja por primera vez en dos años a 3.85% en su reunión de febrero luego de que la inflación repuntara materialmente en el segundo semestre de 2025.
La pregunta ahora es si vuelve a moverse antes incluso de ver la próxima impresión trimestral del IPC, que no vence hasta el 29 de abril.
El vicegobernador Andrew Hauser reconoció antes de la reunión que los formuladores de políticas enfrentan una decisión genuinamente dividida, moldeada por señales económicas conflictivas en el país y la creciente inestabilidad en el extranjero.
Actualmente los mercados financieros asignan alrededor de un 66% de probabilidad a otra alza, con un aumento de mayo considerado prácticamente seguro independientemente de lo que ocurra el lunes.
Fechas clave
Decisión sobre la tasa de efectivo del RBA: martes 17 marzo, 14:30 h AEDT
Conferencia de prensa del gobernador Bullock: martes 17 marzo, 15:30 h AEDT
Monitorear
Cualquier referencia de Bullock a nuevas subidas es probable en mayo
FOMC: Es probable que todos los ojos estén puestos en el diagrama de puntos
El FOMC se reúne del 17 al 18 de marzo, con la declaración de política programada para las 2:00pm ET del 18 de marzo y la conferencia de prensa del presidente Jerome Powell a las 2:30pm. El CME FedWatch muestra una probabilidad del 99% de que la Fed mantenga las tasas en 3.50% a 3.75%.
El verdadero accionar se encuentra en el Resumen de Proyecciones Económicas (SEP) y el diagrama de puntos. El punto medio actual muestra un corte de 25 puntos básicos para 2026. Si cambia a dos cortes, eso es dóciles y alcistas para los activos de riesgo. Si se desplaza a cero recortes o agrega una subida de tasas a la proyección, los mercados podrían reaccionar en la otra dirección.
Para complicar aún más las cosas, el mandato de Powell como Presidente de la Reserva Federal expira el 23 de mayo de 2026. Kevin Warsh es el principal candidato para reemplazarlo, visto como más duro en política monetaria. Cualquier comentario de Powell sobre esta transición podría mover los mercados independientemente de la decisión de tasa en sí.
Fecha clave
Decisión de tasa FOMC + Gráfica SEP/punto: jueves 19 de marzo, 4:00 a.m. AEDT
Conferencia de prensa de Powell: jueves 19 de marzo, 4:30 a.m. AEDT
Monitorear
El lenguaje de Powell sobre el petróleo y la inflación arancelaria.
Reacción de rendimiento de tesorería a 2 años.
Reajuste de precios de FedWatch de CME para cualquier cambio en la probabilidad de corte de septiembre.
Banco de Japón: Podría adelantarse un mayor endurecimiento
El BOJ se reúne del 18 al 19 de marzo, con la decisión prevista para el jueves por la mañana, hora de Tokio. La tasa de política actual se sitúa en 0.75% (un máximo de 30 años), y la reunión de enero de 2026 produjo una retención en una votación de 8-1.
El gobernador Ueda ha categorizado la reunión de marzo como “en vivo”, señalando que el cronograma para un mayor endurecimiento podría “adelantarse” si las negociaciones salariales de primavera de Shunto arrojan resultados más fuertes de lo esperado.
Esos resultados van a comenzar a fluir durante la semana, convirtiéndolos en el insumo crítico para la decisión del BOJ. Nomura espera que las subidas salariales de Shunto 2026 lleguen en torno al 5.0%, incluida la antigüedad, con un crecimiento salarial base de aproximadamente 3.4%. Si los resultados confirman esa trayectoria, el caso de una alza en marzo se fortalece considerablemente.
La complicación es el telón de fondo global. Japón importa aproximadamente el 90% de sus necesidades energéticas, y el petróleo alrededor de 100 dólares por barril está empujando al alza los costos de importación y amenazando con agregar presión inflacionaria. Una subida del BOJ a un shock petrolero global sería un movimiento inusualmente audaz.
La mayoría de los participantes del mercado aún se inclinan hacia una espera en esta reunión, siendo abril o julio vistos como el momento más probable para el próximo movimiento.
Fecha clave
Decisión sobre la tasa de política del BOJ (actualmente 0.75%): Jueves 19 de marzo, mañana AEDT
Monitorear
Resultados salariales de Shunto como principal detonante de un alza en marzo.
Idioma de la conferencia de prensa de Ueda y orientación a futuro en abril y julio.
El crudo Brent tocó brevemente 119,50 dólares por barril a principios de semana antes de caer 17% a menos de US$80, luego rebotando hacia US$95 ante señales mixtas de Washington sobre el Estrecho de Ormuz.
Al jueves, Brent estaba de vuelta por más de 100 dólares, ya que Irán lanzó nuevos ataques contra el transporte marítimo comercial y la liberación de la reserva de la AIE no logró brindar un alivio significativo.
En el escenario donde un conflicto más prolongado inflige daños a la infraestructura energética, los analistas estiman que el IPC podría subir a 3.5% para fines de 2026, con los precios de la gasolina acercándose a los 5 dólares por galón en el segundo trimestre.
Para esta semana, el petróleo actúa como una macro meta-variable. Cada titular geopolítico, señal de alto el fuego, ataque de petroleros, liberación de reservas y comentario de Trump podrían mover acciones, bonos y monedas en tiempo real.
Monitorear
Cualquier flujo de petrolero reanudado del Estrecho de Ormuz.
Los ataques estadounidenses e israelíes contra Irán lanzados el 28 de febrero hicieron que el crudo Brent superara los 119 dólares el barril, el oro por encima de los 5.200 dólares, y acciones de defensa a máximos históricos.
En ese contexto, los inversionistas se están enfocando en un pequeño grupo de nombres vinculados a materias primas que pueden seguir siendo sensibles a nuevos movimientos en petróleo, GNL y oro. La pregunta clave es si el choque resulta sostenido, o si un alto el fuego, la normalización del transporte marítimo o una acción política eliminan parte de la prima de riesgo geopolítico.
1. ExxonMobil (NYSE: XOM)
ExxonMobil ha sido uno de los beneficiarios más claros del aumento de precios. Las acciones alcanzaron un máximo histórico de US$159,60 a principios de marzo y están subiendo aproximadamente 28% en lo que va de año.
La compañía produce 4.7 millones de barriles de petróleo equivalente por día, tiene un punto de equilibrio en la Cuenca Pérmica de alrededor de 35 dólares por barril, y está comprometida con 20 mil millones de dólares en recompras para 2026.
Wells Fargo elevó su objetivo de precios a 183 dólares desde 156 dólares tras la escalada, mientras que el consenso de analistas más amplio se sitúa en torno a US$140—US$144. Sin embargo, XOM ya está negociando por encima de muchos objetivos de consenso, y la interrupción de su socio de GNL QatarEnergy plantea un viento en contra operativo a corto plazo.
Qué ver
Si las interrupciones de Ormuz persisten más allá de 4 a 6 semanas.
Una liberación de las existencias de emergencia del G7 o un alto el fuego creíble podrían comprimir la prima de riesgo de guerra.
Cualquier ajuste a los objetivos de consenso de los analistas.
Chevron tocó un nuevo máximo de 52 semanas de 196,76 dólares a principios de marzo y ha subido aproximadamente 24% en lo que va de año.
El punto de equilibrio Brent de la compañía para dividendos y gastos de capital ronda los 50 dólares por barril. Esto significa que a los precios actuales del petróleo por encima de los 90 dólares, está generando un importante flujo de caja libre.
Sin embargo, Chevron ha detenido temporalmente las operaciones en un campo de gas frente a la costa de Israel tras la actividad de misiles en la región, y desde entonces el stock ha retrocedido más del 1% ya que el conflicto afecta directamente sus operaciones.
Qué ver
Actualizaciones operativas directas de los activos israelíes y de Oriente Medio de Chevron.
Cualquier otra paralización que pueda pesar sobre la producción a corto plazo.
Retención de crudo por encima de los 90 dólares, lo que mantiene a Chevron generando un importante flujo de caja libre.
3. Woodside Energy (ASX: WDS/NYSE: WDS)
Dado que Qatar detuvo la producción después de los ataques con aviones no tripulados iraníes, los compradores de toda Asia y Europa están buscando un suministro alternativo. Woodside, como uno de los mayores productores y exportadores de GNL de Australia, se encuentra fuera de la zona de conflicto y está bien posicionado para beneficiarse de la demanda redireccionada.
Los analistas advirten que la sustitución real lleva tiempo debido a las restricciones de envío y del contrato, lo que significa que el aumento de precios puede ser más duradero que un simple comercio al contado. Los precios del gas de referencia del TTF europeo se dispararon más del 50% en una semana, amplificando el entorno de margen para los productores de GNL que no son de Oriente Medio.
Qué ver
El ritmo y el cronograma de cualquier reinicio de la producción de GNL de Qatar.
Si QatarEnergy permanece fuera de línea durante semanas, Woodside podría comenzar a recontratar compradores europeos a precios puntuales elevados.
Un movimiento del dólar australiano al alza podría ser un viento en contra que vale la pena rastrear para las ganancias denominadas en USD.
4. Cheniere Energy (NYSE: GNL)
Junto a Woodside, Cheniere es el beneficiario estadounidense más directo de la interrupción del GNL de Qatar. Al ser el mayor exportador de GNL de Estados Unidos, vio fortaleza intradiaria al inicio de la semana del conflicto.
La producción nacional de energía de Estados Unidos ha amortiguado a los consumidores estadounidenses de lo peor de la conmoción, pero la prima de exportación se ha ampliado a medida que los compradores europeos y asiáticos pagan por el suministro fuera del Golfo.
El comercio es “geopolíticamente sensible”, y cualquier resolución podría revertir rápidamente al alza. Pero mientras la infraestructura de gas de Ormuz y del Golfo siga comprometida, Cheniere está posicionada para beneficiarse estructuralmente.
Qué ver
Cualquier avance diplomático que reabra las rutas marítimas del Golfo.
Anuncios de nuevos contratos de rebajas a largo plazo firmados a precios actuales elevados.
El oro repuntó 5.2% en una sola sesión el 1 de marzo, al tocar los US$5,246/oz, ya que los mercados buscaban activos de refugio seguro. Newmont, el mayor productor de oro del mundo, ha visto sus reservas efectivamente revaluadas a estos precios.
Está al alza junto con la ganancia anual del 24% del oro hasta la fecha, y sus costos de sostenimiento total permanecen en gran medida fijos.
No obstante, los mineros de oro se vendieron bruscamente el 4 de marzo, y Newmont cayó casi 8% en una sola sesión, ya que un desapalancamiento más amplio del riesgo afectó a las renta variable de metales preciosos.
El stock se ha recuperado desde entonces, pero la volatilidad sigue siendo alta. Para los inversionistas de mayor duración, los analistas señalan que las jurisdicciones mineras “seguras” como Canadá, Australia y Nevada están ordenando nuevas primas a medida que la inestabilidad de Oriente Medio eleva el valor del suministro geopolíticamente seguro.
Qué ver
Si el oro puede aguantar más de US$5,000/oz.
Un conflicto prolongado podría acelerar un ciclo de M&A en mineros de oro junior.
Un alto el fuego o un evento amplio de desapalancamiento de la equidad como riesgo principal a monitorear.
Lockheed Martin alcanzó un nuevo máximo histórico de 676.70 dólares el 3 de marzo, un aumento de más del 4% durante el día. Sus cazas F-35, municiones guiadas de precisión, sistemas THAAD y artillería de cohetes HIMARS son fundamentales para la campaña aérea en curso.
El Departamento de Defensa de Estados Unidos se está moviendo para reponer las reservas de municiones, y la ambición declarada de Trump de elevar el presupuesto de defensa de Estados Unidos a 1,5 billones de dólares para 2027 agrega un viento de cola estructural a más largo plazo más allá del conflicto inmediato.
Las acciones de defensa están subiendo en medio de la clásica fijación de precios de riesgo geopolítico, pero los inversores deben tener en cuenta que el flujo contractual real tarda tiempo en traducirse en ganancias, y las valoraciones ya reflejan un optimismo considerable.
Qué ver
El ritmo de las órdenes de reposición de municiones del Departamento de Defensa de Estados Unidos.
La rapidez con la que gana el contrato se traduce en un crecimiento del backlog.
Barrick está siguiendo la racha histórica del oro junto a Newmont, con las acciones subidas bruscamente en lo que va de año. Se encuentra en una capitalización bursátil de aproximadamente 78 mil millones de dólares estadounidenses y está reportando proyecciones récord de flujo de caja libre, ya que sus costos de mantenimiento total se mantienen muy por debajo de los precios al contado actuales.
Al igual que Newmont, experimentó una fuerte venta en una sola sesión de más del 8% durante el evento más amplio de desapalancamiento del 4 de marzo, antes de recuperarse parcialmente.
Las empresas de regalías y streaming como Wheaton Precious Metals (WPM) están siendo favorecidas por algunos inversores como una forma más protegida contra la inflación de acceder al oro al alza, dada su menor exposición a los costos operativos. Pero Barrick sigue siendo uno de los mineros de oro que cotizan en bolsa más grandes del mundo, con ganancias que son muy sensibles a los cambios en el precio del oro.
Qué ver
La capacidad del oro para mantener por encima de US$5,000/oz.
Cualquier Barrick se mueve hacia adquisiciones de mineros junior.
Inflación de costos de energía, ya que el aumento de los precios de los combustibles podría comenzar a exprimir los márgenes operativos de los mineros.