The Psychological effect behind the Stock Markets’ Most Volatile Month. Generally, the volatility in October has been well-above average, and this does have a psychological effect on investors’ minds. The biggest market crashes – Black Monday/Tuesday and other turmoil had occurred in October making it the “Jinx Month”.
The sharp and sudden drop that occurred last week shows that October is living up to its reputation of being the Stock Market Most Volatile Month. It could be investors being superstitious, but so far, there are not known drivers only some theories which include: The return from summer vacations The federal government’s fiscal year which begins on the first of October The third-quarter corporate earnings. On average, more daily moves above 1% are recorded in October.
The S&P500 recorded three more than 1% daily moves already which kind of justified the belief. World Equity Indices (% Change) – Month-to-date Source: Bloomberg Terminal Besides the myth, rising yields are set to be the challenge for this quarter and appear to be the primary driver behind the recent surge in volatility. The prospect of more instability is high and quite alarming given that the US stock markets are already inflated.
The actions by the Fed have also put the stock markets in a dangerous bubble. Are the markets prone to more volatility? Alternatively, does the recent fluctuations signal a bear market?
The recent weeks of volatility are evidence that trading equity will likely remain choppy in the short-term. At this stage, it is difficult to recognise whether the bull market has reached the top and investors need to get out before the bear market or whether investors should stay away from the “buy the dip” strategy in the emerging and Asian equity markets. All in all, short-term investors might find it hard to catch the rhythm of the stock markets, but if investors were to maintain a long-term view, it might be worth listening to Warren Buffet advice: “Buy, Hold and Don’t watch too closely when the market sells off.”
By
GO Markets
The information provided is of general nature only and does not take into account your personal objectives, financial situations or needs. Before acting on any information provided, you should consider whether the information is suitable for you and your personal circumstances and if necessary, seek appropriate professional advice. All opinions, conclusions, forecasts or recommendations are reasonably held at the time of compilation but are subject to change without notice. Past performance is not an indication of future performance. Go Markets Pty Ltd, ABN 85 081 864 039, AFSL 254963 is a CFD issuer, and trading carries significant risks and is not suitable for everyone. You do not own or have any interest in the rights to the underlying assets. You should consider the appropriateness by reviewing our TMD, FSG, PDS and other CFD legal documents to ensure you understand the risks before you invest in CFDs.
Saham pertahanan ASX kembali ke daftar pantauan dan menurut Stockholm International Peace Research Institute (SIPRI), pengeluaran militer global mencapai sekitar US$2,718 triliun pada 2024, naik 9,4% secara riil.
Pengaturan pertahanan Australia saat ini ditetapkan dalam Strategi Pertahanan Nasional 2024 dan dokumen perencanaan investasi terkait, yang menguraikan prioritas pendanaan kemampuan jangka panjang. Selain itu, Canberra telah menunjuk investasi kemampuan A$330 miliar hingga 2034, termasuk dana tambahan untuk kombatan permukaan, kesiapsiagaan, serangan jarak jauh dan sistem otonom.
Inilah bagian yang kebanyakan orang lewatkan: tidak semua saham pertahanan ASX adalah perdagangan yang sama. Beberapa duduk dekat dengan pembuatan kapal angkatan laut. Beberapa adalah nama kontra-drone dan beberapa adalah operator yang lebih kecil dan berisiko lebih tinggi di mana satu kontrak mungkin jauh lebih penting daripada yang diasumsikan pasar.
Kelima nama ini bukan daftar beli, melainkan daftar pantauan praktis bagi investor yang mencoba memahami di mana momentum pengadaan sebenarnya muncul di ASX.
1) Australia (ASX: ASB)
Austal adalah salah satu perusahaan yang terdaftar di ASX yang paling langsung terkena pipa pembuatan kapal angkatan laut Australia, meskipun pelaksanaan kontrak, margin, dan waktu pengiriman tetap menjadi variabel penting.
Mereka tidak hanya memenangkan kontrak acak; mereka telah menandatangani perjanjian hukum besar-besaran (Perjanjian Pembuatan Kapal Strategis) yang menjadikan mereka mitra resmi untuk membangun generasi berikutnya kapal militer menengah Australia di Australia Barat.
Pada Februari 2026, pemerintah memberi Austal lampu hijau pada proyek senilai $4 miliar. Ini bukan hanya untuk satu kapal, ini untuk 8 kapal “Landing Craft Heavy”. Ini adalah kapal pengangkut besar (panjang sekitar 100 meter) yang dirancang untuk membawa tank berat dan peralatan langsung ke pantai. Tapi inilah bagian yang kebanyakan orang lewatkan, pembuatan kapal adalah maraton, bukan sprint.
Seperti yang Anda lihat di garis waktu pengiriman, sementara konstruksi dimulai pada tahun 2026, kapal terakhir tidak akan dikirim sampai 2038. Bagi seorang investor, ini berarti Austal memiliki aliran pendapatan “terjamin” selama 12 tahun ke depan, tetapi mereka harus sangat pandai mengelola biaya mereka selama periode yang lama untuk benar-benar menghasilkan keuntungan.
2) DroneShield (ASX: DRO)
Jika Anda telah melihat rekaman drone kecil yang mengganggu medan perang modern, DroneShield sedang membangun bagian dari “sakelar mati”. Fokusnya adalah teknologi kontra-drone, termasuk sistem yang mendeteksi, mengganggu atau mengalahkan drone menggunakan perang elektronik, sensor, dan alat yang dipimpin perangkat lunak, daripada hanya mengandalkan amunisi tradisional.
Pada awal 2026, DroneShield telah bergerak melampaui label start-up yang menjanjikan dan ke fase komersial yang jauh lebih besar. Ini melaporkan pendapatan FY2025 sebesar A $216.5 juta, naik 276% dari FY2024, dan mengatakan memulai FY2026 dengan pendapatan berkomitmen A $103.5 juta.
Satu hal yang mungkin diabaikan pasar adalah lapisan perangkat lunak dalam model. DroneShield melaporkan pendapatan Software as a Service (SaaS) sebesar A$11.6 juta pada FY2025 dan mengatakan sedang bekerja menuju SaaS yang menghasilkan 30% dari pendapatan dalam lima tahun. Model berlangganannya mencakup pembaruan perangkat lunak untuk sistem yang digunakan, yang menambahkan aliran pendapatan berulang yang berkembang di samping penjualan perangkat keras.
Di antara saham pertahanan ASX, DroneShield adalah salah satu cara paling langsung untuk mengikuti tema Counter-UAS. Ini juga salah satu nama di mana sentimen dapat berayun dengan cepat, karena cerita pertumbuhan dapat berubah kembali ke atas dan ke bawah ketika waktu pesanan berubah.
EOS membangun “otak” dan “otot” untuk platform militer. Hal ini terkenal karena sistem senjata jarak jauh, yang memungkinkan operator untuk mengontrol menara bersenjata dari dalam kendaraan yang dilindungi, dan untuk sistem laser berenergi tinggi yang ditujukan untuk pertahanan kontra-drone. EOS mengatakan backlog tanpa syarat mencapai sekitar A$459,1 juta pada awal 2026, menyusul serangkaian kemenangan kontrak hingga 2025. Itu menunjukkan basis pekerjaan yang aman yang jauh lebih besar, meskipun waktu pengiriman dan konversi pendapatan masih penting.
EOS menandatangani kontrak senilai €71,4 juta, sekitar A$125 juta, dengan pelanggan Eropa untuk sistem senjata laser energi tinggi 100 kilowatt. EOS mengatakan sistem ini dirancang untuk biaya rendah per bidikan dan dapat melibatkan hingga 20 drone per menit. Pemerintah Australia telah menyisihkan 1,3 miliar dolar Australia selama 10 tahun untuk akuisisi kemampuan kontra-drone, dan EOS telah mengungkapkan bahwa mereka adalah bagian dari tim tawaran LAND 156 yang sukses. Itu tidak menjamin pendapatan di masa depan, tetapi mendukung visibilitas jangka menengah di pasar yang sudah ditargetkan perusahaan.
EOS dibaca sebagai cerita rebound, tetapi yang masih bergantung pada eksekusi. Perusahaan telah berorientasi ulang di sekitar sistem senjata jarak jauh, sistem kontra-drone dan laser, semua area terkait dengan pengeluaran pertahanan yang lebih kuat. Pertanyaan kuncinya adalah apakah ia dapat terus mengubah backlog dan pipeline menjadi pendapatan yang disampaikan sambil mempertahankan disiplin neraca.
4) Kode (ASX: CDA)
Codan terkadang ditinggalkan dari daftar saham pertahanan biasa karena lebih beragam. Itu mungkin kekeliruan. Dalam hasil H1 FY26, Codan mengatakan bisnis Komunikasi merancang komunikasi penting untuk pasar keamanan militer dan publik global. Pendapatan komunikasi naik 19% menjadi A $221,8 juta. Perusahaan juga mengatakan DTC menghasilkan pertumbuhan yang kuat dari permintaan pertahanan dan sistem tak berawak, dengan pendapatan sistem tak berawak naik 68% menjadi A$73 juta. Codan mengatakan sekitar setengah dari pendapatan tak berawak itu terkait dengan aplikasi pertahanan operasional di zona konflik.
Di sinilah cerita menjadi lebih bernuansa. Dalam sekeranjang saham pertahanan ASX, Codan dapat menawarkan profil yang berbeda, dengan sensitivitas judul yang kurang murni, diversifikasi operasi yang lebih luas dan paparan yang berarti terhadap komunikasi militer dan sistem tak berawak tanpa menjadi nama tema tunggal. Diversifikasi itu juga dapat berarti saham tidak selalu diperdagangkan seperti nama pertahanan murni.
HighCom berada di akhir spekulatif daftar ini, dan harus diberi label seperti itu. Perusahaan mengatakan dua bisnisnya yang berkelanjutan adalah HighCom Armor, yang memasok perlindungan balistik, dan HighCom Technology, yang memasok dan memelihara sistem udara kecil dan menengah tanpa awak, sistem udara tanpa awak, dan rekayasa terkait, integrasi, pemeliharaan dan dukungan logistik untuk ADF dan militer regional yang selaras lainnya.
Di H1 FY26, pendapatan dari operasi berkelanjutan turun 59% menjadi A $10,9 juta, sementara EBITDA bergerak ke kerugian A $5.4 juta dari laba A$1.9 juta tahun sebelumnya. HighCom juga mengungkapkan pendapatan A$5,1 juta dalam HighCom Technology, termasuk A$3,5 juta dari suku cadang sistem udara kecil tanpa awak (SUAS) dan A $1,6 juta dari layanan keberlanjutan yang diberikan kepada Departemen Pertahanan Australia.
Jadi ya, HighCom adalah salah satu saham pertahanan ASX yang lebih sensitif secara finansial di dewan direksi. Tapi itu juga jenis nama yang lebih kecil yang dapat menunjukkan bagaimana pengadaan menyaring ke dalam peralatan pendukung, keberlanjutan, dan perlindungan spesialis.
Pengamatan pasar utama
Lacak tonggak program, bukan hanya berita utama politik. Penghargaan kontrak, produksi dimulai, jadwal pengiriman, dan pekerjaan pemeliharaan sering kali lebih penting dari satu hari pengumuman.
Pisahkan eksposur permainan murni dari eksposur yang beragam. DroneShield dan EOS lebih dekat dengan tema teknologi pertahanan terkonsentrasi, sementara Codan membawa paparan komunikasi dalam bauran bisnis yang lebih luas.
Tonton tema kemampuan kedaulatan di Australia. Austal dan EOS terkait dengan manufaktur lokal, integrasi, dan rantai pasokan Australia, yang mendukung tema kemampuan kedaulatan yang lebih luas dalam grup ini.
Perhatikan neraca dan konversi tunai. Momentum pengadaan bisa menjadi nyata bahkan ketika waktu menjadi berantakan. Setengah terakhir HighCom adalah pengingat akan hal itu.
Berita utama pertahanan bisa terlihat langsung. Penghasilan biasanya tidak. Pekerjaan angkatan laut utama Austal membentang hingga dekade berikutnya. Kontrak EOS dikirimkan selama beberapa tahun. Aliran pesanan DroneShield tampak kuat, tetapi perusahaan masih memisahkan pendapatan berkomitmen dari peluang pipeline yang lebih luas. HighCom menunjukkan sisi lain dari koin. Paparan pengadaan tidak secara otomatis diterjemahkan ke dalam eksekusi keuangan yang lancar.
Referensi ke saham pertahanan yang terdaftar di ASX hanya informasi umum, bukan rekomendasi untuk membeli, menjual, atau memegang sekuritas atau CFD apa pun. Saham-saham ini bisa sangat fluktuatif dan sensitif terhadap waktu kontrak, kebijakan pemerintah, geopolitik, risiko eksekusi, dan kondisi pasar. Backlog, pipeline, dan ekspektasi pendapatan bukanlah jaminan kinerja masa depan.
Siap untuk berdagang di luar mata uang utama? Buka akun · Masuk
Pada tanggal 28 Februari 2026, ketika serangan gabungan AS dan Israel dimulai, angka-angka di layar mulai bergerak dengan cara yang terasa klinis, bahkan ketika kenyataan di lapangan dengan kematian tragis korban sipil di Iran, terasa sama sekali tidak. Pasar, seperti yang mereka katakan, tidak memiliki kompas moral, melainkan mereka memiliki mesin penimbang dan saat ini, mereka menimbang transisi seluruh ekonomi global dari model “just-in-time” ke siklus “just-in-case”.
Pasar apa yang memberi sinyal
Pada 2 Maret, rekaman indeks tetap berhati-hati sementara pertahanan naik. Secara historis, konflik dapat mempercepat pengisian ulang dan pesanan tetapi seberapa besar (dan seberapa cepat) masih tergantung pada anggaran, persetujuan, dan hambatan pengiriman.
Para Pemenang
1. Hanwha Aerospace (012450.KS)
Hanwha adalah salah satu nama yang lebih aktif diperdagangkan terkait dengan tema “K-Defence”, pasar perusahaan yang semakin dipandang sebagai pemasok yang dapat diskalakan ke dalam siklus artileri dan amunisi global yang ketat. Kapasitas dan kredibilitas pengiriman.
Ketika pengisian menjadi mendesak, kemampuan untuk memproduksi dalam skala sering kali sama pentingnya dengan platform itu sendiri. Permintaan ekspor yang terkait dengan sistem seperti K9 Thunder dan Chunmoo telah memperkuat narasi aliran pesanan yang tahan lama bahkan ketika hasilnya masih bergantung pada anggaran, persetujuan, dan jadwal pengiriman.
Hal-hal penting yang dapat menggerakkan sentimen: pembaruan buku pesanan, irama produksi, dan pengumuman ekspor lanjutan.
2. Northrop Grumman (NOC)
Northrop beralih ke fokus karena investor meninjau kembali eksposur terhadap modernisasi strategis dan program besar yang berjalan lama. Pasar pertahanan yang sering dilihat sebagai misi kritis dapat bertahan di seluruh siklus. Ini kurang sekitar seperempat dan lebih tentang apakah momentum tetap stabil jika prioritas modernisasi tetap ada (dan apakah garis waktu bergeser jika tidak).
Variabel kunci yang dapat menggerakkan sentimen: Kecepatan pengadaan, waktu kontrak, dan bahasa pendanaan terkait program.
3. Perusahaan RTX (RTX)
RTX kembali ke pusat rekaman saat investor memberi harga siklus pengisian pencegat dan ekonomi pertahanan udara tempo tinggi. Penggeseran mahal dan ketika tingkat penggunaan meningkat, pemerintah biasanya harus mengisi kembali persediaan dan, dalam banyak kasus, mendanai ekspansi produksi yang dapat memperpanjang backlog dan meningkatkan visibilitas pendapatan.
Variabel kunci yang dapat menggerakkan sentimen: Pesanan pengisian ulang, indikator ekspansi manufaktur, dan throughput pengiriman.
4. Lockheed Martin (LMT)
Lockheed menarik perhatian ketika pasar berfokus pada permintaan pertahanan rudal dan pertanyaan yang dihadapi setiap meja pengadaan dalam lingkungan tempo tinggi: seberapa cepat inventaris dapat dibangun kembali? Jika pemanfaatan tetap tinggi, pemenang cenderung menjadi kontraktor yang paling tepat untuk meningkatkan produksi dan memberikan yang andal. Paparan pertahanan rudal Lockheed membuatnya tetap terkait erat dengan narasi pengisian ulang itu.
Variabel kunci yang dapat menggerakkan sentimen: sinyal ramp produksi, ekonomi unit, dan irama pesanan yang digerakkan oleh anggaran.
5. Sistem BAE (BAL)
Dengan backlog £83,6 miliar dan peran sentral dalam program kapal selam AUKUS, BAE beralih ke fokus karena bagian Eropa menandakan ambisi belanja pertahanan yang lebih tinggi. Saham naik 6,11% ke level tertinggi 52 minggu di tengah rotasi “risk-off”, dengan pedagang mengamati tonggak sejarah AUKUS dan pengadaan pertahanan udara dan rudal Eropa, termasuk “Sky Shield”.
Variabel kunci yang dapat menggerakkan sentimen: Katalis potensial adalah peningkatan yang jelas dalam pengeluaran Jerman yang mengangkat aliran pesanan di seluruh unit BAE Eropa, sementara risiko utama termasuk lonjakan tajam dalam imbal hasil emas Inggris, volatilitas pound sterling yang diperbarui, atau pengambilan keuntungan “ancaman perdamaian”.
800
The Losers: tidak setiap 'saham perang' naik
6. AeroVironment (AVAV)
AeroVironment melonjak 18% pada pembukaan sebelum jatuh 17% intraday setelah laporan bahwa Angkatan Luar Angkasa AS membuka kembali kontrak senilai US$1,4 miliar. Langkah ini menyoroti bagaimana proses pengadaan dan risiko kontrak dapat mendorong volatilitas, bahkan dalam lingkungan tematik yang mendukung.
7. Pertahanan Kratos (KTOS)
Kratos duduk di tema drone dan amunisi yang berkeliaran yang menarik perhatian saat konflik Timur Tengah meningkat. Saham masih terjual setelah pendapatan, menyoroti risiko sektor pertahanan umum. Kratos mengumumkan penawaran ekuitas lanjutan besar dalam kisaran US$1,2 miliar hingga US$1,4 miliar, langkah ini memperkuat neraca dan dapat mendukung investasi program masa depan.
Untuk pedagang yang berfokus pada narasi “premium konflik” jangka pendek, pengenceran dapat dengan cepat mengubah pengaturan. Bahkan ketika kondisi permintaan tampak mendukung, pasar dapat harga kembali saham jika setiap pemegang saham pada akhirnya memiliki porsi bisnis yang lebih kecil.
8. Mesin Intuitif (LUNR)
Beberapa nama teknologi ruang angkasa spekulatif tertinggal karena investor tampaknya menyukai perusahaan dengan pendapatan terkait pertahanan yang lebih mapan.
9. Boeing (BA)
Boeing turun sekitar 2,5% pada sesi tersebut. Sementara divisi pertahanannya bermakna, bisnis komersialnya bisa lebih sensitif terhadap permintaan penerbangan, gangguan wilayah udara, dan pergerakan harga minyak.
10. Spirit AeroSystems (SPR)
Spirit AeroSystems tetap terkait erat dengan siklus produksi pesawat global sebagai pemasok aerostruktur utama.Hasil terbaru menunjukkan kerugian yang melebar meskipun penjualan lebih tinggi, mencerminkan kenaikan biaya produksi yang sedang berlangsung pada program pesawat utama. Tekanan ini telah membebani kepercayaan investor dalam prospek jangka pendek. Akuisisi yang direncanakan oleh Boeing pada akhirnya dapat membentuk kembali posisi perusahaan dalam rantai pasokan, tetapi risiko eksekusi dan stabilitas produksi tetap menjadi pusat bagaimana harga pasar saham.
Apa yang harus ditonton selanjutnya
Eskalasi vs de-eskalasi: Pergeseran ke arah diplomasi atau diskusi gencatan senjata dapat dengan cepat mengubah sentimen seputar stok pertahanan.
Minyak dan pengiriman: Lonjakan energi dapat memperketat kondisi keuangan dan menekan sektor siklus.
Anggaran dan penghargaan: Pergerakan harga terkadang dapat mendahului keputusan kontrak, dengan kejelasan tiba ketika penghargaan diselesaikan.
Kapasitas produksi: Perusahaan dengan rekam jejak produksi dan pengiriman yang terbukti sering menarik perhatian investor paling banyak.
Kendala rantai pasokan: Tanah langka, propulsi, dan elektronik tetap menjadi hambatan potensial yang dapat membatasi seberapa cepat skala produksi.
Lensa jangka panjang
Konflik Iran 2026 pertama dan terutama merupakan tragedi kemanusiaan. Untuk pasar, ini juga dapat mewakili pergeseran dalam bagaimana pengeluaran keamanan nasional diprioritaskan dalam kerangka fiskal. Jika pengeluaran pertahanan tetap meningkat selama beberapa tahun, perusahaan dengan kapasitas manufaktur yang dapat diskalakan dan tumpukan teknologi terintegrasi dapat menarik perhatian investor yang berkelanjutan. Konon, pasar bergerak dalam siklus. Tema struktural dapat bertahan, tetapi mereka juga dapat harga ulang dengan cepat ketika asumsi berubah. Tetap analitis dan sadar risiko tetap penting.
Referensi ke perusahaan, sektor, atau pergerakan pasar tertentu disediakan hanya untuk komentar pasar umum dan bukan merupakan rekomendasi, penawaran atau ajakan untuk membeli atau menjual produk keuangan apa pun. Reaksi pasar terhadap peristiwa geopolitik atau makroekonomi dapat bergejolak dan tidak dapat diprediksi, dan hasil mungkin berbeda secara material dari ekspektasi.
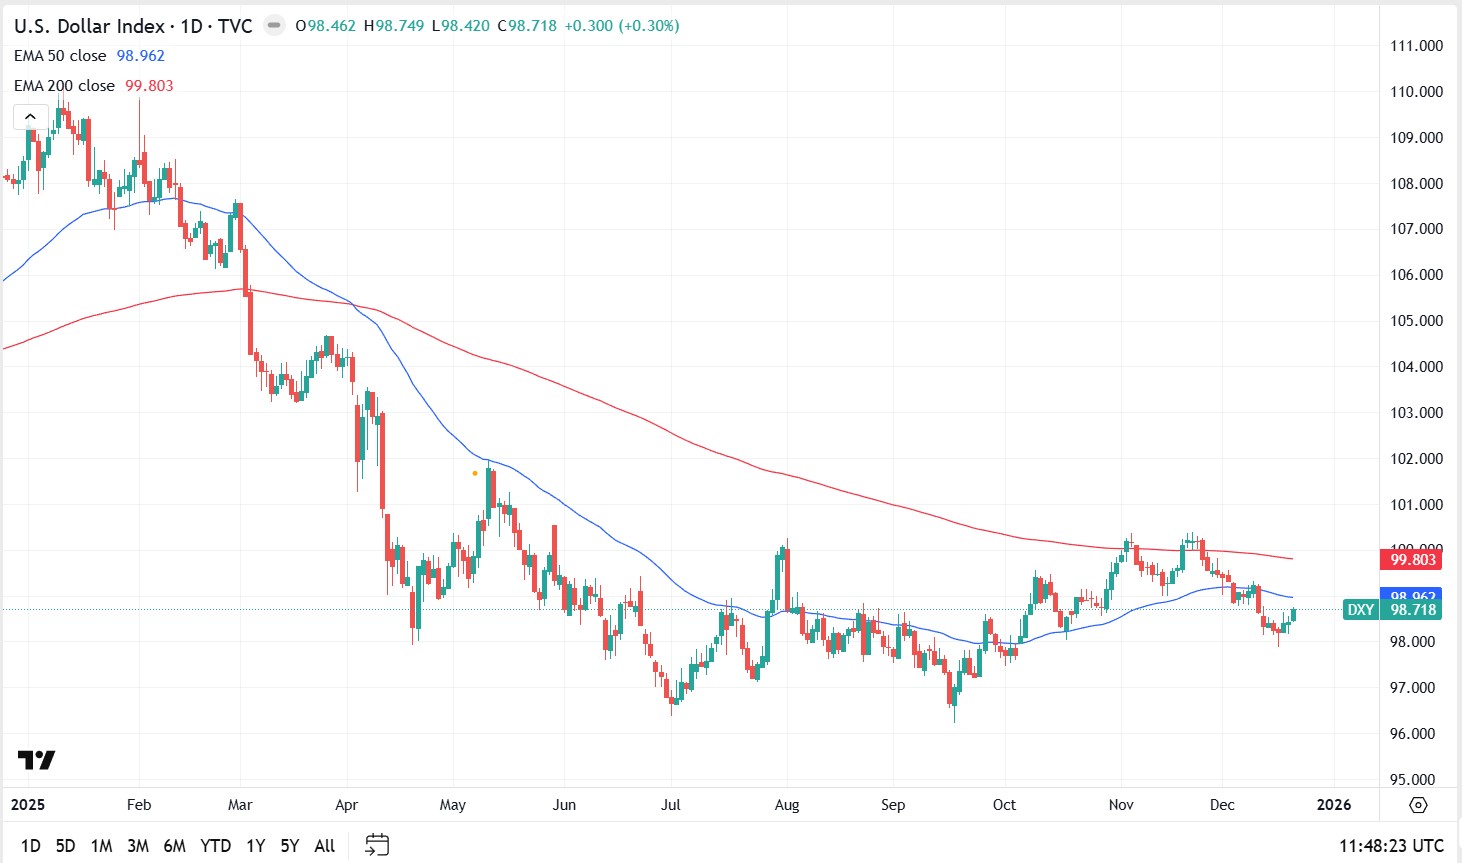
2025 has seen a material decline in the fortunes of the greenback. A technical structure breakdown early in the year was followed by a breach of the 200-day moving average (MA) at the end of Q1. The index then entered correction territory, printing a three-year low at the end of Q2.
Since then, we have seen attempts to build a technical base, including a re-test of the end-of-June lows in mid-September. However, buying pressure has not been strong enough to push price back above the technically critical and psychologically important 100 level.
What the levels suggest from here
As things stand, the index remains more than 10% lower for 2025. On this technical view, the index may revisit the 96 area. However, technical levels can fail and outcomes depend on multiple factors.
US dollar index
Source: TradingView
The key question for 2026
The key question remains: are we likely to see further losses in the early part of next year and beyond, or will current support hold?
We cannot assess the US dollar in isolation and any outlook is shaped by internal and global factors, not least its relative strength versus other major currencies. Many of these drivers are interrelated, but four potential headwinds stand out for any US dollar recovery. Collectively, they may keep downside pressure in play.
Four headwinds for any US dollar recovery
1. The US dollar as a safe-haven trade
One scenario where US dollar support has historically been evident is during major global events, slowdowns and market shocks. However, the more muted response of the US dollar during risk-off episodes this year suggests a shift away from the historical norm, with fewer sustained US dollar rallies.
Instead, throughout 2025, some investors appearedto favour gold, and at other times, FX and even equities, rather than into the US dollar. If this change in behaviour persists through 2026, it could make recovery harder, even if global economic pressure builds over the year ahead.
2. US versus global trade
Trade policy is harder to measure objectively, and outcomes can be difficult to predict. That said, trade battles driven by tariffs on US imports are often viewed as an additional potential drag on the US dollar.
The impact may be twofold if additional strain is placed on the US economy through:
a slowdown in global trade volumes as impacted countries seek alternative trade relationships, with supply chain distortions that may not favour US growth
pressure on US corporate profit margins as tariffs lift costs for importers
3. Removal of quantitative tightening
The Fed formally halted its balance sheet reduction, quantitative tightening (QT), as of 1 December 2025, ending a program that shrank assets by roughly US$2.4 trillion since mid-2022.
Traditionally, ending QT is seen as marginally negative for the US dollar because it stops the withdrawal of liquidity, can ease global funding conditions, and may reduce the scarcity that can support dollar demand. Put simply, more dollars in the system can soften the currency’s support at the margin, although outcomes have varied historically and often depend on broader financial conditions.
4. Interest rate differential
Interest rate differential (IRD) is likely to be a primary driver of US dollar strength, or otherwise, in the months ahead. The latest FOMC meeting delivered the expected 0.25% cut, with attention on guidance for what may come next.
Even after a softer-than-expected CPI print, markets have been reluctant to price aggressive near-term easing. At the time of writing, less than a 20% chance of a January cut is priced in, and it may be March before we see the next move.
The Fed is balancing sticky inflation against a jobs market under pressure, with the headline rate back at levels last seen in 2012. The practical takeaway is that a more accommodative stance may add to downward pressure on the US dollar.
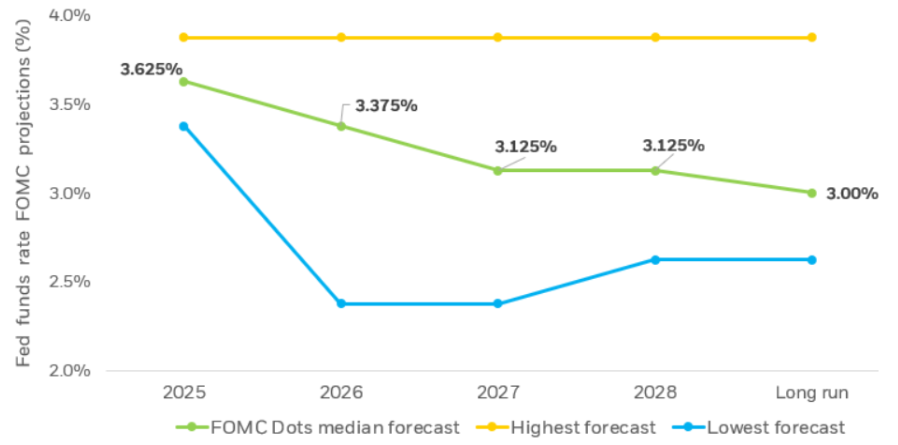
Current expectations imply around two rate cuts through 2026, with the potential for further easing beyond that, broadly consistent with the median projections shown in the chart below. These are forecasts rather than guarantees, and they can shift as economic data and policy guidance evolve.
Source: US Federal Reserve, Summart of Economic Projections
Saham pertahanan ASX kembali ke daftar pantauan dan menurut Stockholm International Peace Research Institute (SIPRI), pengeluaran militer global mencapai sekitar US$2,718 triliun pada 2024, naik 9,4% secara riil.
Pengaturan pertahanan Australia saat ini ditetapkan dalam Strategi Pertahanan Nasional 2024 dan dokumen perencanaan investasi terkait, yang menguraikan prioritas pendanaan kemampuan jangka panjang. Selain itu, Canberra telah menunjuk investasi kemampuan A$330 miliar hingga 2034, termasuk dana tambahan untuk kombatan permukaan, kesiapsiagaan, serangan jarak jauh dan sistem otonom.
Inilah bagian yang kebanyakan orang lewatkan: tidak semua saham pertahanan ASX adalah perdagangan yang sama. Beberapa duduk dekat dengan pembuatan kapal angkatan laut. Beberapa adalah nama kontra-drone dan beberapa adalah operator yang lebih kecil dan berisiko lebih tinggi di mana satu kontrak mungkin jauh lebih penting daripada yang diasumsikan pasar.
Kelima nama ini bukan daftar beli, melainkan daftar pantauan praktis bagi investor yang mencoba memahami di mana momentum pengadaan sebenarnya muncul di ASX.
1) Australia (ASX: ASB)
Austal adalah salah satu perusahaan yang terdaftar di ASX yang paling langsung terkena pipa pembuatan kapal angkatan laut Australia, meskipun pelaksanaan kontrak, margin, dan waktu pengiriman tetap menjadi variabel penting.
Mereka tidak hanya memenangkan kontrak acak; mereka telah menandatangani perjanjian hukum besar-besaran (Perjanjian Pembuatan Kapal Strategis) yang menjadikan mereka mitra resmi untuk membangun generasi berikutnya kapal militer menengah Australia di Australia Barat.
Pada Februari 2026, pemerintah memberi Austal lampu hijau pada proyek senilai $4 miliar. Ini bukan hanya untuk satu kapal, ini untuk 8 kapal “Landing Craft Heavy”. Ini adalah kapal pengangkut besar (panjang sekitar 100 meter) yang dirancang untuk membawa tank berat dan peralatan langsung ke pantai. Tapi inilah bagian yang kebanyakan orang lewatkan, pembuatan kapal adalah maraton, bukan sprint.
Seperti yang Anda lihat di garis waktu pengiriman, sementara konstruksi dimulai pada tahun 2026, kapal terakhir tidak akan dikirim sampai 2038. Bagi seorang investor, ini berarti Austal memiliki aliran pendapatan “terjamin” selama 12 tahun ke depan, tetapi mereka harus sangat pandai mengelola biaya mereka selama periode yang lama untuk benar-benar menghasilkan keuntungan.
2) DroneShield (ASX: DRO)
Jika Anda telah melihat rekaman drone kecil yang mengganggu medan perang modern, DroneShield sedang membangun bagian dari “sakelar mati”. Fokusnya adalah teknologi kontra-drone, termasuk sistem yang mendeteksi, mengganggu atau mengalahkan drone menggunakan perang elektronik, sensor, dan alat yang dipimpin perangkat lunak, daripada hanya mengandalkan amunisi tradisional.
Pada awal 2026, DroneShield telah bergerak melampaui label start-up yang menjanjikan dan ke fase komersial yang jauh lebih besar. Ini melaporkan pendapatan FY2025 sebesar A $216.5 juta, naik 276% dari FY2024, dan mengatakan memulai FY2026 dengan pendapatan berkomitmen A $103.5 juta.
Satu hal yang mungkin diabaikan pasar adalah lapisan perangkat lunak dalam model. DroneShield melaporkan pendapatan Software as a Service (SaaS) sebesar A$11.6 juta pada FY2025 dan mengatakan sedang bekerja menuju SaaS yang menghasilkan 30% dari pendapatan dalam lima tahun. Model berlangganannya mencakup pembaruan perangkat lunak untuk sistem yang digunakan, yang menambahkan aliran pendapatan berulang yang berkembang di samping penjualan perangkat keras.
Di antara saham pertahanan ASX, DroneShield adalah salah satu cara paling langsung untuk mengikuti tema Counter-UAS. Ini juga salah satu nama di mana sentimen dapat berayun dengan cepat, karena cerita pertumbuhan dapat berubah kembali ke atas dan ke bawah ketika waktu pesanan berubah.
EOS membangun “otak” dan “otot” untuk platform militer. Hal ini terkenal karena sistem senjata jarak jauh, yang memungkinkan operator untuk mengontrol menara bersenjata dari dalam kendaraan yang dilindungi, dan untuk sistem laser berenergi tinggi yang ditujukan untuk pertahanan kontra-drone. EOS mengatakan backlog tanpa syarat mencapai sekitar A$459,1 juta pada awal 2026, menyusul serangkaian kemenangan kontrak hingga 2025. Itu menunjukkan basis pekerjaan yang aman yang jauh lebih besar, meskipun waktu pengiriman dan konversi pendapatan masih penting.
EOS menandatangani kontrak senilai €71,4 juta, sekitar A$125 juta, dengan pelanggan Eropa untuk sistem senjata laser energi tinggi 100 kilowatt. EOS mengatakan sistem ini dirancang untuk biaya rendah per bidikan dan dapat melibatkan hingga 20 drone per menit. Pemerintah Australia telah menyisihkan 1,3 miliar dolar Australia selama 10 tahun untuk akuisisi kemampuan kontra-drone, dan EOS telah mengungkapkan bahwa mereka adalah bagian dari tim tawaran LAND 156 yang sukses. Itu tidak menjamin pendapatan di masa depan, tetapi mendukung visibilitas jangka menengah di pasar yang sudah ditargetkan perusahaan.
EOS dibaca sebagai cerita rebound, tetapi yang masih bergantung pada eksekusi. Perusahaan telah berorientasi ulang di sekitar sistem senjata jarak jauh, sistem kontra-drone dan laser, semua area terkait dengan pengeluaran pertahanan yang lebih kuat. Pertanyaan kuncinya adalah apakah ia dapat terus mengubah backlog dan pipeline menjadi pendapatan yang disampaikan sambil mempertahankan disiplin neraca.
4) Kode (ASX: CDA)
Codan terkadang ditinggalkan dari daftar saham pertahanan biasa karena lebih beragam. Itu mungkin kekeliruan. Dalam hasil H1 FY26, Codan mengatakan bisnis Komunikasi merancang komunikasi penting untuk pasar keamanan militer dan publik global. Pendapatan komunikasi naik 19% menjadi A $221,8 juta. Perusahaan juga mengatakan DTC menghasilkan pertumbuhan yang kuat dari permintaan pertahanan dan sistem tak berawak, dengan pendapatan sistem tak berawak naik 68% menjadi A$73 juta. Codan mengatakan sekitar setengah dari pendapatan tak berawak itu terkait dengan aplikasi pertahanan operasional di zona konflik.
Di sinilah cerita menjadi lebih bernuansa. Dalam sekeranjang saham pertahanan ASX, Codan dapat menawarkan profil yang berbeda, dengan sensitivitas judul yang kurang murni, diversifikasi operasi yang lebih luas dan paparan yang berarti terhadap komunikasi militer dan sistem tak berawak tanpa menjadi nama tema tunggal. Diversifikasi itu juga dapat berarti saham tidak selalu diperdagangkan seperti nama pertahanan murni.
HighCom berada di akhir spekulatif daftar ini, dan harus diberi label seperti itu. Perusahaan mengatakan dua bisnisnya yang berkelanjutan adalah HighCom Armor, yang memasok perlindungan balistik, dan HighCom Technology, yang memasok dan memelihara sistem udara kecil dan menengah tanpa awak, sistem udara tanpa awak, dan rekayasa terkait, integrasi, pemeliharaan dan dukungan logistik untuk ADF dan militer regional yang selaras lainnya.
Di H1 FY26, pendapatan dari operasi berkelanjutan turun 59% menjadi A $10,9 juta, sementara EBITDA bergerak ke kerugian A $5.4 juta dari laba A$1.9 juta tahun sebelumnya. HighCom juga mengungkapkan pendapatan A$5,1 juta dalam HighCom Technology, termasuk A$3,5 juta dari suku cadang sistem udara kecil tanpa awak (SUAS) dan A $1,6 juta dari layanan keberlanjutan yang diberikan kepada Departemen Pertahanan Australia.
Jadi ya, HighCom adalah salah satu saham pertahanan ASX yang lebih sensitif secara finansial di dewan direksi. Tapi itu juga jenis nama yang lebih kecil yang dapat menunjukkan bagaimana pengadaan menyaring ke dalam peralatan pendukung, keberlanjutan, dan perlindungan spesialis.
Pengamatan pasar utama
Lacak tonggak program, bukan hanya berita utama politik. Penghargaan kontrak, produksi dimulai, jadwal pengiriman, dan pekerjaan pemeliharaan sering kali lebih penting dari satu hari pengumuman.
Pisahkan eksposur permainan murni dari eksposur yang beragam. DroneShield dan EOS lebih dekat dengan tema teknologi pertahanan terkonsentrasi, sementara Codan membawa paparan komunikasi dalam bauran bisnis yang lebih luas.
Tonton tema kemampuan kedaulatan di Australia. Austal dan EOS terkait dengan manufaktur lokal, integrasi, dan rantai pasokan Australia, yang mendukung tema kemampuan kedaulatan yang lebih luas dalam grup ini.
Perhatikan neraca dan konversi tunai. Momentum pengadaan bisa menjadi nyata bahkan ketika waktu menjadi berantakan. Setengah terakhir HighCom adalah pengingat akan hal itu.
Berita utama pertahanan bisa terlihat langsung. Penghasilan biasanya tidak. Pekerjaan angkatan laut utama Austal membentang hingga dekade berikutnya. Kontrak EOS dikirimkan selama beberapa tahun. Aliran pesanan DroneShield tampak kuat, tetapi perusahaan masih memisahkan pendapatan berkomitmen dari peluang pipeline yang lebih luas. HighCom menunjukkan sisi lain dari koin. Paparan pengadaan tidak secara otomatis diterjemahkan ke dalam eksekusi keuangan yang lancar.
Referensi ke saham pertahanan yang terdaftar di ASX hanya informasi umum, bukan rekomendasi untuk membeli, menjual, atau memegang sekuritas atau CFD apa pun. Saham-saham ini bisa sangat fluktuatif dan sensitif terhadap waktu kontrak, kebijakan pemerintah, geopolitik, risiko eksekusi, dan kondisi pasar. Backlog, pipeline, dan ekspektasi pendapatan bukanlah jaminan kinerja masa depan.
Siap untuk berdagang di luar mata uang utama? Buka akun · Masuk
Tiga bank sentral menentukan suku bunga secara bersamaan, minyak mentah Brent berayun liar di sekitar US $100 per barel, dan perang di Timur Tengah menulis ulang prospek inflasi secara real time. Apa pun yang terjadi minggu ini dapat mengatur nada pasar untuk sisa tahun 2026.
Fakta singkat
Bank Cadangan Australia (RBA) mengumumkan keputusan suku bunga tunai berikutnya pada hari Selasa, dengan pasar sekarang menetapkan peluang 66% untuk kenaikan kedua menjadi 4,1%.
Beberapa analis telah memperingatkan perang Iran dapat mendorong inflasi AS menjadi 3,5% pada akhir tahun dan menunda penurunan suku bunga Fed hingga September, menjadikan plot dot FOMC minggu ini yang paling diawasi ketat dalam beberapa tahun.
Minyak mentah Brent menggoda US$100 per barel setelah Iran meluncurkan apa yang digambarkan media pemerintah sebagai “operasi paling intens sejak awal perang.”
RBA: Akankah Australia naik lagi?
RBA menaikkan suku bunga tunai untuk pertama kalinya dalam dua tahun menjadi 3,85% pada pertemuan Februari setelah inflasi meningkat secara material pada paruh kedua tahun 2025.
Pertanyaannya sekarang adalah apakah itu bergerak lagi bahkan sebelum melihat cetakan CPI kuartalan berikutnya, yang tidak akan jatuh tempo sampai 29 April.
Wakil Gubernur Andrew Hauser mengakui menjelang pertemuan bahwa pembuat kebijakan menghadapi keputusan yang benar-benar terpecah, dibentuk oleh sinyal ekonomi yang saling bertentangan di dalam negeri dan meningkatnya ketidakstabilan di luar negeri.
Pasar keuangan saat ini menetapkan sekitar 66% probabilitas untuk kenaikan lain, dengan kenaikan Mei dianggap hampir pasti terlepas dari apa yang terjadi pada hari Senin.
Tanggal utama
Keputusan Suku Bunga RBA: Selasa, 17 Maret, 14:30 AEDT
FOMC: Kemungkinan besar, semua mata tertuju pada plot titik
FOMC bertemu pada 17-18 Maret, dengan pernyataan kebijakan dijadwalkan pukul 14:00 ET pada 18 Maret dan konferensi pers Ketua Jerome Powell pada pukul 14:30. CME FedWatch menunjukkan probabilitas 99% bahwa Fed mempertahankan suku bunga pada 3,50% hingga 3,75%.
Tindakan sebenarnya ada di Ringkasan Proyeksi Ekonomi (SEP) dan plot titik. Titik median saat ini menunjukkan satu potongan 25-titik basis untuk 2026. Jika bergeser ke dua pemotongan, itu dovish dan bullish untuk aset berisiko. Jika bergeser ke nol pemotongan atau menambahkan kenaikan suku bunga ke dalam proyeksi, pasar dapat bereaksi ke arah lain.
Lebih lanjut memperumit masalah, masa jabatan Powell sebagai Ketua Federal Reserve berakhir pada 23 Mei 2026. Kevin Warsh adalah kandidat utama untuk menggantikannya, dipandang lebih hawkish dalam kebijakan moneter. Setiap komentar dari Powell tentang transisi ini dapat menggerakkan pasar secara independen dari keputusan suku bunga itu sendiri.
Tanggal Kunci
Keputusan Suku Bunga FOMC+Plot Sep/DOT: Kamis 19 Maret, 4:00 pagi AEDT
Konferensi pers Powell: Kamis 19 Maret, 4:30 pagi AEDT
Memantau
Bahasa Powell tentang minyak dan inflasi tarif.
Reaksi imbal hasil Treasury 2 tahun.
Harga ulang CME FedWatch untuk setiap perubahan dalam probabilitas pemotongan September.
Bank of Japan: Pengetatan lebih lanjut bisa dilakukan
BOJ bertemu pada 18-19 Maret, dengan keputusan yang diharapkan Kamis pagi waktu Tokyo. Suku bunga kebijakan saat ini berada di 0.75% (tertinggi 30 tahun), dan pertemuan Januari 2026 menghasilkan penahanan dalam suara 8-1.
Gubernur Ueda telah mengkategorikan pertemuan Maret sebagai “langsung,” mencatat jadwal untuk pengetatan lebih lanjut dapat “dibawa ke depan” jika negosiasi upah musim semi Shunto menghasilkan hasil yang lebih kuat dari perkiraan.
Hasil-hasil tersebut akan mulai mengalir selama seminggu, menjadikannya masukan penting untuk keputusan BOJ. Nomura memperkirakan kenaikan upah Shunto pada 2026 akan mencapai sekitar 5,0%, termasuk senioritas, dengan pertumbuhan gaji pokok sekitar 3,4%. Jika hasil mengkonfirmasi lintasan itu, kasus untuk kenaikan bulan Maret menguat secara signifikan.
Komplikasinya adalah latar belakang global. Jepang mengimpor sekitar 90% dari kebutuhan energinya, dan minyak sekitar US $100 per barel mendorong kenaikan biaya impor dan mengancam akan menambah tekanan inflasi. Kenaikan BOJ ke guncangan minyak global akan menjadi langkah yang luar biasa berani.
Sebagian besar pelaku pasar masih condong ke arah penahanan pada pertemuan ini, dengan April atau Juli dipandang sebagai waktu yang lebih mungkin untuk langkah berikutnya.
Tanggal Kunci
Keputusan Suku Bunga Kebijakan BOJ (saat ini 0,75%): Kamis 19 Maret, pagi AEDT
Memantau
Hasil upah Shunto sebagai pemicu utama kenaikan bulan Maret.
Bahasa konferensi pers Ueda dan panduan ke depan pada bulan April dan Juli.
Minyak mentah Brent sempat menyentuh US$119,50 per barel pada awal pekan sebelum turun 17% menjadi di bawah US $80, kemudian rebound menuju US $95 di tengah sinyal beragam dari Washington tentang Selat Hormuz.
Pada hari Kamis, Brent kembali lebih dari US $100 karena Iran melancarkan serangan baru terhadap pengiriman komersial dan rilis cadangan IEA gagal membawa bantuan yang berarti.
Dalam skenario di mana konflik yang lebih lama menyebabkan kerusakan pada infrastruktur energi, analis memperkirakan CPI dapat naik menjadi 3,5% pada akhir 2026, dengan harga bensin mendekati US $5 per galon pada kuartal kedua.
Untuk minggu ini, minyak bertindak sebagai meta-variabel makro. Setiap berita geopolitik, sinyal gencatan senjata, serangan tanker, pelepasan cadangan, dan komentar Trump dapat menggerakkan ekuitas, obligasi, dan mata uang secara real time.
Memantau
Setiap aliran tanker Selat Hormuz yang dilanjutkan.
Serangan AS-Israel terhadap Iran yang diluncurkan pada 28 Februari membuat minyak mentah Brent melonjak melewati US $119 per barel, emas di atas US $5.200, dan stok pertahanan ke level tertinggi sepanjang masa.
Dengan latar belakang itu, investor fokus pada sekelompok kecil nama terkait komoditas yang mungkin tetap sensitif terhadap pergerakan lebih lanjut dalam minyak, LNG dan emas. Pertanyaan kuncinya adalah apakah guncangan terbukti berkelanjutan, atau apakah gencatan senjata, normalisasi pengiriman, atau tindakan kebijakan menghilangkan sebagian dari premi risiko geopolitik.
1. Exxon Mobil (NYSE: XOM)
ExxonMobil telah menjadi salah satu penerima manfaat paling jelas dari lonjakan harga. Saham mencapai rekor tertinggi US$159,60 pada awal Maret dan naik sekitar 28% tahun-ke-saat ini.
Perusahaan memproduksi 4,7 juta barel setara minyak per hari, memiliki titik impas Permian Basin sekitar US $35/barel, dan berkomitmen untuk pembelian kembali US$20 miliar untuk tahun 2026.
Wells Fargo menaikkan target harga menjadi US$183 dari US$156 menyusul eskalasi, sementara konsensus analis yang lebih luas berada di sekitar US$140-$144. Namun, XOM sudah diperdagangkan di atas banyak target konsensus, dan gangguan terhadap mitra LNG-nya QatarEnergy menimbulkan hambatan operasional jangka pendek.
Apa yang harus ditonton
Apakah gangguan Hormuz bertahan lebih dari 4-6 minggu.
Rilis cadangan darurat G7 atau gencatan senjata yang kredibel dapat menekan premi risiko perang.
Setiap penyesuaian terhadap target konsensus analis.
Chevron menyentuh level tertinggi 52 minggu baru di US$196,76 pada awal Maret dan telah meningkat sekitar 24% tahun-ke-saat ini.
Impas Brent perusahaan untuk dividen dan belanja modal berada di sekitar US $50/barel. Ini berarti bahwa pada harga Minyak saat ini di atas US $90, itu menghasilkan arus kas bebas yang signifikan.
Namun, Chevron telah menghentikan sementara operasi di ladang gas di lepas pantai Israel menyusul aktivitas rudal di wilayah tersebut, dan stok telah turun lebih dari 1% karena konflik secara langsung mempengaruhi operasinya.
Apa yang harus ditonton
Pembaruan operasional langsung dari aset Timur Tengah dan Israel Chevron.
Penghentian lebih lanjut yang dapat membebani produksi jangka pendek.
Minyak mentah bertahan di atas US $90, yang membuat Chevron menghasilkan arus kas bebas yang signifikan.
3. Energi Woodside (ASX: WDS/NYSE: WDS)
Dengan Qatar menghentikan produksi setelah serangan drone Iran, pembeli di seluruh Asia dan Eropa berebut pasokan alternatif. Woodside, sebagai salah satu produsen dan eksportir LNG terbesar di Australia, berada di luar zona konflik dan berada di posisi yang baik untuk mendapatkan keuntungan dari permintaan yang dialihkan.
Analis memperingatkan bahwa substitusi aktual membutuhkan waktu karena kendala pengiriman dan kontrak, yang berarti kenaikan harga mungkin lebih tahan lama daripada perdagangan spot sederhana. Harga gas acuan TTF Eropa melonjak lebih dari 50% dalam seminggu, memperkuat lingkungan margin untuk produsen LNG non-Timur Tengah.
Apa yang harus ditonton
Kecepatan dan garis waktu memulai kembali produksi LNG Qatar.
Jika QatarEnergy tetap offline selama berminggu-minggu, Woodside dapat mulai mengontrak kembali pembeli Eropa dengan harga spot yang lebih tinggi.
Pergerakan dolar Australia yang lebih tinggi bisa menjadi hambatan yang layak dilacak untuk pendapatan dalam denominasi USD.
4. Energi Cheniere (NYSE: LNG)
Bersama Woodside, Cheniere adalah penerima manfaat paling langsung AS dari gangguan LNG Qatar. Sebagai pengekspor LNG terbesar di Amerika Serikat, ia melihat kekuatan intraday pada awal minggu konflik.
Produksi energi domestik AS telah menyangga konsumen Amerika dari kejutan terburuk, tetapi premi ekspor telah melebar karena pembeli Eropa dan Asia membayar untuk pasokan non-Teluk.
Perdagangan ini “sensitif secara geopolitik,” dan resolusi apa pun dapat membalikkan kenaikan dengan cepat. Tetapi selama Hormuz dan infrastruktur gas Teluk tetap terganggu, Cheniere diposisikan untuk mendapat manfaat secara struktural.
Apa yang harus ditonton
Setiap terobosan diplomatik yang membuka kembali jalur pelayaran Teluk.
Pengumuman kontrak offtake jangka panjang baru yang ditandatangani dengan harga tinggi saat ini.
Emas melonjak 5,2% dalam satu sesi pada 1 Maret, menyentuh US $5.246/oz, karena pasar mencari aset safe-haven. Newmont, produsen emas terbesar di dunia, telah melihat cadangannya secara efektif dinilai kembali pada harga ini.
Ini naik bersamaan dengan kenaikan 24% dari tahun ke hari ini, dan biaya pelestarian keseluruhannya sebagian besar tetap tetap.
Namun, penambang emas terjual tajam pada 4 Maret, dan Newmont turun hampir 8% dalam satu sesi karena deleveraging risiko yang lebih luas mengenai ekuitas logam mulia.
Saham telah pulih sejak itu, tetapi volatilitas tetap tinggi. Untuk investor jangka panjang, analis mencatat bahwa yurisdiksi pertambangan “aman” seperti Kanada, Australia, dan Nevada memerintahkan premi baru karena ketidakstabilan Timur Tengah meningkatkan nilai pasokan yang aman secara geopolitik.
Apa yang harus ditonton
Apakah emas dapat bertahan di atas US $5.000/oz.
Konflik yang berkepanjangan dapat mempercepat siklus M&A di penambang emas junior.
Gencatan senjata atau peristiwa deleveraging ekuitas yang luas sebagai risiko utama untuk dipantau.
Lockheed Martin mencapai level tertinggi baru sepanjang masa sebesar US$676,70 pada 3 Maret, naik lebih dari 4% untuk hari itu. Pesawat tempur F-35, amunisi berpemandu presisi, sistem THAAD, dan artileri roket HIMARS adalah pusat kampanye udara yang sedang berlangsung.
Departemen Pertahanan AS bergerak untuk mengisi kembali stok amunisi, dan ambisi Trump yang dinyatakan untuk meningkatkan anggaran pertahanan AS menjadi US $1,5 triliun pada tahun 2027 menambah angin struktural jangka panjang di luar konflik langsung.
Saham pertahanan naik di tengah penetapan harga risiko geopolitik klasik, tetapi investor harus mencatat bahwa arus kontrak aktual membutuhkan waktu untuk diterjemahkan ke dalam pendapatan, dan valuasi sudah mencerminkan optimisme yang cukup besar.
Apa yang harus ditonton
Laju pesanan pengisian amunisi Departemen Pertahanan AS.
Seberapa cepat kemenangan kontrak diterjemahkan ke dalam pertumbuhan backlog.
Barrick melacak pergerakan emas bersejarah bersama Newmont, dengan saham naik tajam dari tahun ke saat ini. Perusahaan ini berada pada kapitalisasi pasar sekitar US$78 miliar dan melaporkan rekor proyeksi arus kas bebas karena biaya pelestarian keseluruhan tetap jauh di bawah harga spot saat ini.
Seperti Newmont, ia mengalami aksi jual satu sesi yang tajam lebih dari 8% selama peristiwa deleveraging 4 Maret yang lebih luas, sebelum pulih sebagian.
Perusahaan royalti dan streaming seperti Wheaton Precious Metals (WPM) disukai oleh beberapa investor sebagai cara yang lebih dilindungi inflasi untuk mengakses kenaikan emas, mengingat eksposur biaya operasional mereka yang lebih rendah. Namun Barrick tetap menjadi salah satu penambang emas terbesar yang terdaftar di dunia, dengan pendapatan yang sangat sensitif terhadap perubahan harga emas
Apa yang harus ditonton
Kemampuan emas bertahan di atas US $5,000/oz.
Setiap Barrick bergerak menuju akuisisi penambang junior.
Inflasi biaya energi, karena kenaikan harga bahan bakar dapat mulai menekan margin operasi penambang.