以具有竞争力的点差交易主要、次要和奇异货币对。
访问标普500指数、DAX指数和富时指数等全球指数。
通过债券差价合约和指数追踪ETF实现多元化。
交易澳大利亚证券交易所、纳斯达克等地领先股票的差价合约。
进入黄金、石油、小麦和其他关键资源的市场。
在不拥有资产的情况下交易比特币、以太坊等。
实时图表、分析工具和交易者社区。
使用高级分析和执行工具进行多资产交易。
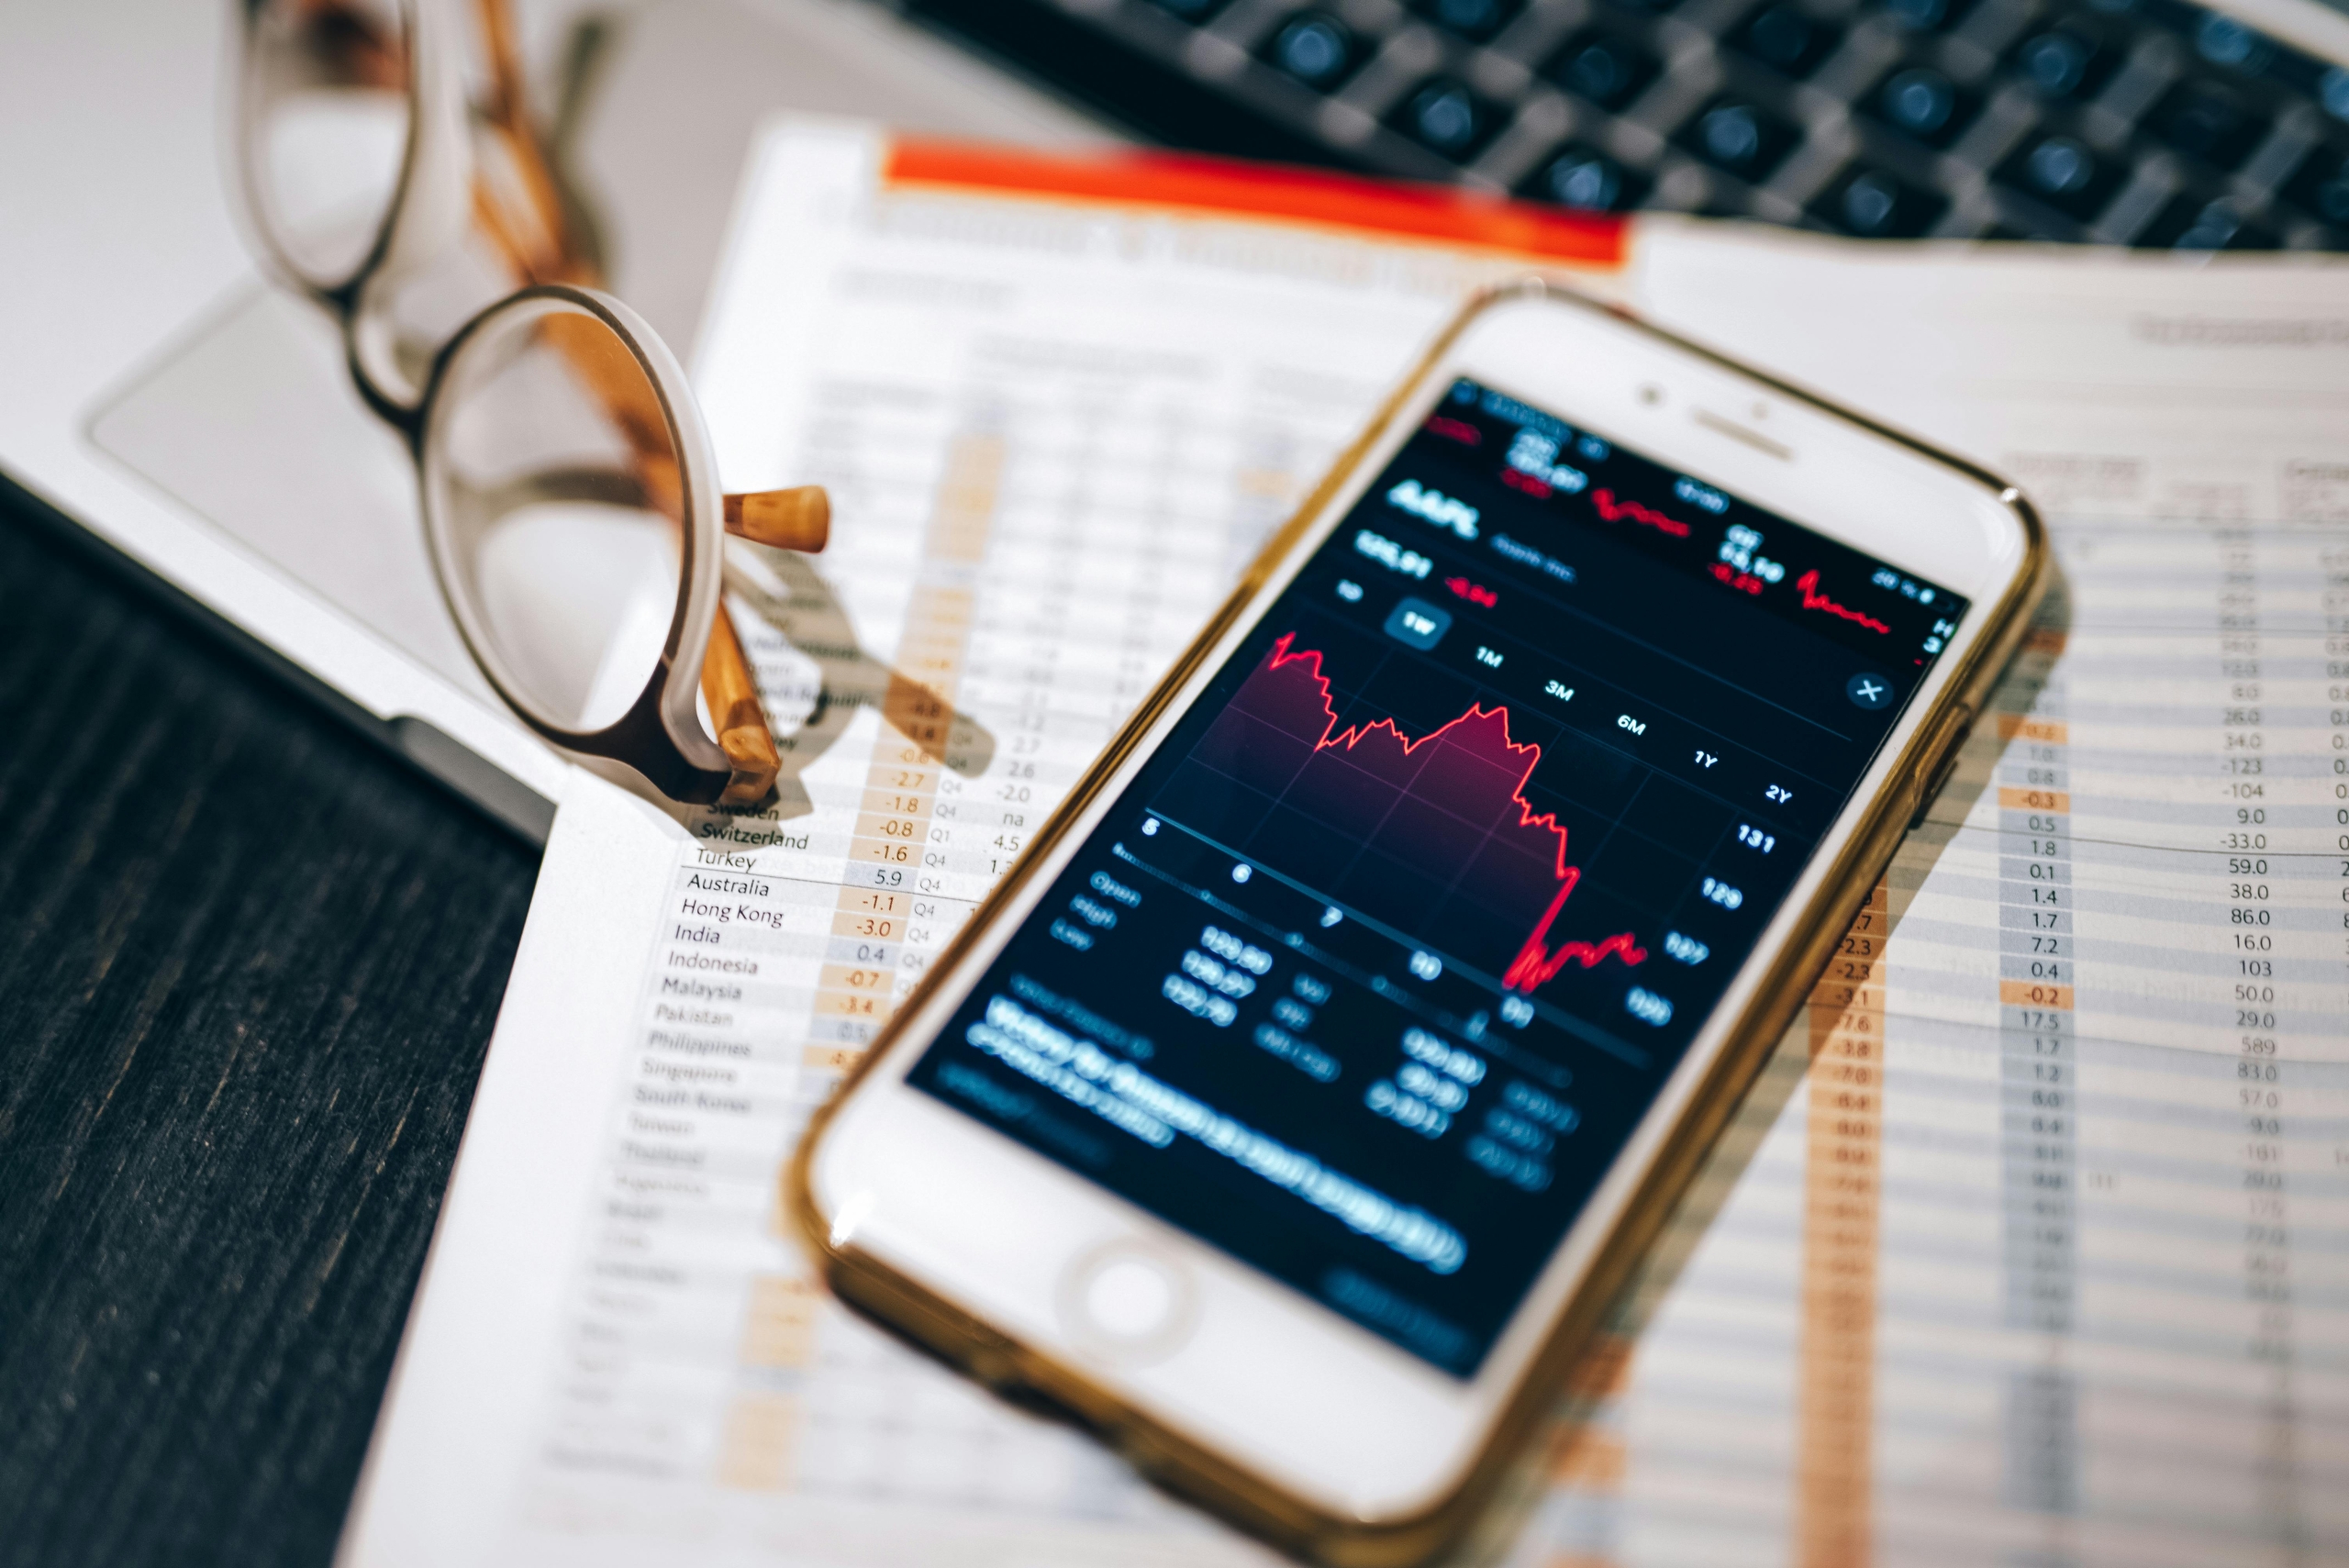
具有完整功能和实时控制的移动交易。
适用于外汇和差价合约交易者的强大、久经考验的平台。
借助直观的图表和算法功能进行精准交易。
为 MT4 与 MT5 提供机构级分析及自动化交易支持。
轻松发掘并自动复制顶尖交易员的卓越策略。
Leverage the expertise of professional traders on MT4 and MT5 by copying their trades automatically.
Leverage the expertise of seasoned Money Managers
通过安全、不间断的交易最大限度地提高性能。
充分利用我们丰富的高级交易工具,让您在市场中占据优势。
紧跟全球市场动态,获取专家解读与及时更新
一览全球主要经济事件与数据发布
探索多样化的交易策略,帮助您应对不同市场环境
如何设置您的账户并学习交易基础知识
免费学习资源按需进阶,助您系统提升交易技能
深入了解推动市场的事件
找到适合您的交易账户。
快速、安全、无忧的交易。
以有竞争力的点差和超低的费用进行交易。
只需几个简单的步骤即可开始。
为经验丰富的交易者提供更大的交易优势。