GO Markets wins in the Global Forex Awards - Retail
GO Markets
21/8/2023
•
0 min read
Share this post
Copy URL
GO Markets has won three awards in this year’s Global Forex Awards; Best Forex Fintech Broker - Global Best Forex Trading Support - Asia Most Trusted Broker - Europe The Global Forex Awards recognise forex and related businesses from around the world, “who are pushing the boundaries of innovation in retail forex trading solutions.” GO Markets COO & Director Khim Khor said, “We are very pleased to receive these 3 awards, which recognise the efforts our business is making to constantly improve our services globally. At GO Markets, we are committed to providing outstanding trading experience and customer service to all our clients globally. Being recognized as the Best Forex Fintech Broker also highlights our dedication to innovation and progression.
We hope these awards will help to solidify our market position as the most trusted global broker." Hosted by Holiston Media, the awards are now in their fifth year. With 58 categories, the awards highlight those businesses at the forefront of cutting-edge technology, low-cost trading, comprehensive market research tools, advanced educational programs and world-class customer service for direct to consumer/trader businesses. “Well done to each and every one of this year’s winners. They have proven they are at the very top of their game in the global forex retail industry.
The Global Forex Awards 2022 - Retail are a true benchmark for success that will not only impress potential new customers, but will also boost existing client comfort and loyalty, ” said Mike Boydell, Director of Holiston Media. GO Markets Global Head of Operations, Yaazdee Jaunbocus, accepted the awards at a celebration in Cyprus last week. “It’s fantastic to see GO Markets recognised on a global stage, with acknowledgement of our customer support and trustworthiness as a business; two areas in particular that we focus a lot of our attention on. It was a pleasure to attend the awards ceremony last week and accept these awards on GO Markets’ behalf,” said Yaazdee.
Learn more about the Global Forex Awards here.
By
GO Markets
Disclaimer: Articles are from GO Markets analysts and contributors and are based on their independent analysis or personal experiences. Views, opinions or trading styles expressed are their own, and should not be taken as either representative of or shared by GO Markets. Advice, if any, is of a ‘general’ nature and not based on your personal objectives, financial situation or needs. Consider how appropriate the advice, if any, is to your objectives, financial situation and needs, before acting on the advice. If the advice relates to acquiring a particular financial product, you should obtain our Disclosure Statement (DS) and other legal documents available on our website for that product before making any decisions.
March’s foreign exchange (FX) markets could be shaped by several high-impact releases clustered around the first half of the month. China PMIs, Australia GDP, Japan GDP and the Federal Reserve’s March meeting could all influence FX sentiment as the month progresses.
Quick facts
US rate expectations remain stable, with CME FedWatch implying a greater than 85% probability of no rate change at the March FOMC meeting.
China PMIs, CPI/PPI and trade data will help shape early-month regional risk tone.
Australia's GDP, RBA decision, labour force data and CPI create a concentrated domestic event window for AUD.
Japan GDP and the Bank of Japan (BoJ) policy meeting may influence domestic yield repricing and JPY volatility.
Euro area CPI, industrial production and the ECB Monetary Policy Decision remain key for EUR stability.
US dollar (USD)
Key events
Nonfarm Payrolls: 12:30 am, 7 March (AEDT)
Consumer Price Index (CPI): 11:30 pm, 11 March (AEDT)
Retail Sales: 11:30 pm, 17 March (AEDT)
Federal Reserve policy decision: 5:00 am, 19 March (AEDT)
Federal Reserve press conference: 5:30 am, 19 March (AEDT)
What to watch
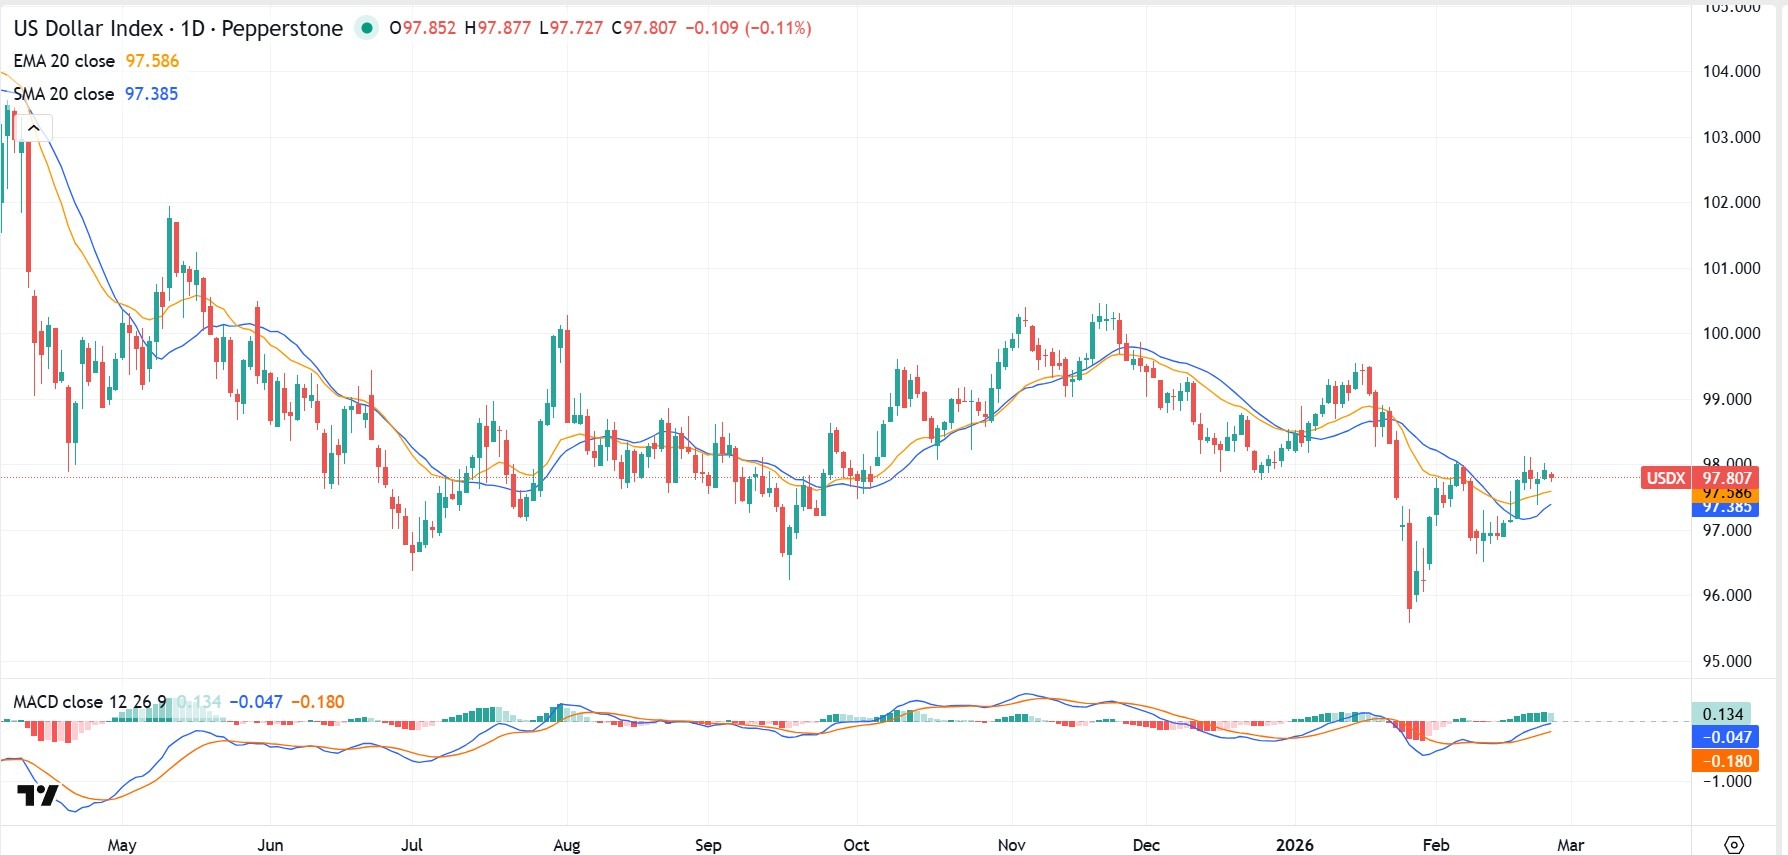
The USD remains primarily driven by inflation and labour data and their implications for Federal Reserve pricing.
CME FedWatch pricing indicates that markets are assigning a greater than 85% probability of no rate change at the March FOMC meeting. This suggests positioning is currently anchored around a pause, increasing sensitivity to any inflation surprise that could shift expectations.
With a pause largely priced in, USD direction may hinge more on inflation trajectory and longer-term policy expectations than the decision itself. Firmer CPI or resilient labour data could reinforce yield support.
Euro area CPI (flash estimate): 10:00 pm, 3 March (AEDT)
Euro area industrial production: 9:00 pm, 13 March (AEDT)
ECB Monetary Policy Decision: 12:15 am, 20 March (AEDT)
ECB press conference: 12:45 am, 20 March (AEDT)
Eurozone flash PMI: 8:00 pm, 24 March (AEDT)
What to watch
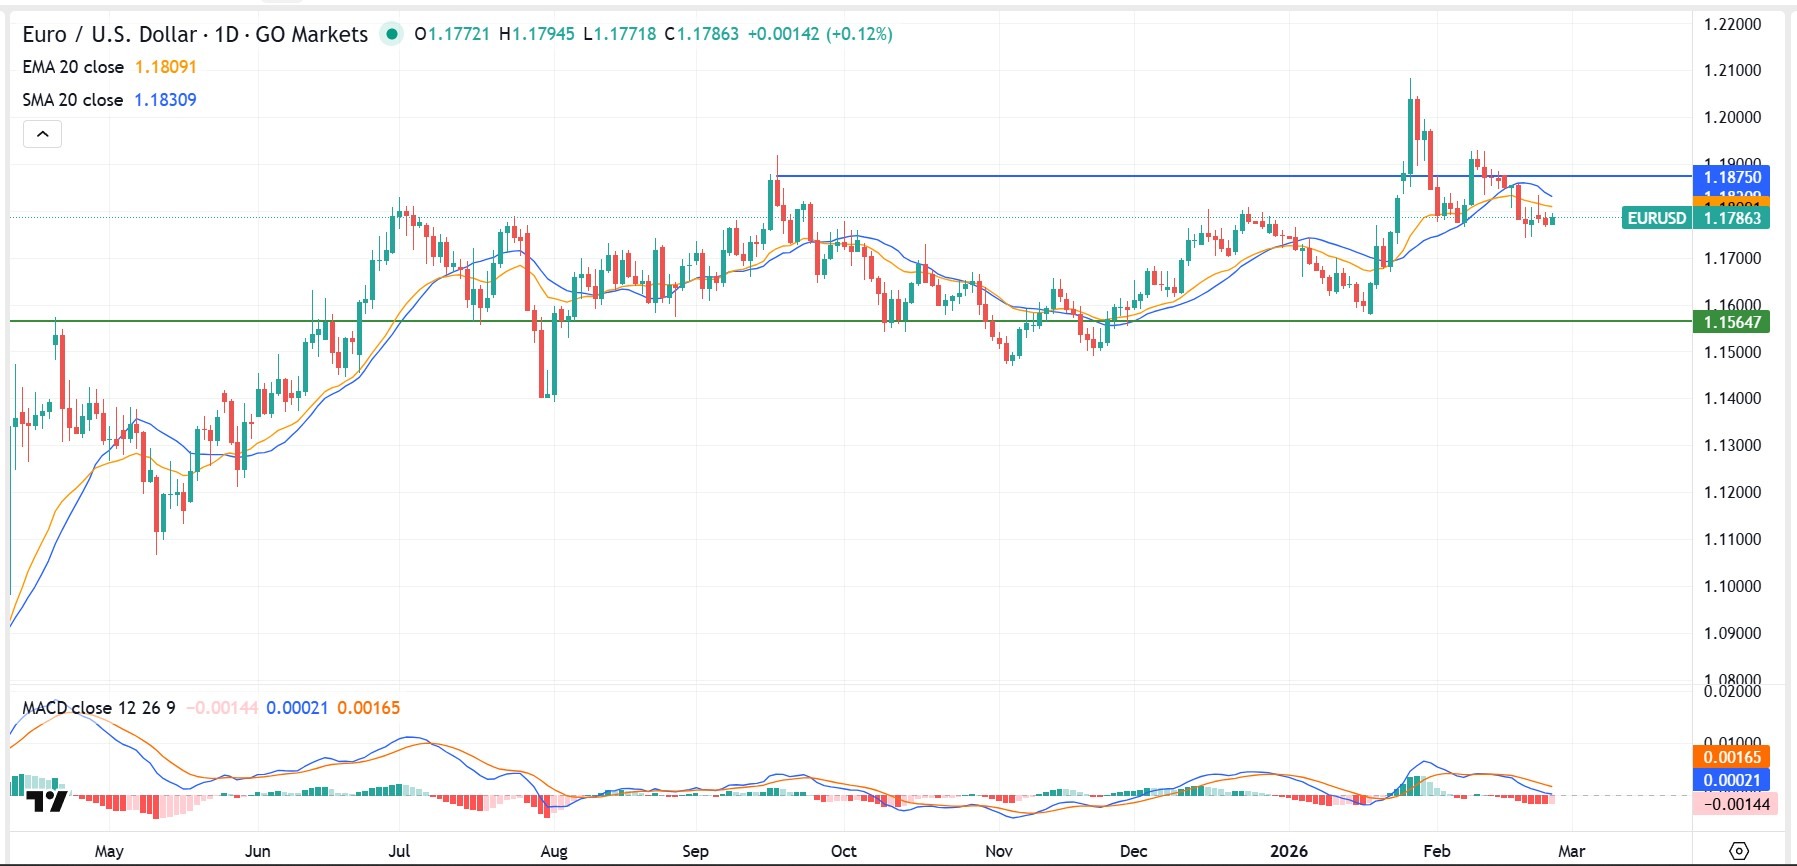
EUR direction remains linked to inflation persistence and whether growth data stabilise expectations around ECB policy.
Sticky inflation or improved activity data could limit easing expectations and support the EUR. Softer inflation and weaker production data may renew downside pressure, particularly if US data remain firm.
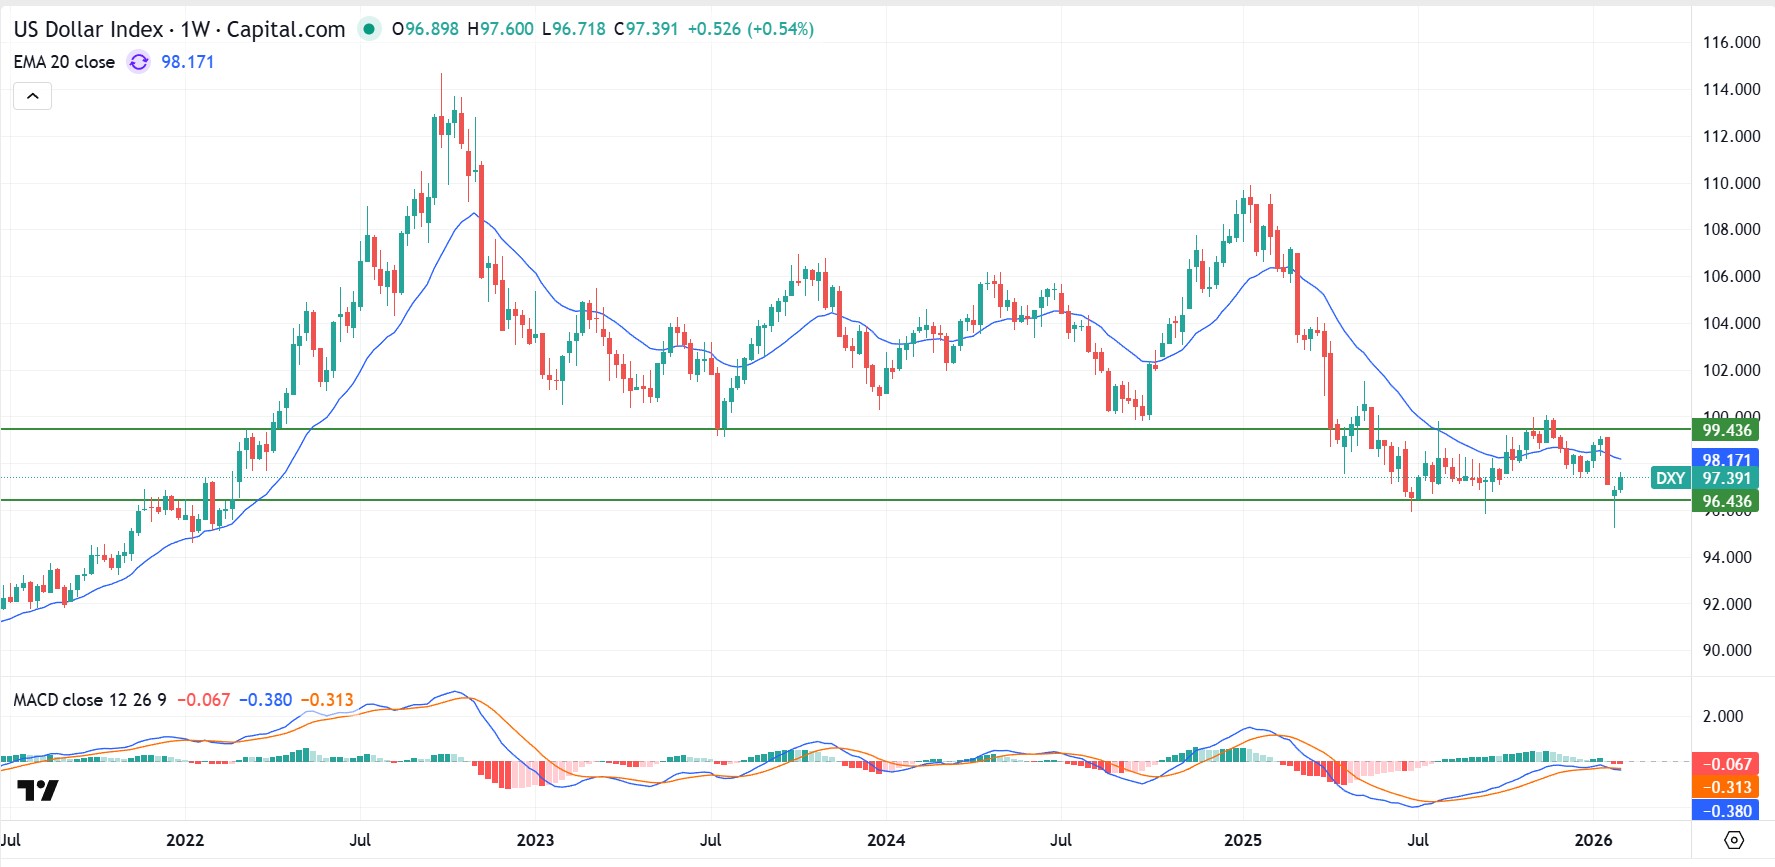
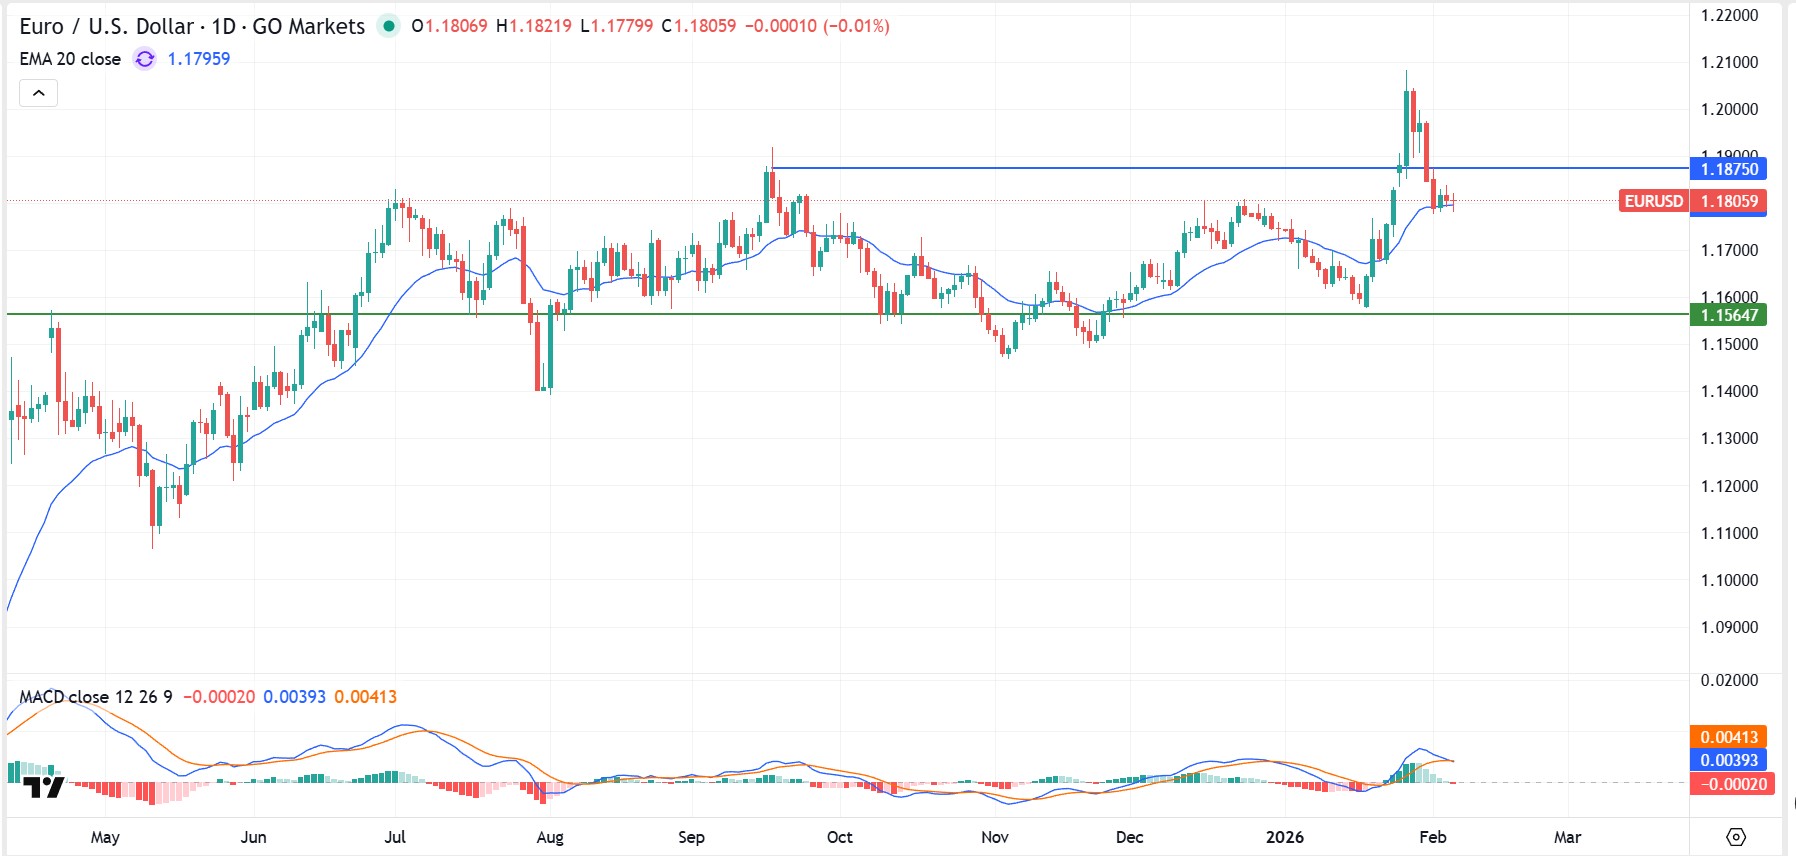
EUR/USD daily structure shows consolidation following an upside extension earlier in the year. Short-term momentum has moderated, with price holding above longer-term support levels.
Japan GDP (Q4 2025, 2nd estimate): 10:50 am, 10 March (AEDT)
Bank of Japan policy meeting: 18–19 March (AEDT)
BOJ statement on monetary policy: 19 March (AEDT)
What to watch
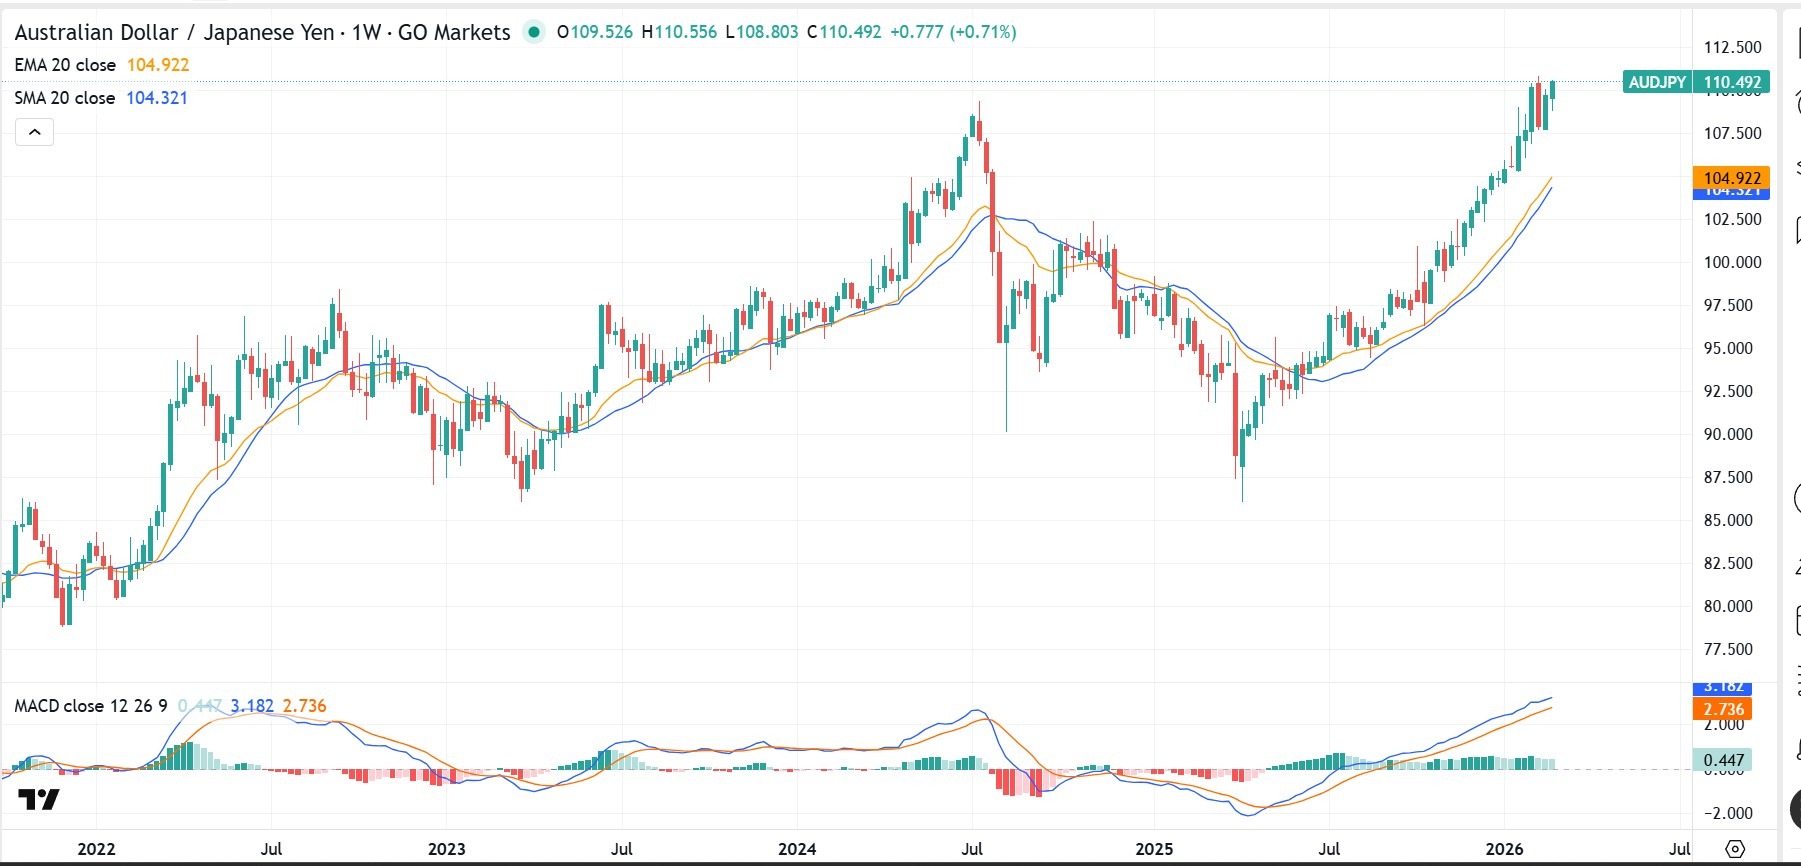
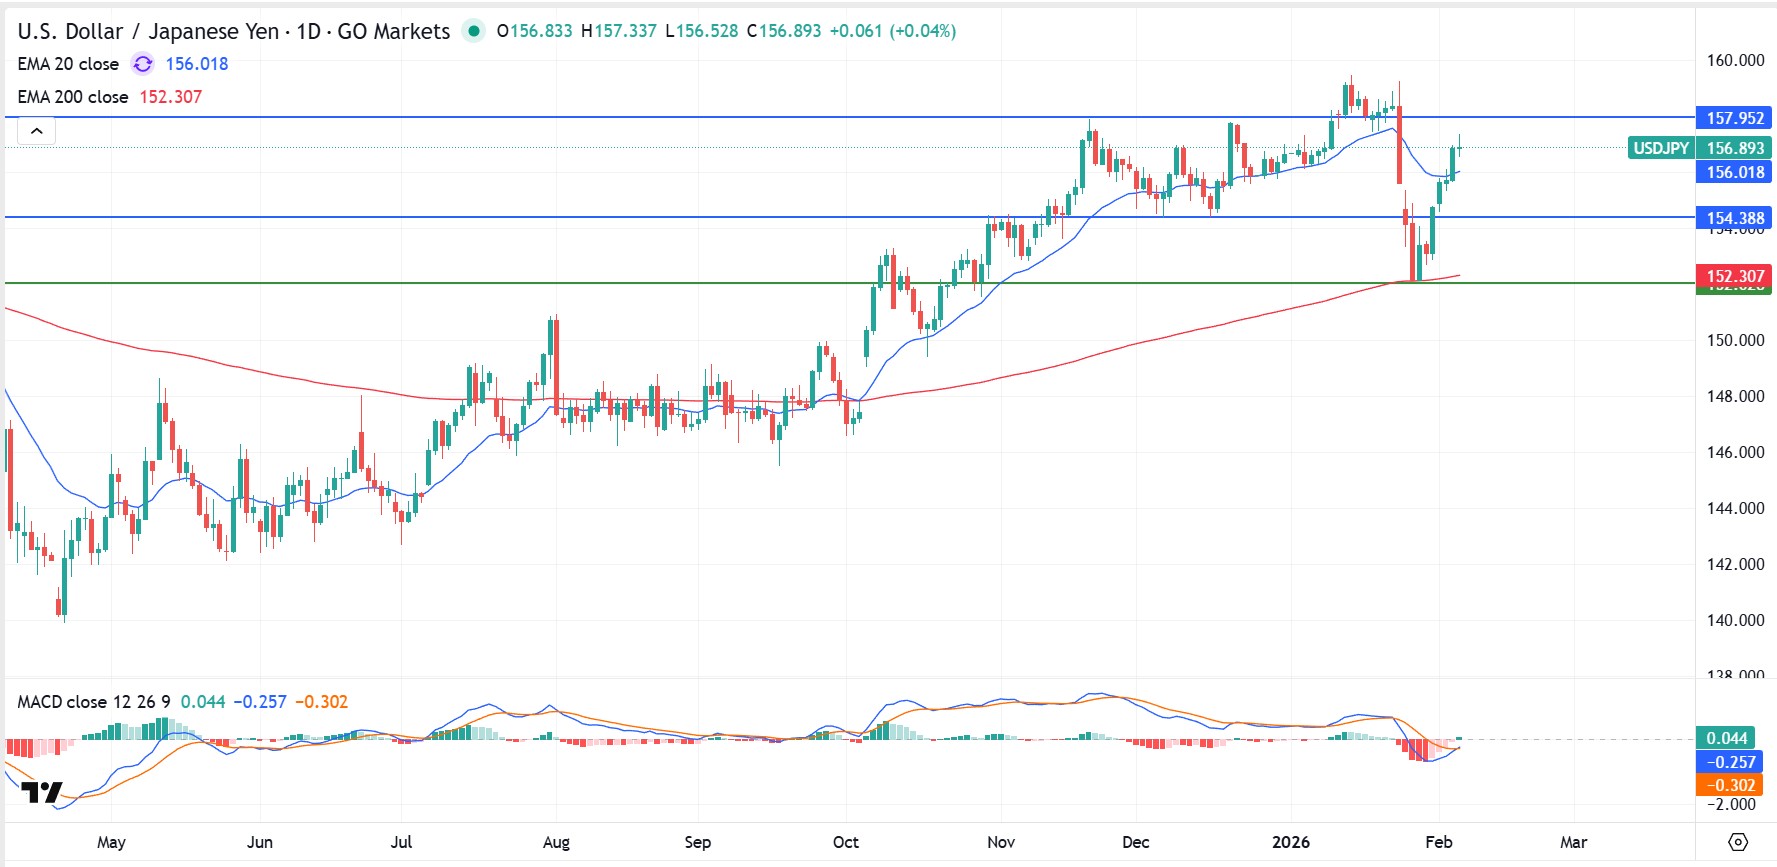
JPY remains sensitive to domestic growth data and Bank of Japan policy decisions. Yield expectations and policy normalisation signals continue to influence USD/JPY and cross-JPY volatility.
The BOJ policy meeting and subsequent communication may influence short-term volatility and longer-term rate expectations, and by extension JPY sentiment.
Stronger GDP or policy signals reinforcing normalisation could support JPY via domestic yield adjustments. More cautious messaging may maintain yield differentials in favour of USD and AUD.
RBA Monetary Policy Decision: 2:30 pm, 17 March (AEDT)
Labour Force Survey: 11:30 am, 19 March (AEDT)
Consumer Price Index (CPI): 11:30 am, 25 March (AEDT)
What to watch
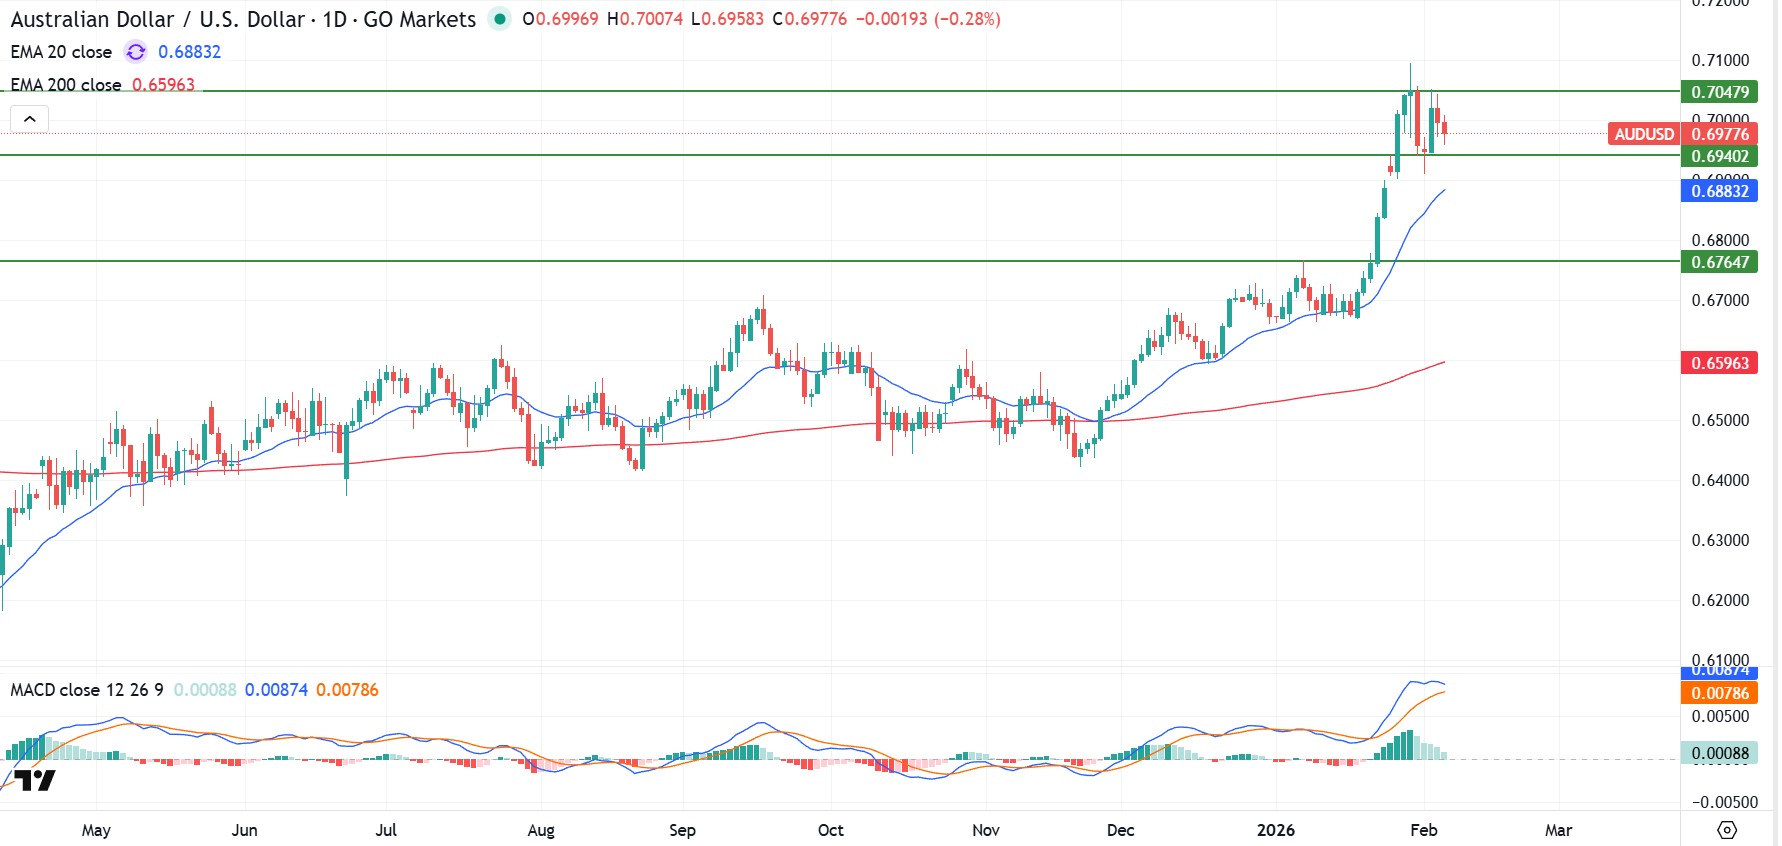
AUD faces a domestic calendar centred around the 16–17 March RBA meeting. Growth, labour and inflation releases cluster within a three-week window, increasing the potential for volatility.
Stronger GDP or persistent inflation could reinforce policy caution and support AUD. Softer labour or CPI outcomes may weigh on rate expectations and pressure AUD, particularly against USD and JPY.
Chinese data early in the month may also influence regional sentiment and commodity-linked currencies such as AUD.
The torch is lit in Milan, and public attention has moved from the opening-ceremony theatrics to the competition on the slopes.
But for forex (FX) traders, eyes are still on the euro (EUR) charts. With Italy at the centre of the sporting world, the eurozone economy is facing one of its most-watched moments of the year.
1. The home court advantage (Italy’s economy)
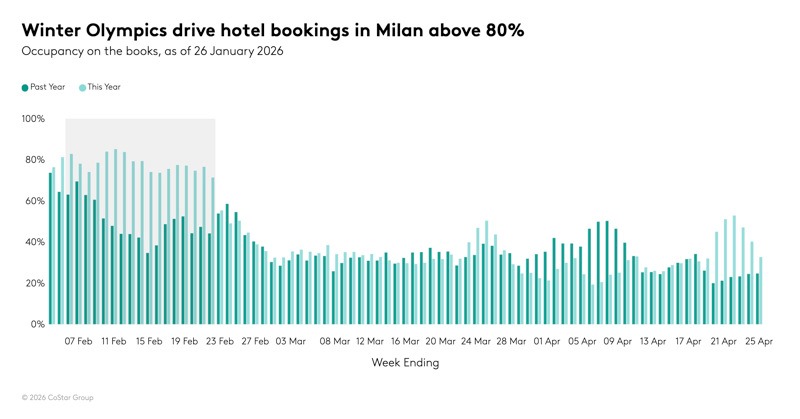
Some estimates suggest the Olympics could deliver roughly a €5.3 billion boost to the Italian economy, driven by direct spending and a longer tourism tail once the flame goes out. In practical terms, that can mean a front-loaded “direct expenditure” phase. Hospitality, retail and transport demand can peak as an estimated 2.5 million spectators move between Milan and the Dolomites.
Checklist task: Watch Italy industrial production (Wednesday, 11 February 2026). While the Games may support services activity, it’s worth tracking whether broader production data is keeping pace or if the Olympic impact is narrowly concentrated in tourism‑linked sectors.
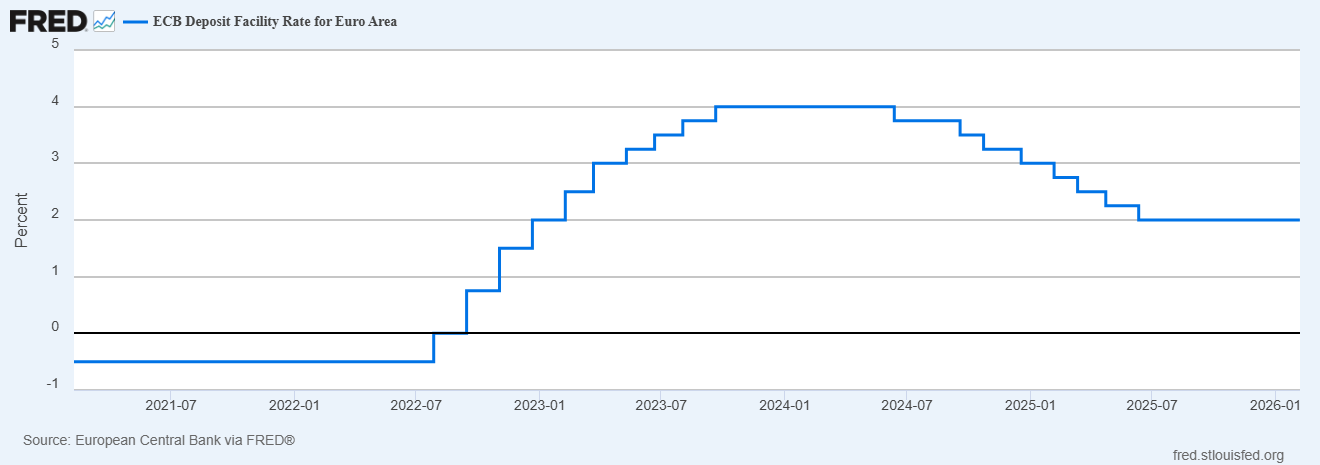
At its 5 February meeting, the European Central Bank (ECB) held policy settings steady at 2.15% and the deposit facility at 2.00%. President Christine Lagarde signalled that while inflation appears to be stabilising, the ECB remains in “wait and see” mode.
Checklist task: Monitor speeches from ECB members this week. Any shift in tone, including a more hawkish tilt that suggests rates may stay higher for longer, could act as a potential tailwind for EUR/USD, especially if it contrasts with a more cautious Federal Reserve tone.
The most prestigious Olympic finals often land in the European evening. For traders, this lines up with the London to New York session overlap (typically 14:00 to 17:00 GMT). That’s when liquidity is deepest in EUR crosses and when positioning can whipsaw around data and headlines.
Checklist task: Expect possible peak liquidity and the potential for “false breakouts” during these hours. If a major US data point (such as Tuesday’s retail sales, or Friday’s CPI) lands while European markets are still open, EUR pairs may see a volatility pickup.
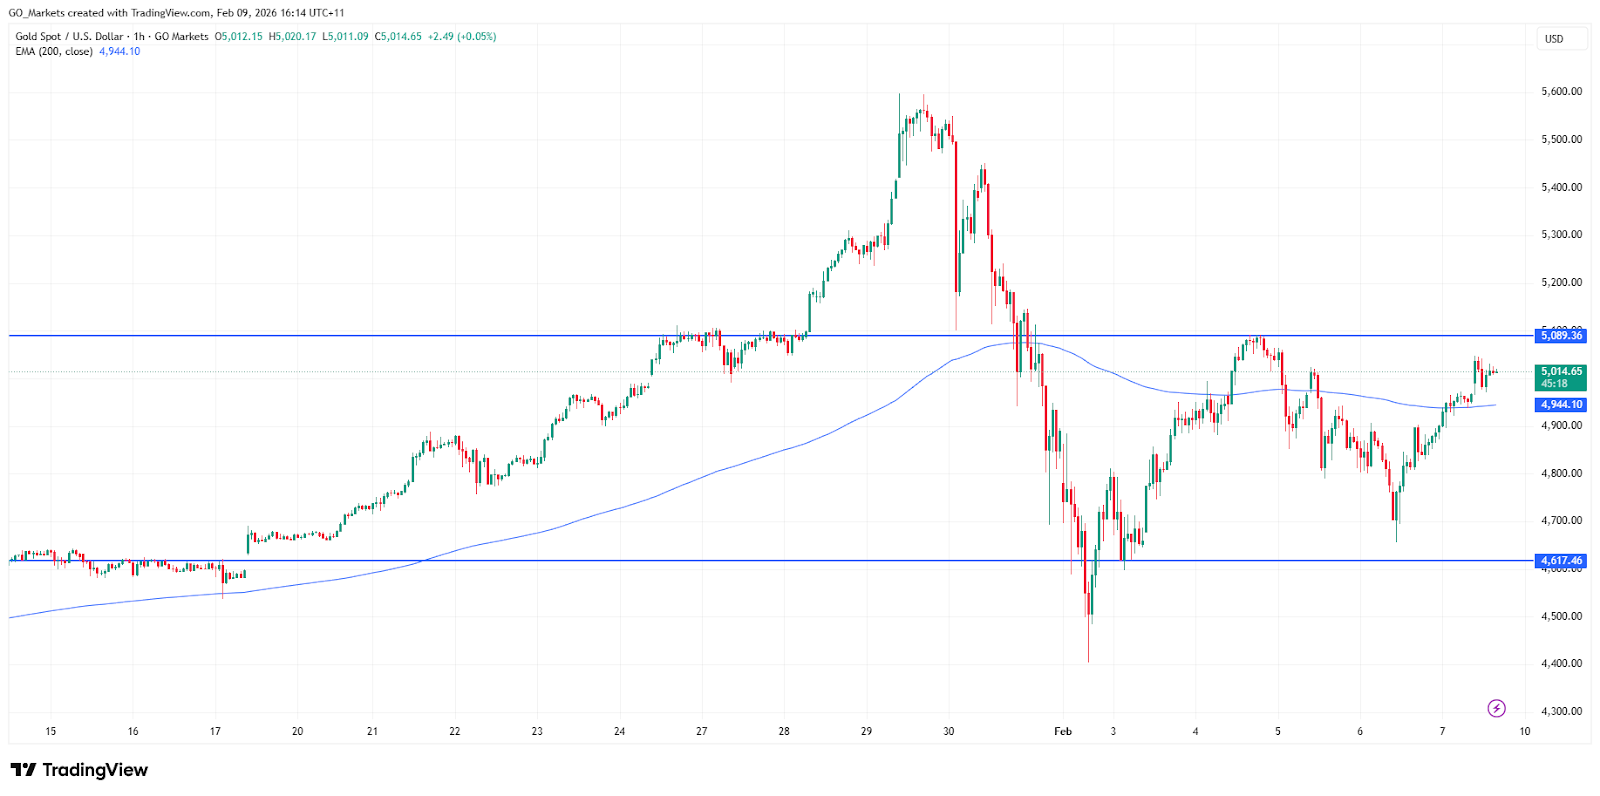
While the euro is the star of the show, the Olympics can still be shadowed by broader geopolitical noise. For example, gold is already trading around the US$5,000 mark after briefly breaking above it in early February, driven by central‑bank buying, expectations of a weaker dollar, and upgraded year‑end forecasts.
Checklist task: If sentiment turns risk-off, watch traditional haven assets such as the Swiss franc (CHF) and gold. Gold has seen large swings recently and is currently testing resistance near US$5,000. EUR/CHF may also see higher volatility if geopolitical headlines intensify during the Games.
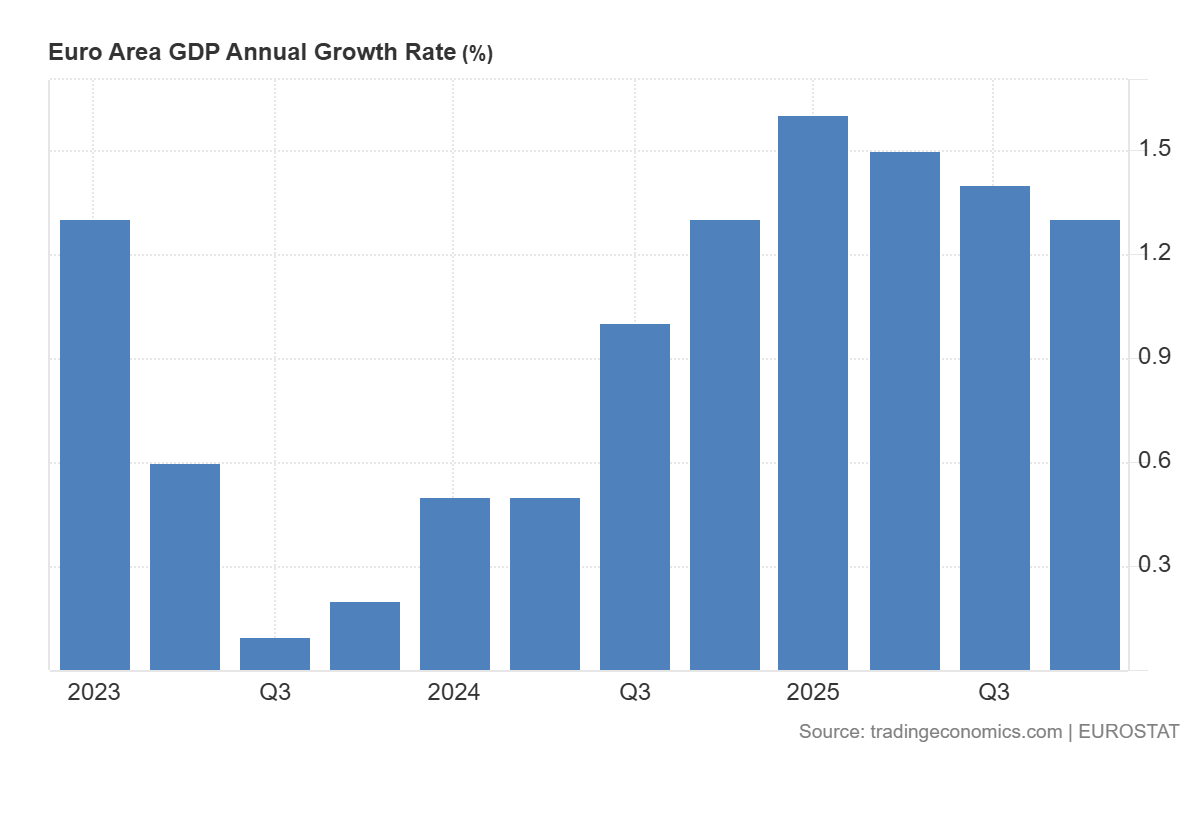
The week wraps with the eurozone’s Q4 GDP (second estimate) on Friday, 13 February 2026.
Checklist task: The preliminary estimate showed 0.3% growth. If the figure is revised upward, it may reinforce the eurozone’s resilience and could support a late-week bid in EUR.
While the “Olympic boost” may offer a sentiment cushion for Italy, the euro’s direction is still likely to be shaped by whether the ECB’s “wait and see” stance is challenged by Friday’s GDP update or Wednesday’s industrial production release.
With gold hovering near US$5,000 and the US facing a calendar affected by rescheduled data, volatility could stay elevated into key overlap hours, right as prime-time events are taking place.
February’s FX landscape is likely to be driven by inflation persistence, labour resilience, and central bank communications. With several high-impact data releases across the US, Europe, Japan and Australia, near-term moves may be more event-driven and repricing-led, rather than trend-led.
Quick facts
USD remains the key reference point, with US data driving repricing in yields and the broader FX market.
EUR sensitivity remains high around European Central Bank (ECB) messaging and incoming inflation and activity signals.
JPY remains tightly linked to domestic data and Bank of Japan (BOJ) communication, with USD/JPY often reacting sharply to shifts in yield expectations.
AUD remains policy sensitive, with domestic inflation and labour data likely to matter most, alongside global risk tone and metals.
US dollar (USD)
Key events
Nonfarm payrolls (NFP) and unemployment: 8:30 am, 11 February (ET) | 12:30 am, 12 February (AEDT)
Consumer Price Index (CPI), headline and core: 8:30 am, 13 February (ET) | 12:30, 13 February (AEDT)
Personal income and outlays (includes the PCE price index): 8:30, 20 February (ET) | 12:30, 21 February (AEDT)
What to watch
The USD is likely to remain primarily driven by shifts in inflation and labour data and their implications for Federal Reserve rate expectations. Recent headlines surrounding Federal Reserve independence have also added volatility to USD positioning.
Stronger inflation or labour resilience is often associated with firmer USD support via higher yield expectations. Softer outcomes could reduce rate support and allow pairs like EUR/USD and AUD/USD to stabilise.
ECB flash estimates for GDP and employment: 8:00 pm, 13 February (AEDT)
What to watch
EUR direction remains linked to whether the ECB can maintain its stance without a material deterioration in activity, or whether inflation and growth data pull forward easing expectations.
Resilient growth and firm inflation could support the “higher for longer” pricing bias. Weaker growth or softer inflation could weigh on the currency, particularly if they bring forward easing expectations.
Japan preliminary GDP (Q4 2025, first preliminary): 6:50 pm, 15 February (ET) | 10:50 am, 16 February (AEDT)
National CPI (Japan): 20 February (Japan)
What to watch
JPY remains sensitive to domestic yield shifts and BOJ communication. Even modest adjustments to policy expectations could generate outsized moves in USD/JPY.
Firm growth or inflation outcomes could support JPY via higher domestic yields and shifting BOJ expectations. Softer outcomes or cautious policy messaging could keep USD/JPY supported.
Consumer Price Index (CPI): 11:30 am, 25 February (AEDT)
What to watch
AUD remains sensitive to policy, responding quickly to domestic inflation and labour data, as well as global risk sentiment and its impact on metal pricing.
Persistent wages or inflation pressures could support AUD via firmer policy expectations. Softening data could reduce rate support and weigh on AUD performance, particularly versus USD and JPY.
ASX defence stocks are back on more watchlists and according to the Stockholm International Peace Research Institute (SIPRI), global military spending reached approximately US$2.718 trillion in 2024, up 9.4% in real terms.
Australia’s current defence settings are set out in the 2024 National Defence Strategy and related investment planning documents, which outline long-term capability funding priorities. Furthermore, Canberra has pointed to A$330 billion of capability investment through 2034, including added funding for surface combatants, preparedness, long-range strike and autonomous systems.
Here is the part most people miss: not all ASX defence stocks are the same trade. Some sit close to naval shipbuilding. Some are counter-drone names and some are smaller, higher-risk operators where one contract may matter much more than the market assumes.
These five names are not a buy list, rather they are a practical watchlist for investors trying to understand where procurement momentum may actually show up on the ASX.
1) Austal (ASX: ASB)
Austal is one of the ASX-listed companies most directly exposed to Australia’s naval shipbuilding pipeline, although contract execution, margins and delivery timing remain important variables.
They aren't just winning random contracts; they have signed a massive legal agreement (the Strategic Shipbuilding Agreement) that makes them the official partner for building Australia's next generation of mid-sized military ships in Western Australia.
In February 2026, the government gave Austal the green light on a $4 billion project. This isn't for just one ship, it’s for 8 "Landing Craft Heavy" vessels. These are huge transport ships (about 100 metres long) designed to carry heavy tanks and equipment directly onto a beach. But here is the part most people miss, shipbuilding is a marathon, not a sprint.
As you can see in the delivery timeline, while construction starts in 2026, the final ship won't be delivered until 2038. For an investor, this means Austal has a "guaranteed" stream of income for the next 12 years, but they have to be very good at managing their costs over that long period to actually make a profit.
2) DroneShield (ASX: DRO)
If you have seen footage of small drones disrupting modern battlefields, DroneShield is building part of the "off switch". Its focus is counter-drone technology, including systems that detect, disrupt or defeat drones using electronic warfare, sensors and software-led tools, rather than relying only on traditional munitions.
By early 2026, DroneShield had moved beyond the label of a promising start-up and into a much larger commercial phase. It reported FY2025 revenue of A$216.5 million, up 276% from FY2024, and said it started FY2026 with A$103.5 million in committed revenue.
One point the market may overlook is the software layer in the model. DroneShield reported A$11.6 million in Software as a Service (SaaS) revenue in FY2025 and said it is working towards SaaS making up 30% of revenue within five years. Its subscription model includes software updates for deployed systems, which adds a growing stream of recurring revenue alongside hardware sales.
Among ASX defence stocks, DroneShield is one of the most direct ways to follow the counter-UAS theme. It is also one of the names where sentiment can swing quickly, because growth stories can rerate both up and down when order timing changes.
EOS builds both the "brain" and the "muscle" for military platforms. It is best known for remote weapon systems, which allow operators to control armed turrets from inside protected vehicles, and for high-energy laser systems aimed at counter-drone defence. EOS has said its unconditional backlog reached about A$459.1 million in early 2026, following a series of contract wins through 2025. That points to a much larger base of secured work, although delivery timing and revenue conversion still matter.
EOS signed a €71.4 million, about A$125 million, contract with a European customer for a 100-kilowatt high-energy laser weapon system. EOS says the system is designed for a low cost per shot and can engage up to 20 drones a minute. The Australian Government has set aside A$1.3 billion over 10 years for counter-drone capability acquisition, and EOS has disclosed that it was part of a successful LAND 156 bid team. That does not guarantee future revenue, but it does support medium-term visibility in a market the company is already targeting.
EOS reads as a rebound story, but one that still depends on execution. The company has reoriented around remote weapon systems, counter-drone systems and lasers, all areas tied to stronger defence spending. The key question is whether it can keep converting backlog and pipeline into delivered revenue while maintaining balance-sheet discipline.
4) Codan (ASX: CDA)
Codan is sometimes left out of casual defence stock lists because it is more diversified. That may be an oversight. In its H1 FY26 results, Codan said its Communications business designs mission-critical communications for global military and public safety markets. Communications revenue rose 19% to A$221.8 million. The company also said DTC delivered strong growth from defence and unmanned systems demand, with unmanned systems revenue up 68% to A$73 million. Codan said about half of that unmanned revenue was linked to operational defence applications in conflict zones.
This is where the story becomes more nuanced. In a basket of ASX defence stocks, Codan may offer a different profile, with less pure headline sensitivity, broader operating diversification and meaningful exposure to military communications and unmanned systems without being a single-theme name. That diversification may also mean the stock does not always trade like a pure-play defence name.
HighCom sits at the speculative end of this list, and it should be labelled that way. The company says its two continuing businesses are HighCom Armor, which supplies ballistic protection, and HighCom Technology, which supplies and maintains small and medium uncrewed aerial systems, counter-uncrewed aerial systems, and related engineering, integration, maintenance and logistics support for the ADF and other aligned regional militaries.
In H1 FY26, revenue from continuing operations fell 59% to A$10.9 million, while EBITDA moved to a A$5.4 million loss from a A$1.9 million profit a year earlier. HighCom also disclosed A$5.1 million in HighCom Technology revenue, including A$3.5 million from small uncrewed aerial systems (SUAS) spare parts and A$1.6 million from sustainment services provided to the Australian Department of Defence.
So yes, HighCom is one of the more financially sensitive ASX defence stocks on the board. But it is also the kind of smaller name that can show how procurement filters down into support, sustainment and specialist protection gear.
Key market observations
Track program milestones, not just political headlines. Contract awards, manufacturing starts, delivery schedules and sustainment work often matter more than a single announcement day.
Separate pure-play exposure from diversified exposure. DroneShield and EOS are closer to concentrated defence technology themes, while Codan brings communications exposure within a broader business mix.
Watch sovereign capability themes in Australia. Austal and EOS are tied to local manufacturing, integration and Australian supply chains, which supports the broader sovereign capability theme in this group.
Pay attention to balance sheets and cash conversion. Procurement momentum can be real even when timing gets messy. HighCom's latest half is a reminder of that.
Defence headlines can look immediate. Earnings usually are not. Austal's major naval work stretches into the next decade. EOS contracts are delivered over multiple years. DroneShield's order flow appears strong, but the company still separates committed revenue from broader pipeline opportunity. HighCom shows the other side of the coin. Exposure to procurement does not automatically translate into smooth financial execution.
References to ASX-listed defence stocks are general information only, not a recommendation to buy, sell or hold any security or CFD. These stocks can be highly volatile and are sensitive to contract timing, government policy, geopolitics, execution risk and market conditions. Backlog, pipeline and revenue expectations are not guarantees of future performance.
Three central banks are deciding rates simultaneously, Brent crude is swinging wildly around US$100 a barrel, and a war in the Middle East is rewriting the inflation outlook in real time. Whatever happens this week could set the tone for markets for the rest of 2026.
Quick facts
The Reserve Bank of Australia (RBA) announces its next cash rate decision on Tuesday, with markets now pricing a 66% chance of a second hike to 4.1%.
Some analysts have warned the Iran war could push US inflation to 3.5% by year-end and delay Fed rate cuts until September, making this week's FOMC dot plot the most closely watched in years.
Brent crude is flirting with US$100 a barrel after Iran launched what state media described as its "most intense operation since the beginning of the war."
RBA: Will Australia hike again?
The RBA raised the cash rate for the first time in two years to 3.85% at its February meeting after inflation picked up materially in the second half of 2025.
The question now is whether it moves again before even seeing the next quarterly CPI print, which isn't due until 29 April.
Deputy Governor Andrew Hauser acknowledged ahead of the meeting that policymakers face a genuinely divided decision, shaped by conflicting economic signals at home and growing instability abroad.
Financial markets currently assign around a 66% probability to another hike, with a May increase considered virtually certain regardless of what happens Monday.
The FOMC meets on March 17–18, with the policy statement scheduled for 2:00 pm ET on March 18 and Chair Jerome Powell's press conference at 2:30 pm. CME FedWatch shows a 99% probability that the Fed holds rates at 3.50% to 3.75%.
The real action is in the Summary of Economic Projections (SEP) and dot plot. The current median dot shows one 25-basis-point cut for 2026. If it shifts to two cuts, that is dovish and bullish for risk assets. If it shifts to zero cuts or adds a rate hike into the projection, markets could react in the other direction.
Further complicating matters, Powell's term as Federal Reserve Chair expires on May 23, 2026. Kevin Warsh is the leading candidate to replace him, viewed as more hawkish on monetary policy. Any comment from Powell on this transition could move markets independently of the rate decision itself.
Bank of Japan: Further tightening could be brought forward
The BOJ meets on March 18–19, with the decision expected Thursday morning Tokyo time. The current policy rate sits at 0.75% (a 30-year high), and the January 2026 meeting produced a hold in an 8-1 vote.
Governor Ueda has categorised the March meeting as "live," noting the timeline for further tightening could be "brought forward" if Shunto spring wage negotiations yield stronger-than-expected results.
Those results are due to begin flowing in during the week, making them the critical input for the BOJ's decision. Nomura expects 2026 Shunto wage hikes to come in around 5.0%, including seniority, with base pay growth of approximately 3.4%. If results confirm that trajectory, the case for a March hike strengthens considerably.
The complication is the global backdrop. Japan imports roughly 90% of its energy needs, and oil around US$100 per barrel is pushing up import costs and threatening to add inflationary pressure. A BOJ hike into a global oil shock would be an unusually bold move.
Most market participants still lean toward a hold at this meeting, with April or July seen as the more likely timing for the next move.
Brent crude briefly touched US$119.50 per barrel earlier in the week before dropping 17% to below US$80, then rebounding toward US$95 on mixed signals from Washington about the Strait of Hormuz.
As of Thursday, Brent was back over US$100 as Iran launched fresh attacks on commercial shipping and the IEA reserve release failed to bring meaningful relief.
In the scenario where a longer conflict inflicts damage to energy infrastructure, analysts estimate CPI could rise to 3.5% by the end of 2026, with gasoline prices approaching US$5 per gallon in the second quarter.
For this week, oil acts as a macro meta-variable. Every geopolitical headline, ceasefire signal, tanker attack, reserve release, and Trump comment could move equities, bonds and currencies in real time.
US-Israeli strikes on Iran launched on 28 February sent Brent crude surging past US$119 a barrel, gold above US$5,200, and defence stocks to all-time highs.
Against that backdrop, investors are focusing on a small group of commodity-linked names that may remain sensitive to further moves in oil, LNG and gold. The key question is whether the shock proves sustained, or whether a ceasefire, shipping normalisation, or policy action removes part of the geopolitical risk premium.
1. ExxonMobil (NYSE: XOM)
ExxonMobil has been one of the clearest beneficiaries of the price surge. Shares hit a record high of US$159.60 in early March and are up approximately 28% year-to-date.
The company produces 4.7 million barrels of oil equivalent per day, has a Permian Basin breakeven of around US$35/barrel, and is committed to US$20 billion in buybacks for 2026.
Wells Fargo raised its price target to US$183 from US$156 following the escalation, while broader analyst consensus sits around US$140–$144. However, XOM is already trading above many consensus targets, and disruption to its LNG partner QatarEnergy poses a near-term operational headwind.
Chevron touched a new 52-week high of US$196.76 in early March and has risen approximately 24% year-to-date.
The company's Brent breakeven for dividends and capital expenditure sits around US$50/barrel. This means that at current Oil prices above US$90, it is generating significant free cash flow.
However, Chevron has temporarily halted operations at a gas field off Israel's coast following missile activity in the region, and the stock has since pulled back more than 1% as the conflict directly affects its operations.
What to watch
Direct operational updates from Chevron's Middle East and Israeli assets.
Any further halts that could weigh on near-term production.
With Qatar having halted output after Iranian drone strikes, buyers across Asia and Europe are scrambling for alternative supply. Woodside, as one of Australia's largest LNG producers and exporters, sits outside the conflict zone and is well-positioned to benefit from rerouted demand.
Analysts caution that actual substitution takes time due to shipping and contract constraints, meaning the price uplift may be more durable than a simple spot trade. European TTF benchmark gas prices surged over 50% in a week, amplifying the margin environment for non-Middle Eastern LNG producers.
What to watch
The pace and timeline of any Qatar LNG production restart.
If QatarEnergy remains offline for weeks, Woodside could begin re-contracting European buyers at elevated spot prices.
An Australian dollar move higher could be a headwind worth tracking for USD-denominated earnings.
4. Cheniere Energy (NYSE: LNG)
Alongside Woodside, Cheniere is the most direct US beneficiary of the Qatar LNG disruption. As the largest LNG exporter in the United States, it saw intraday strength at the start of the conflict week.
US domestic energy production has buffered American consumers from the worst of the shock, but the export premium has widened as European and Asian buyers pay up for non-Gulf supply.
The trade is "geopolitically sensitive," and any resolution could reverse upside quickly. But for as long as Hormuz and Gulf gas infrastructure remain compromised, Cheniere is positioned to benefit structurally.
What to watch
Any diplomatic breakthrough that reopens Gulf shipping lanes.
Announcements of new long-term offtake contracts signed at current elevated prices.
Gold surged 5.2% in a single session on 1 March, touching US$5,246/oz, as markets sought safe-haven assets. Newmont, the world's largest gold producer, has seen its reserves effectively revalued at these prices.
It is up alongside gold's 24% year-to-date gain, and its all-in sustaining costs remain largely fixed.
However, Gold miners sold off sharply on 4 March, and Newmont fell nearly 8% in a single session as broader risk-off deleveraging hit precious metals equities.
The stock has recovered since, but volatility remains high. For longer-duration investors, analysts note that "safe" mining jurisdictions such as Canada, Australia, and Nevada are commanding fresh premiums as Middle East instability raises the value of geopolitically secure supply.
What to watch
Whether gold can hold above US$5,000/oz.
A prolonged conflict could accelerate an M&A cycle in junior gold miners.
A ceasefire or broad equity deleveraging event as the primary risk to monitor.
Lockheed Martin reached a new all-time high of US$676.70 on 3 March, up over 4% for the day. Its F-35 fighters, precision-guided munitions, THAAD systems, and HIMARS rocket artillery are central to the ongoing air campaign.
The US Department of Defence is moving to replenish munitions stockpiles, and Trump's stated ambition to raise the US defence budget to US$1.5 trillion by 2027 adds a longer-term structural tailwind beyond the immediate conflict.
Defence stocks are rising amid classic geopolitical risk pricing, but investors should note that actual contract flow takes time to translate into earnings, and valuations already reflect considerable optimism.
What to watch
The pace of US Department of Defence munitions replenishment orders.
How quickly contract wins translate into backlog growth.
Barrick is tracking gold's historic run alongside Newmont, with the stock up sharply year-to-date. It sits at a roughly US$78 billion market capitalisation and is reporting record free cash flow projections as its all-in sustaining costs remain well below current spot prices.
Like Newmont, it experienced a sharp single-session selloff of more than 8% during the broader 4 March deleveraging event, before partially recovering.
Royalty and streaming companies such as Wheaton Precious Metals (WPM) are being favoured by some investors as a more inflation-protected way to access gold upside, given their lower operational cost exposure. But Barrick remains one of the world’s largest listed gold miners, with earnings that are highly sensitive to changes in the gold price
What to watch
Gold's ability to hold above US$5,000/oz.
Any Barrick moves toward junior miner acquisitions.
Energy cost inflation, as rising fuel prices could begin to squeeze miner operating margins.