Euro Week checklist: What should FX traders watch during the Milan Olympics?
GO Markets
10/2/2026
•
0 min read
Share this post
Copy URL
The torch is lit in Milan, and public attention has moved from the opening-ceremony theatrics to the competition on the slopes.
But for forex (FX) traders, eyes are still on the euro (EUR) charts. With Italy at the centre of the sporting world, the eurozone economy is facing one of its most-watched moments of the year.
1. The home court advantage (Italy’s economy)
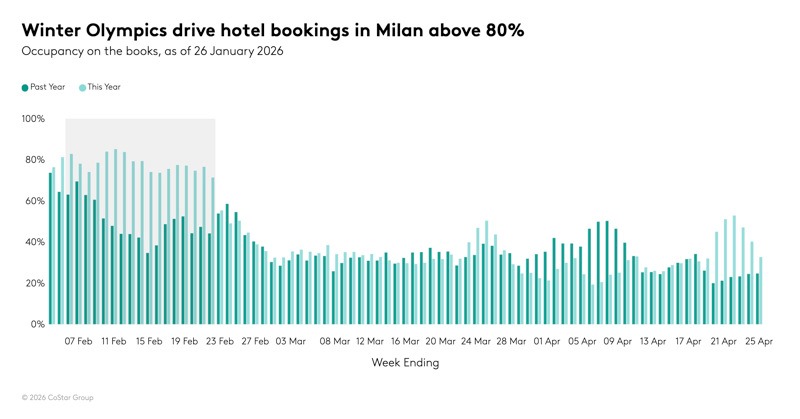
Some estimates suggest the Olympics could deliver roughly a €5.3 billion boost to the Italian economy, driven by direct spending and a longer tourism tail once the flame goes out. In practical terms, that can mean a front-loaded “direct expenditure” phase. Hospitality, retail and transport demand can peak as an estimated 2.5 million spectators move between Milan and the Dolomites.
Checklist task: Watch Italy industrial production (Wednesday, 11 February 2026). While the Games may support services activity, it’s worth tracking whether broader production data is keeping pace or if the Olympic impact is narrowly concentrated in tourism‑linked sectors.
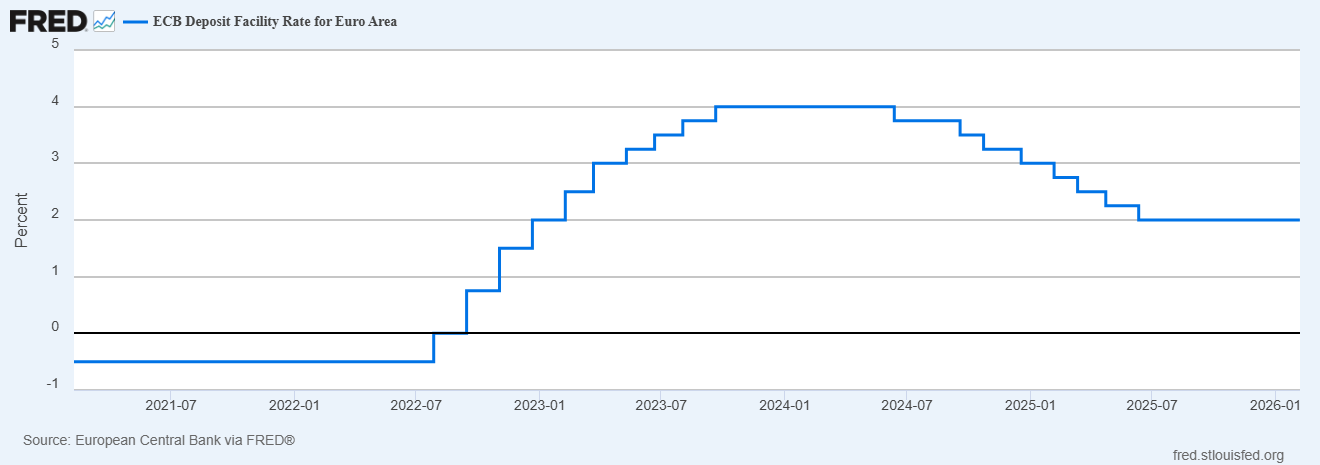
At its 5 February meeting, the European Central Bank (ECB) held policy settings steady at 2.15% and the deposit facility at 2.00%. President Christine Lagarde signalled that while inflation appears to be stabilising, the ECB remains in “wait and see” mode.
Checklist task: Monitor speeches from ECB members this week. Any shift in tone, including a more hawkish tilt that suggests rates may stay higher for longer, could act as a potential tailwind for EUR/USD, especially if it contrasts with a more cautious Federal Reserve tone.
The most prestigious Olympic finals often land in the European evening. For traders, this lines up with the London to New York session overlap (typically 14:00 to 17:00 GMT). That’s when liquidity is deepest in EUR crosses and when positioning can whipsaw around data and headlines.
Checklist task: Expect possible peak liquidity and the potential for “false breakouts” during these hours. If a major US data point (such as Tuesday’s retail sales, or Friday’s CPI) lands while European markets are still open, EUR pairs may see a volatility pickup.
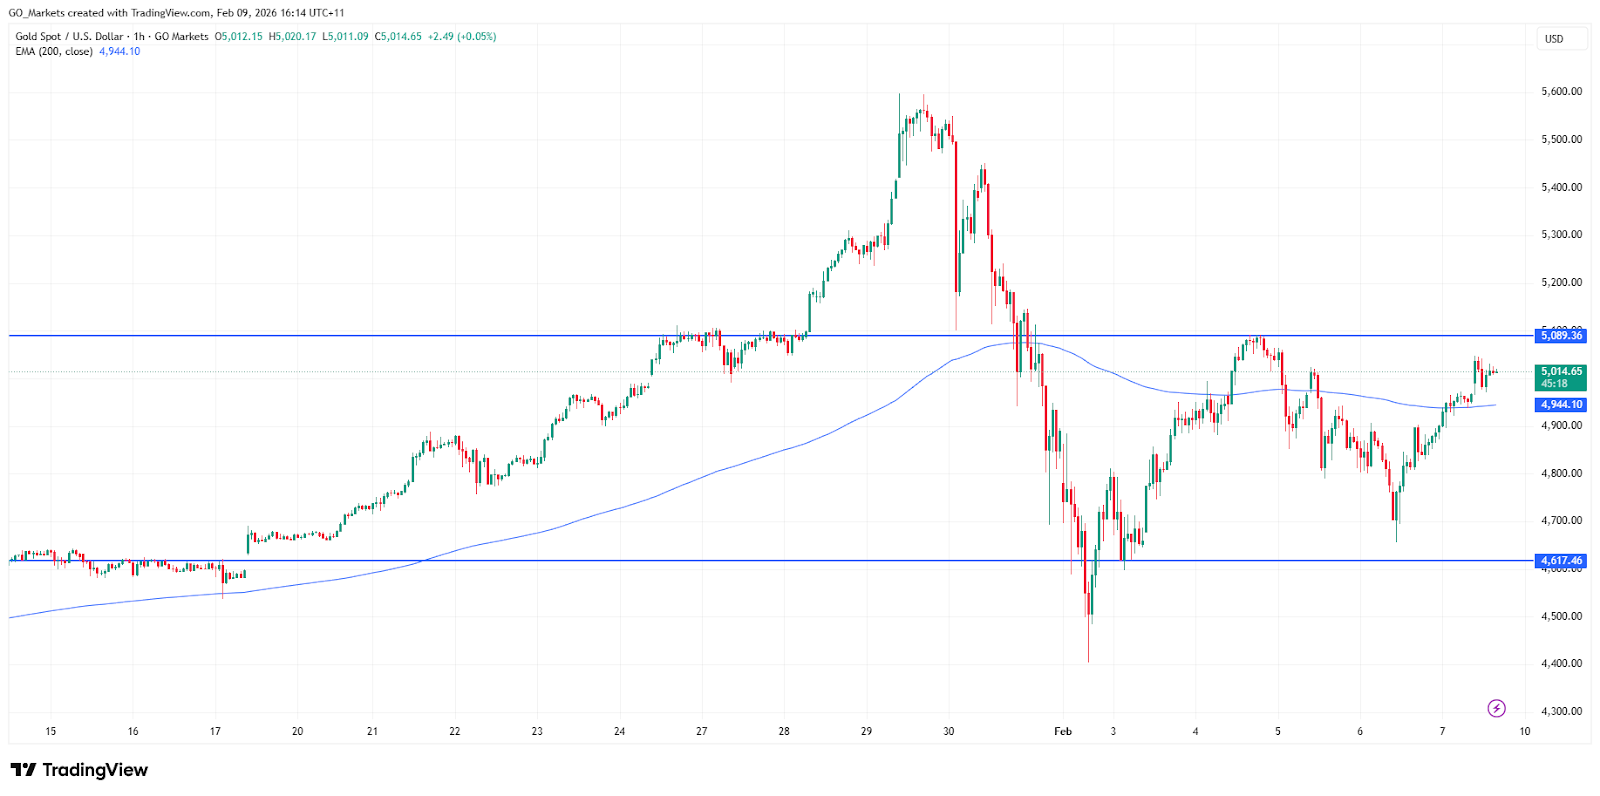
While the euro is the star of the show, the Olympics can still be shadowed by broader geopolitical noise. For example, gold is already trading around the US$5,000 mark after briefly breaking above it in early February, driven by central‑bank buying, expectations of a weaker dollar, and upgraded year‑end forecasts.
Checklist task: If sentiment turns risk-off, watch traditional haven assets such as the Swiss franc (CHF) and gold. Gold has seen large swings recently and is currently testing resistance near US$5,000. EUR/CHF may also see higher volatility if geopolitical headlines intensify during the Games.
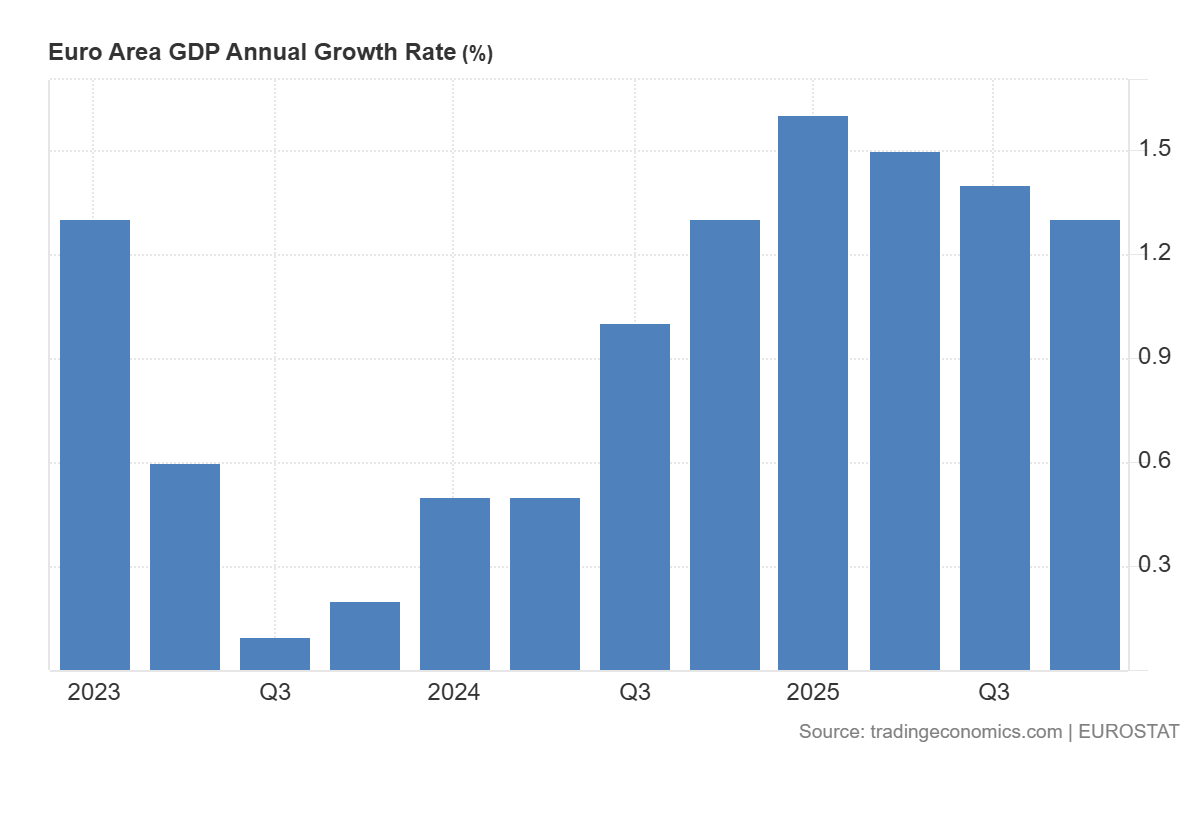
The week wraps with the eurozone’s Q4 GDP (second estimate) on Friday, 13 February 2026.
Checklist task: The preliminary estimate showed 0.3% growth. If the figure is revised upward, it may reinforce the eurozone’s resilience and could support a late-week bid in EUR.
While the “Olympic boost” may offer a sentiment cushion for Italy, the euro’s direction is still likely to be shaped by whether the ECB’s “wait and see” stance is challenged by Friday’s GDP update or Wednesday’s industrial production release.
With gold hovering near US$5,000 and the US facing a calendar affected by rescheduled data, volatility could stay elevated into key overlap hours, right as prime-time events are taking place.
By
GO Markets
The information provided is of general nature only and does not take into account your personal objectives, financial situations or needs. Before acting on any information provided, you should consider whether the information is suitable for you and your personal circumstances and if necessary, seek appropriate professional advice. All opinions, conclusions, forecasts or recommendations are reasonably held at the time of compilation but are subject to change without notice. Past performance is not an indication of future performance. Go Markets Pty Ltd, ABN 85 081 864 039, AFSL 254963 is a CFD issuer, and trading carries significant risks and is not suitable for everyone. You do not own or have any interest in the rights to the underlying assets. You should consider the appropriateness by reviewing our TMD, FSG, PDS and other CFD legal documents to ensure you understand the risks before you invest in CFDs. These documents are available here.
One day the ASX is drifting quietly... and the next, margin requirements rise, stops do not fill where expected, and portfolios open with uncomfortable overnight gaps.
If you have been searching for answers, you are not alone. Some of the most searched questions about volatility among Australian traders relate to margin calls, slippage, overnight gaps, leveraged exchange traded funds (ETFs), and tools such as average true range (ATR).
Here is what is happening.
Why this matters now
Global markets have become more sensitive to interest rates, inflation data, geopolitics and technology-driven flows. When liquidity thins and uncertainty rises, price swings widen. That is volatility.
And volatility doesn’t just affect price direction, it changes how trades are executed, how much capital is required, and how risk behaves beneath the surface.
Translation: Volatility is not just about bigger moves, rather, it’s about faster moves and thinner liquidity - that’s when the mechanics of trading matter most.
One of the most searched questions about volatility is why margin requirements increase without warning.
When markets become unstable, brokers may increase margin requirements on contracts for difference (CFDs) and other leveraged products. Larger price swings can increase the risk of accounts moving into negative equity thus raising margin requirements reduces available leverage and can help manage exposure during extreme conditions.
What this can mean in practice
-A margin call may occur even if price has not moved significantly. -Effective leverage can drop quickly. -Positions may need to be reduced at short notice.
Margin adjustments are typically a response to changing market risk, not a random decision. In highly volatile markets, it is prudent to assume margin settings can change quickly, therefore many traders choose to review position sizes and available buffers in light of that risk.
What is slippage and why didn’t my stop fill at my price?
Another frequently searched topic is slippage.
Slippage can occur when a stop order triggers and is executed at the next available price, the outcome can depend on the order type, market liquidity and gaps. In calm markets, the difference may be small whereas in fast markets, prices can gap beyond the stop level.
Illustration of price gap through stop-loss level | GO Markets
Stop-loss orders generally prioritise execution rather than price certainty and during periods of high volatility, this distinction becomes important. Adjusting position size and placing stops with reference to typical price movement may be more effective than simply tightening stops in unstable conditions.
How do I manage overnight gapping on the ASX?
Australia trades while the United States sleeps, and vice versa. This time zone difference is, sadly, one reason overnight gap risk is frequently searched by Australian traders. If US markets fall sharply, the ASX may open lower the following morning, with no opportunity to exit between the close and the open.
Examples of risk-management approaches market traders may use include
-Index hedging using ASX 200 futures or CFDs*. -Partial hedging during high risk events. -Reducing exposure ahead of major macro announcements.
Hedging can offset part of a move, but it introduces basis risk as individual stocks may not move in line with the broader index.
There is no perfect protection, only trade-offs between cost, complexity and risk reduction.
*CFDs are complex instruments and come with a high risk of losing money due to leverage.
What are the key risks of leveraged or inverse ETFs in volatile markets?
Leveraged and inverse ETFs are often searched during periods of heightened volatility.
While these products typically reset daily, they aim to deliver a multiple of the index’s daily return, not its long-term return. In a volatile, sideways market, daily compounding can erode value even if the index finishes near its starting level.
This occurs because gains and losses compound asymmetrically. A fall of 10 percent requires a gain of more than 10 percent to recover. When that effect is multiplied daily, outcomes can diverge materially from the underlying index over time.
Such instruments may be used tactically by some market participants. They are generally not designed as long-term hedging tools and understanding their structure is essential before using them in a strategy.
How can ATR be used to inform stop placement?
Average true range (ATR) is a commonly used indicator for measuring volatility.
ATR estimates how much an asset typically moves over a given period, including gaps. Rather than setting a stop at an arbitrary percentage, some traders reference ATR and place stops at a multiple, such as two or three times ATR, to reflect prevailing conditions.
When volatility rises, ATR expands and that can imply wider stops or smaller position sizes if overall risk is to remain constant. The shift is from asking, “How far am I willing to lose?” to asking, “What is a normal move in current conditions?"
Practical considerations in volatile markets
During periods of elevated volatility, traders may consider
Allowing for the possibility of margin changes
Sizing positions conservatively if volatility increases
Recognising that stop-loss orders do not guarantee a specific exit price
Reviewing exposure ahead of major economic events
Understanding the daily reset mechanics of leveraged ETFs
Using volatility measures such as ATR to inform stop placement
Maintaining adequate cash buffers
Volatility does not reward prediction alone. Preparation and risk awareness may assist traders in understanding potential risks, but outcomes remain unpredictable.
Australian markets face specific structural considerations cpmapred to Asian and US Markets. Overnight gap risk is influenced by US trading hours and resource heavy indices such as the ASX can respond quickly to commodity price movements and data from China. Currency exposure, including AUD and US dollar (USD) moves, can add another layer of variability.
Volatility is not uniform across regions. It behaves differently depending on market structure and liquidity depth.
Frequently asked questions about volatility
What causes sudden spikes in market volatility? Interest rate decisions, inflation data, geopolitical developments, earnings surprises and liquidity constraints are common triggers.
Why do brokers increase margin during volatile markets? To reduce leverage exposure and manage risk when price swings widen.
Can stop-loss orders fail during volatility? They can experience slippage if markets gap beyond the stop level, meaning execution may occur at a worse price than expected. In fast or illiquid markets, this difference can be significant.
Are leveraged ETFs suitable for long term hedging? They are generally structured for short-term exposure due to daily resets. Whether they are appropriate depends on your objectives, financial situation and risk tolerance.
How can volatility be measured before placing a trade? Tools such as ATR, implied volatility indicators and historical range analysis can help quantify prevailing conditions.
Risk warning: Periods of heightened volatility can lead to rapid price movements, margin changes and execution at prices different from those expected. Risk-management tools such as stop-loss orders and volatility indicators may assist in assessing market conditions but cannot eliminate the risk of loss, particularly when using leveraged products.
Markets enter this week facing a dense US data run alongside an early-month APAC growth check. With US equities still relatively elevated and gold holding above US$5,000 as of February 27, near-term price action may be particularly sensitive to any data-driven shift in rates, USD direction, and risk sentiment.
US data cluster: ISM Manufacturing, ISM Services and ADP, non-farm payrolls (NFP), and retail sales are all expected this week.
APAC growth pulse: China official PMI and Japan PMI, Australia GDP, and China Caixin PMI provide a regional activity read.
Equities: Despite a pause at the end of the week, major US indices remain relatively elevated overall, potentially increasing sensitivity to negative surprises.
Gold: Has moved back above US$5,000, keeping real yields and risk sentiment in focus.
Geopolitics: Middle East geopolitics remain a background volatility risk.
United States: growth and payrolls
The US week is shaped by a tight sequence of activity, employment and consumer signals that can quickly shift near-term rate expectations.
Markets typically take their first cue from manufacturing sentiment, then look to services and private payrolls for a broader read on demand and hiring momentum.
The focal point is the labour report, with retail sales adding a consumer cross-check in the same window.
This combination could be relevant for Treasury yields, USD pricing and equity sentiment, especially with indices still sitting at relatively elevated levels.
Key dates
US ISM Manufacturing PMI: 2:00 am, 3 March (AEDT)
US ISM Services PMI: 2:00 am, 5 March (AEDT)
US ADP employment: 12:15 am, 5 March (AEDT)
US Employment Situation (NFP): 12:30 am, 7 March (AEDT)
US Advance Monthly Retail Sales (Retail Trade): 12:30 am, 7 March (AEDT)
Monitor
Treasury yield reactions to ISM and payroll surprises.
USD sensitivity to rate repricing.
Equity index performance, particularly within large-cap technology.
Changes in trade policy, with tariff uncertainty potentially influential.
The early-month APAC calendar provides a fast read on whether regional activity is stabilising or softening.
China’s PMIs (official and Caixin) offer complementary perspectives across state-linked and private-sector firms, while Japan’s PMI can feed directly into JPY sentiment through growth expectations.
Australia’s GDP adds a broader macro check that can influence local yield pricing and AUD direction. Taken together, this cluster sets the tone for regional risk appetite and could spill over into commodities and base metals.
Key dates
Japan PMI: 11:30 am, 2 March (AEDT)
Australia GDP: 11:30 am, 4 March (AEDT)
China official PMI: 12:30 pm, 4 March (AEDT)
China Caixin PMI: 12:45 pm, 4 March (AEDT)
Monitor
AUD and local yield sensitivity around GDP.
JPY response to PMI data.
Regional equity and commodity reactions to Chinese activity trends.
Gold and cross-asset sensitivity
With gold holding above the US$5,000 level, it could be highly reactive to shifts in real yields, USD direction and broader risk appetite.
Macro surprises that move front-end rates can quickly translate into gold volatility, while geopolitical developments that influence oil and inflation expectations could also amplify moves.
In practice, gold may act as a real-time barometer of how markets are digesting growth, inflation and policy uncertainty through the week.
Welcome to 2026. Inflation is still sticky, real yields still matter, and markets can reprice fast when policy, geopolitics, and risk sentiment shift.
With the next RBA decision approaching, the ASX can feel less like a local story and more like a window into the broader macro regime.
The next rate decision is about balancing inflation control, growth risks, and how the Australian dollar (AUD) responds to yield differentials and risk sentiment.
Lenders can act as real-time signals for household and small and medium enterprise (SME) credit conditions as funding costs and competition shift.
Names like MQG and GMG can be highly sensitive to global liquidity, risk appetite, and changes in discount rates. That can amplify moves when conditions change.
1. Commonwealth Bank (ASX: CBA)
CBA is often viewed as a bellwether for domestic mortgage and funding conditions. It can react to funding costs and any early hints of arrears pressure, rather than just the “rates up/rates down” trigger.
Traders track the yield curve and bank funding spreads as it’s often the first tell when the story flips from net interest margin (NIM) to credit (bad debts).
In a higher-for-longer setup, banks may rally first on “better margins” until the market starts pricing credit risk instead.
In the past, CBA hit record highs in early 2026, up roughly 11% year to date (YTD), before a mid-February pullback amid broader market volatility.
What traders watch
Broker handling: Every broker call listed is on the bearish side: 4 Sells, 1 Underperform, and 1 Underweight.
Targets and implied move: Target prices range from A$120 to A$140. Using the “% to reach target” column, that implies a last close of about A$178.68, which equates to roughly 22% to 33% downside versus the targets shown (targets are estimates, often set on a 12-month basis, and are not guarantees).
Broker tone: Citi stays Sell (“in-line quarter/limited revisions”), while Morgan Stanley argues the hurdle is higher after the stock’s outperformance, as “good” may no longer be good enough.
Source: FNArena / Data correct as of Thursday, 26 February 2026.
Risks: 2:30 pm (AEDT) event gaps, sharp reversals, and quick sell-offs when too many traders are on the same side.
2. National Australia Bank (ASX: NAB)
NAB is where you look when you’re trying to figure out whether the engine room of the economy is purring or quietly overheating.
When policy stays tight, lenders can look fine right up until they don’t. Margins can defend, deposit competition can bite, and the comfort line, “defaults are contained”, gets stress-tested by reality.
NAB tends to trade more like an invoice: what businesses are paying, what they are delaying, and how fast conditions change when confidence turns.
What traders watch
NAB is up about +15.46% YTD, with the stock recently around A$49. In the latest print, traders are watching how NAB’s A$2.02 billion Q1 cash profit shows resilience even as expense inflation starts to creep in.
Targets and implied move: Targets run from A$35.00 to A$50.50, and the implied last price is about A$49.10, so most targets sit below the market, with UBS as the modest upside call.
Broker tone: UBS is the lone Buy with a A$50.50 target (about +2.85%). Macquarie is Outperform, but its A$47.00 target is still below the implied last. Citi, Morgans and Ord Minnett stay Sell, with targets clustered A$35.00 to A$39.25. Morgan Stanley sits Equal-weight at A$43.50.
Source: FNArena / Data correct as of Thursday, 26 February 2026.
Risks: margin squeeze from deposit competition, a turn in business credit quality, and fast repricing if “contained defaults” stops being credible.
3. Macquarie Group (ASX: MQG)
Macquarie is what you get when you blend markets, asset management, deal-making, and a global appetite for volatility... and then you hand it a very expensive suit.
Macquarie doesn’t just listen to the RBA; it listens to the entire room. Global rates, risk appetite, and market plumbing often matter as much as anything said in Martin Place.
What traders watch
While Macquarie is about +1.93% since Jan 1, traders are watching global yields, volatility regime shifts, plus any read-through to deal flow and trading conditions.
Broker handling: The table shows a mostly supportive mix, with no outright sells.
Targets and implied move: The implied last price is about A$207.12. The average target across the brokers shown is about A$229.70 (around +10.9%), with targets ranging A$210.00 to A$255.00.
Broker tone: Ord Minnett and UBS sit at Buy, Citi is Neutral, Morgans is Hold, and Morgan Stanley is Equal-weight. Supportive, but not unanimous.
Source: FNArena / Data correct as of Thursday, 26 February 2026.
Risks: liquidity shocks, volatility “air pockets,” and a fast downgrade cycle if global conditions sour.
4. QBE Insurance Group (ASX: QBE)
Insurers can look unusually “clean” in higher-rate regimes because their float finally earns something again. When yields rise, investment income can start doing real work and can offset a lot… until the world reminds everyone why insurance exists in the first place.
QBE is a tug-of-war between higher rates helping the portfolio and catastrophe risk plus claims inflation trying to take it back with interest.
What traders watch
QBE is about +10.06% since Jan 1, and in the latest print, traders are watching investment yield trends, catastrophe loss headlines, and any sign that the pricing cycle is cooling.
Broker handling: The broker calls shown lean positive: Outperform (Macquarie), Buy (Citi, UBS), Overweight (Morgan Stanley), plus two upgrades to Buy from Hold (Ord Minnett, Bell Potter).
Targets and implied move: The table implies a last price around A$21.89. Targets range from A$21.80 to A$26.00. The average target across the brokers shown is about A$24.06 (around +9.9%).
Broker tone: Ord Minnett has the highest target at A$26.00 (about +18.78%). Bell Potter is also shown as an upgrade to Buy, but with a target fractionally below the implied last (-0.41%).
Source: FNArena / Data correct as of Thursday, 26 February 2026.
Risks: major catastrophe events, claims inflation and the market pricing “peak rates” too early.
5. Goodman Group (ASX: GMG)
Goodman Group is where the rate story meets the valuation story. When yields rise, long-duration equities get repriced as the discount rate stops being theoretical.
GMG can still execute operationally, but the stock often trades like a referendum on the cost of capital, cap rates, and whether the market thinks the future is getting cheaper or more expensive.
What traders watch
GMG is about +2.86% YTD with traders watching 10-year yields, cap rate chatter, funding conditions, and data-centre narrative momentum.
Broker handling: The broker calls shown skew positive, with no sells. 3 Buys (Bell Potter, Citi, UBS), plus Accumulate (Morgans), Outperform (Macquarie), Overweight (Morgan Stanley), and 1 Hold (Ord Minnett).
Targets and implied move: Targets range from A$31.25 to A$41.50. The implied last close is about A$28.42, and the simple average target in the table is about A$36.35 (around +27.9% above the implied last close).
Broker tone: Morgan Stanley is the most bullish on target price at A$41.50 (+46.02%). Citi is also constructive at Buy with A$40.00 (+40.75%). Ord Minnett is the cautious outlier at Hold with A$31.25 (+9.96%).
Source: FNArena / Data correct as of Thursday, 26 February 2026.
Risks: valuation compression if yields rise, refinancing narratives, and cap rate repricing.
6. JB Hi-Fi (ASX: JBH)
JB Hi-Fi tends to move with the mood of the household budget. When the consumer is steady, and promotions stay manageable, the story can look simple.
When spending tightens and discounting ramps up, the market quickly shifts to margin risk and guidance risk.
What traders watch
As JB Hi-Fi is about -12.64% since Jan 1, traders are keenly watching sales momentum vs consumer confidence, promo intensity, and margin resilience.
Broker handling: The mix is constructive overall, but not unanimous. The table shows 2 Buys (Citi, Bell Potter) plus 1 Upgrade to Buy from Neutral (UBS), 1 Outperform (Macquarie), 1 Upgrade to Hold from Trim (Morgans), and two more cautious calls, Underweight (Morgan Stanley) and Lighten (Ord Minnett).
Targets and implied move: Targets range from A$72.90 to A$119, with the implied last close about A$84.06. The simple average target in the table is about A$96.56 (around +14.9% above the implied last close).
Broker tone: Bell Potter is the most bullish on target price at A$119.00 (+41.57%). Macquarie is also positive at Outperform with A$106.00 (+26.10%). On the cautious side, Morgan Stanley is Underweight with A$72.90 (-13.28%). The latest change notes in the table show UBS upgraded to Buy from Neutral and Morgans upgraded to Hold from Trim (both dated 17/02/2026).
Source: FNArena / Data correct as of Thursday, 26 February 2026.
Risks: unemployment surprises, margin damage from discounting, and fast sentiment reversals around consumer data.
7. Judo Capital (ASX: JDO)
Judo Capital is the cleanest expression of “small and medium enterprise (SME) credit plus funding competition” you can put on a screen.
It is a focused lender, a floating-rate loan book, and growth that looks heroic right up until funding costs and defaults decide to start a conversation at the same time.
In an RBA-sensitive tape, Judo can move like a thesis you cannot pause. Spreads, deposits, credit quality, and sentiment all reprice in real time.
What traders watch
Judo is down about -0.58% since Jan 1, meaning traders are watching net interest margin (NIM) versus deposit competition, SME arrears and default signals, and any shift in funding pressure.
Broker handling: The calls shown are all positive. Morgans is Accumulate (noted as a downgrade from Buy). Macquarie is Outperform. Morgan Stanley is Overweight. UBS, Ord Minnett, and Citi are all Buy.
Targets and implied move: Targets range from A$2.05 to A$2.40, the implied last close is about A$1.72. The simple average target in the table is about A$2.19 (around +27% above the implied last close).
Broker tone: Ord Minnett is the most bullish on target price at A$2.40 (+39.53%). UBS is Buy at A$2.25 (+30.81%). Morgan Stanley is Overweight at A$2.20 (+27.91%). Citi is Buy at A$2.15 (+25.00%). Morgans sits at A$2.09 (+21.51%) after the downgrade to Accumulate. Macquarie is Outperform at A$2.05 (+19.19%).
Source: FNArena / Data correct as of Thursday, 26 February 2026.
Risks: SME credit turns quickly in a slowdown, and funding competition can squeeze spreads faster than loan yields reprice.
One day the ASX is drifting quietly... and the next, margin requirements rise, stops do not fill where expected, and portfolios open with uncomfortable overnight gaps.
If you have been searching for answers, you are not alone. Some of the most searched questions about volatility among Australian traders relate to margin calls, slippage, overnight gaps, leveraged exchange traded funds (ETFs), and tools such as average true range (ATR).
Here is what is happening.
Why this matters now
Global markets have become more sensitive to interest rates, inflation data, geopolitics and technology-driven flows. When liquidity thins and uncertainty rises, price swings widen. That is volatility.
And volatility doesn’t just affect price direction, it changes how trades are executed, how much capital is required, and how risk behaves beneath the surface.
Translation: Volatility is not just about bigger moves, rather, it’s about faster moves and thinner liquidity - that’s when the mechanics of trading matter most.
One of the most searched questions about volatility is why margin requirements increase without warning.
When markets become unstable, brokers may increase margin requirements on contracts for difference (CFDs) and other leveraged products. Larger price swings can increase the risk of accounts moving into negative equity thus raising margin requirements reduces available leverage and can help manage exposure during extreme conditions.
What this can mean in practice
-A margin call may occur even if price has not moved significantly. -Effective leverage can drop quickly. -Positions may need to be reduced at short notice.
Margin adjustments are typically a response to changing market risk, not a random decision. In highly volatile markets, it is prudent to assume margin settings can change quickly, therefore many traders choose to review position sizes and available buffers in light of that risk.
What is slippage and why didn’t my stop fill at my price?
Another frequently searched topic is slippage.
Slippage can occur when a stop order triggers and is executed at the next available price, the outcome can depend on the order type, market liquidity and gaps. In calm markets, the difference may be small whereas in fast markets, prices can gap beyond the stop level.
Illustration of price gap through stop-loss level | GO Markets
Stop-loss orders generally prioritise execution rather than price certainty and during periods of high volatility, this distinction becomes important. Adjusting position size and placing stops with reference to typical price movement may be more effective than simply tightening stops in unstable conditions.
How do I manage overnight gapping on the ASX?
Australia trades while the United States sleeps, and vice versa. This time zone difference is, sadly, one reason overnight gap risk is frequently searched by Australian traders. If US markets fall sharply, the ASX may open lower the following morning, with no opportunity to exit between the close and the open.
Examples of risk-management approaches market traders may use include
-Index hedging using ASX 200 futures or CFDs*. -Partial hedging during high risk events. -Reducing exposure ahead of major macro announcements.
Hedging can offset part of a move, but it introduces basis risk as individual stocks may not move in line with the broader index.
There is no perfect protection, only trade-offs between cost, complexity and risk reduction.
*CFDs are complex instruments and come with a high risk of losing money due to leverage.
What are the key risks of leveraged or inverse ETFs in volatile markets?
Leveraged and inverse ETFs are often searched during periods of heightened volatility.
While these products typically reset daily, they aim to deliver a multiple of the index’s daily return, not its long-term return. In a volatile, sideways market, daily compounding can erode value even if the index finishes near its starting level.
This occurs because gains and losses compound asymmetrically. A fall of 10 percent requires a gain of more than 10 percent to recover. When that effect is multiplied daily, outcomes can diverge materially from the underlying index over time.
Such instruments may be used tactically by some market participants. They are generally not designed as long-term hedging tools and understanding their structure is essential before using them in a strategy.
How can ATR be used to inform stop placement?
Average true range (ATR) is a commonly used indicator for measuring volatility.
ATR estimates how much an asset typically moves over a given period, including gaps. Rather than setting a stop at an arbitrary percentage, some traders reference ATR and place stops at a multiple, such as two or three times ATR, to reflect prevailing conditions.
When volatility rises, ATR expands and that can imply wider stops or smaller position sizes if overall risk is to remain constant. The shift is from asking, “How far am I willing to lose?” to asking, “What is a normal move in current conditions?"
Practical considerations in volatile markets
During periods of elevated volatility, traders may consider
Allowing for the possibility of margin changes
Sizing positions conservatively if volatility increases
Recognising that stop-loss orders do not guarantee a specific exit price
Reviewing exposure ahead of major economic events
Understanding the daily reset mechanics of leveraged ETFs
Using volatility measures such as ATR to inform stop placement
Maintaining adequate cash buffers
Volatility does not reward prediction alone. Preparation and risk awareness may assist traders in understanding potential risks, but outcomes remain unpredictable.
Australian markets face specific structural considerations cpmapred to Asian and US Markets. Overnight gap risk is influenced by US trading hours and resource heavy indices such as the ASX can respond quickly to commodity price movements and data from China. Currency exposure, including AUD and US dollar (USD) moves, can add another layer of variability.
Volatility is not uniform across regions. It behaves differently depending on market structure and liquidity depth.
Frequently asked questions about volatility
What causes sudden spikes in market volatility? Interest rate decisions, inflation data, geopolitical developments, earnings surprises and liquidity constraints are common triggers.
Why do brokers increase margin during volatile markets? To reduce leverage exposure and manage risk when price swings widen.
Can stop-loss orders fail during volatility? They can experience slippage if markets gap beyond the stop level, meaning execution may occur at a worse price than expected. In fast or illiquid markets, this difference can be significant.
Are leveraged ETFs suitable for long term hedging? They are generally structured for short-term exposure due to daily resets. Whether they are appropriate depends on your objectives, financial situation and risk tolerance.
How can volatility be measured before placing a trade? Tools such as ATR, implied volatility indicators and historical range analysis can help quantify prevailing conditions.
Risk warning: Periods of heightened volatility can lead to rapid price movements, margin changes and execution at prices different from those expected. Risk-management tools such as stop-loss orders and volatility indicators may assist in assessing market conditions but cannot eliminate the risk of loss, particularly when using leveraged products.
Every time you renew a mortgage, open a savings account, or watch the Australian dollar move, the RBA's decisions are somewhere in the background.
But what actually goes on inside the bank, and what drives the calls that ripple through the entire Australian economy?
Quick facts
The RBA's cash rate is the single most-watched number in Australian finance.
Rate decisions are made by a nine-member board, eight times per year.
The RBA targets inflation of 2–3% on average over time.
Australia's cash rate reached a 12-year high of 4.35% in November 2023.
What is the RBA?
The RBA is Australia’s central bank. Unlike commercial banks that lend to individuals and businesses, the RBA lends to financial institutions, issues the nation's currency, and acts as the government's banker.
It also plays a role in overseeing the stability of the broader financial system. It can step in during periods of economic stress to ensure credit keeps flowing.
For the average Australian, the RBA is most visible through its influence on interest rates. By setting a target for the cash rate, it shapes borrowing and saving costs across the economy.
This influence can filter through to mortgage rates, business lending, and the price of the Australian dollar.
How does the cash rate work?
The cash rate is the interest rate the RBA charges on overnight loans between banks. Banks constantly lend money to each other to manage their daily cash needs, and the RBA sets the floor on what those borrowing costs are.
When the RBA raises the cash rate, banks tend to pass that cost on to borrowers; when it cuts, interest on repayments tends to fall.
This knock-on effect is why the cash rate is such a powerful tool. Banks price their products off the cash rate, so a 0.25% RBA move typically flows through to variable mortgage rates within weeks.
Effects of RBA cash rate moves
A large share of Australian mortgages are on variable rates, so any change in the cash rate tends to pass through to household budgets faster than in countries where fixed-rate lending is more prominent.
How does the RBA make decisions?
The RBA board meets eight times per year to set monetary policy, with meeting dates published in advance.
The Board has nine members: the Governor, the Deputy Governor, the Secretary to the Treasury, and six external members appointed by the Treasurer for five-year terms. Decisions are made by consensus where possible, with the Governor holding a casting vote if needed.
These members make decisions with the intention of maintaining price stability and supporting full employment, with the economic prosperity and welfare of the Australian people as the overarching objective.
Price stability generally means keeping inflation within a 2–3% target band on average over time. The "on average over time" framing is deliberate; the RBA doesn't panic if inflation briefly strays outside the band, but sustained deviation in either direction can prompt the Board to consider a policy response.
Full employment is viewed in terms of the Non-Accelerating Inflation Rate of Unemployment (NAIRU), the lowest unemployment rate the economy can sustain without generating inflationary wage pressure. Estimates vary, but the RBA has historically placed this around 4–4.5%.
The tension between these two goals defines most RBA decisions. A strong labour market is good news for workers, but it can push wages (and therefore inflation) higher. On the other hand, cooling inflation often requires accepting some rise in unemployment.
In the lead-up to each meeting, RBA staff prepare extensive briefing materials covering every major economic indicator. The Board debates the evidence over two days before reaching a decision. The outcome is announced publicly at 2:30 pm AEDT on the meeting day, followed by a detailed statement and a press conference by the Governor.
Key inputs to each decision
The RBA's recent rate cycle
The current rate cycle is one of the most aggressive in the RBA's modern history. After holding the cash rate at a record low of 0.10% through the COVID pandemic, the RBA began hiking in May 2022 and raised rates thirteen times before pausing at 4.35% in November 2023.
A borrower with a $750,000 variable-rate mortgage saw their monthly repayments rise by roughly $1,500 to $1,800 between May 2022 and late 2023, a significant squeeze on household budgets that fed directly into the consumer slowdown the RBA was trying to engineer.
Throughout 2025, the RBA periodically dropped the rate back down, with it now sitting at 3.75% after a recent hike in February 2026.
Monthly CPI is generally considered the most important single data point for RBA watchers. If the data returns a “quarterly trimmed mean CPI” print above 3%, it can sharpen expectations of a hike or delay cuts (particularly if it surprises to the upside). The “trimmed mean” is the RBA's preferred measure as it tends to reduce data noise from volatility.
Labour force data
The labour force data includes numbers on the unemployment and underemployment rates, and wage growth. The RBA watches these numbers closely for any signs that wages may be rising at a pace inconsistent with the inflation target.
Governor's speeches and appearances
Between formal meetings, the Governor testifies before the House Economics Committee and delivers public speeches. These are closely scrutinised for sentiment signals of the board. Simple shifts in language, from "patient" to "vigilant", for example, can often be perceived as a change in tone that could influence the rate decision in upcoming meetings.
Neutral rate
The “neutral rate” is the cash rate range the RBA believes will neither speed the economy up nor slow it down. The current neutral cash rate is estimated at around 3.0–3.5%, which is below the actual rate of 3.75%, a sign that the RBA is still pumping the brakes on the economy. As the rate gets closer to the neutral zone, it can signal less urgency for the RBA to keep cutting. However, surprise data can always upend this assumption.
Global central banks
The RBA doesn't operate in isolation. If the US Federal Reserve holds rates higher for longer, it limits the RBA's room to cut without weakening the AUD and importing inflation through higher import prices.
Bottom line
The RBA's job is to keep the Australian economy on an even keel, and the cash rate is its main tool for doing so. Its decisions touch almost every corner of Australian financial life, from what you pay on your mortgage to how the Aussie dollar trades.
For traders, understanding how the RBA thinks and what it is watching goes a long way toward making sense of the broader Australian economic environment.
Before the charts start talking, the region does. Over the weekend, the Middle East moved from tense to kinetic. Joint US and Israeli strikes hit targets inside Iran, and multiple outlets reported Iran’s Supreme Leader Ayatollah Ali Khamenei was killed. That single fact changes the whole market sentence structure and it is not just geopolitics, it is risk premia being re-priced in real time, across energy, volatility and the global growth outlook.
Markets do not trade tragedy, rather they trade uncertainty. When the uncertainty sits on top of global energy arteries, price discovery gets loud.
At a glance
What happened: Multiple major outlets reported that Iran’s Supreme Leader Ayatollah Ali Khamenei was killed following joint US and Israeli strikes inside Iran, with Iranian state media cited as confirming his death.
What markets may focus on now: A fast-moving repricing of geopolitical risk premia, led by crude and refined products, plus cross-asset volatility as headlines drive liquidity, correlations and intraday ranges.
What is not happening yet: Markets may be pricing more of a headline risk premium than a fully evidenced, sustained physical supply disruption.
Next 24 to 72 hours: Focus is likely to stay on escalation signals and second-order constraints, including any impact on Gulf shipping routes and the policy and diplomatic track, including any UN Security Council dynamics.
Australia and Asia hook: Flight and airspace disruptions are already spilling beyond the region. For markets, Asia-facing sensitivities can show up through refinery margins and shipping and insurance costs, while AUD can behave as a risk barometer when global risk appetite is unstable.
Oil is the transmission mechanism
Brent crude spiked by as much as 13% in early trade on Monday 2 March, touching around US$82 per barrel in reporting, as the Strait of Hormuz risk moved from theoretical to immediate. The Strait matters because roughly one-fifth of global oil and gas shipments pass through it and when tankers hesitate, insurers re-price, and routes get re-written, energy becomes a volatility product.
Base case: partial disruption and higher “risk premium” in crude, with big intraday swings. Upside risk: a sustained shipping slowdown or direct infrastructurehits, which some analysts warn could push crude materially higher. Downside risk: de-escalation headlines, emergency supply responses, orclearer shipping protection that compresses the risk premium.
The VIX does not move in a vacuum, and this spike in uncertainty is already spilling into other asset classes in a fairly ‘textbook’ way. As volatility reprices, the market’s first instinct has been a flight to safety, alongside a scramble for commodities most exposed to the conflict.
Monday saw Asia opened with that tone: Japan’s Nikkei 225 was reported down around 2.4%, and Australia’s ASX 200 dipped before stabilising. At the same time, defensive positioning showed up in classic safe havens. Gold futures gapped higher by roughly 3% over the weekend, while traditional refuge currencies, led by the Swiss franc, attracted immediate inflows against both the euro and the US dollar.
Equity risk, by contrast, took the hit. US index futures, including the Dow and S&P 500, opened lower as desks moved to price in the twin threat of a wider regional conflict and the inflationary drag that can follow a sharp jump in energy costs.
Gold rallied as the market reached for insurance. Reporting had gold up close to 3% in the same Monday session that oil surged. Worth noting for Aussie and Asia traders: when oil jumps and gold jumps together, the market is often telling you it is worried about both inflation and growth. That is a messy mix for central banks, including the RBA, because petrol-driven inflation can rise even as demand softens.
What this could mean for CFD risk management
Focus 1: map the event risk calendar
In headline-driven markets, prices can move faster than liquidity. The risk is not just being wrong; it can also be timing and execution risk in volatile conditions.
Some traders monitor which developments might change market sentiment (for example, official statements or verified operational updates). If you choose to trade, it may be worth understanding how price gaps and volatility could affect your position, including around session opens and major announcements.
Markets can gap or move quickly, and order execution (including stop orders, if used) may not occur at expected levels, especially in fast conditions or low liquidity. Features and outcomes depend on the product terms and market conditions.
Focus 2: watch the energy to inflation pathway
If crude remains elevated, markets may watch whether inflation expectations shift. If that occurs, it could influence rates, equities and FX and although outcomes depend on multiple factors and can change quickly.
That may be reflected in:
Global bond yields, as rates markets adjust.
Equity valuation sensitivity, particularly in long-duration and growth-heavy areas.
FX moves, including across the Australian dollar, Japanese yen, and some commodity-linked currencies.