A resistance level is a key tool in technical analysis, indicating when an asset has reached a price level that market participants are unwilling to surpass. Resistance levels are often used in conjunction with support levels, or the point at which traders are unwilling to let an asset's price drop much lower. To understand this fully, it’s important to understand how support and resistance works in general.
A support line is when a price hits a low point (on the selling side) and resistance is when the price hits a high (on the buying side). If the prices rebound back to this price or continue to hit this price without surpassing it, it then starts to become a key resistance or support level. As a rule of thumb when using technical analysis, these tools become very important for some traders.
This is due to those points offering various outcomes. Whether they are a Bounce or a Break, essentially meaning, does the price hit the support/resistance and comes back (Bounce) or does it go through the support/resistance lines (Breaks). It is important to also use other indicators to accompany your technical analysis, as these movements could also easily become reversals or break outs, meaning, instead of them following your prognosis the price does the opposite.
When a price has been rejected various times, it builds an even stronger key resistance. Trading volume and sentiment can help to propel a price past this point and some of the biggest movements come after a price breaks a key resistance. Using a current trend (Fig 1) and a hypothetical trend (Fig 2), let’s take the daily timeframe for BTCUSD as an example (below).
The daily candle has broken through a key resistance of $41,000 as shown on figure 1. If a trader identifies this, they can do one of two things; trade it aggressively and place a trade as it breaks through or trade it conservatively and wait for the former resistance line to become the new support line before placing a trade (so wait for the price to bounce off as outlined on the drawn projection and circled on figure 2). Figure 1.
Figure 2. This technical analysis can be used for any asset you wish to trade: it’s transferrable and key in identifying entry or exit points of trades. By learning to spot the patterns and combining this with knowledge of trading volume and sentiment, you can start to understand the markets better.
The information provided is of general nature only and does not take into account your personal objectives, financial situations or needs. Before acting on any information provided, you should consider whether the information is suitable for you and your personal circumstances and if necessary, seek appropriate professional advice. All opinions, conclusions, forecasts or recommendations are reasonably held at the time of compilation but are subject to change without notice. Past performance is not an indication of future performance. Go Markets Pty Ltd, ABN 85 081 864 039, AFSL 254963 is a CFD issuer, and trading carries significant risks and is not suitable for everyone. You do not own or have any interest in the rights to the underlying assets. You should consider the appropriateness by reviewing our TMD, FSG, PDS and other CFD legal documents to ensure you understand the risks before you invest in CFDs.
La volatilidad tiene una forma de aparecer sin invitación.
Un día el ASX está a la deriva silenciosamente... y al siguiente, los requisitos de margen aumentan, las paradas no llenan donde se esperaba, y las carteras se abren con incómodas brechas de la noche a la mañana.
Si has estado buscando respuestas, no estás solo. Algunas de las preguntas más buscadas sobre la volatilidad entre los comerciantes australianos se relacionan con llamadas de margen, deslizamiento, brechas nocturnas, fondos cotizados en bolsa apalancados (ETF) y herramientas como promedio true range (ATR).
Esto es lo que está pasando.
Por qué esto es importante ahora
Los mercados mundiales se han vuelto más sensibles a las tasas de interés, los datos de inflación, la geopolítica y los flujos impulsados por la tecnología. Cuando la liquidez se hace más baja y la incertidumbre sube, las oscilaciones de precios se ensanchan. Eso es volatilidad.
Y la volatilidad no solo afecta la dirección de los precios, sino que cambia la forma en que se ejecutan las operaciones, cuánto capital se requiere y cómo se comporta el riesgo debajo de la superficie.
Traducción: La volatilidad no se trata solo de movimientos más grandes, más bien, se trata de movimientos más rápidos y liquidez más delgada, ahí es cuando más importa la mecánica del trading.
¿Por qué mi broker aumentó los requerimientos de margen?
Una de las preguntas más buscadas sobre la volatilidad es por qué los requerimientos de margen aumentan sin previo aviso.
Cuando los mercados se vuelven inestables, los corredores pueden aumentar los requerimientos de margen en los contratos por diferencia (CFDs) y otros productos apalancados. Las oscilaciones de precios mayores pueden aumentar el riesgo de que las cuentas pasen a acciones negativas, por lo que aumentar los requerimientos de margen reduce el apalancamiento disponible y puede ayudar a administrar la exposición durante condiciones extremas.
Lo que esto puede significar en la práctica
-Una llamada de margen puede ocurrir incluso si el precio no se ha movido significativamente. -El apalancamiento efectivo puede caer rápidamente. -Es posible que sea necesario reducir las posiciones con poca antelación.
Los ajustes de margen suelen ser una respuesta al riesgo cambiante del mercado, no una decisión aleatoria. En mercados altamente volátiles, es prudente asumir que los ajustes de margen pueden cambiar rápidamente, por lo tanto, muchos operadores optan por revisar los tamaños de posición y los buffers disponibles a la luz de ese riesgo.
¿Qué es el deslizamiento y por qué mi stop no llenó a mi precio?
Otro tema que se busca con frecuencia es el deslizamiento.
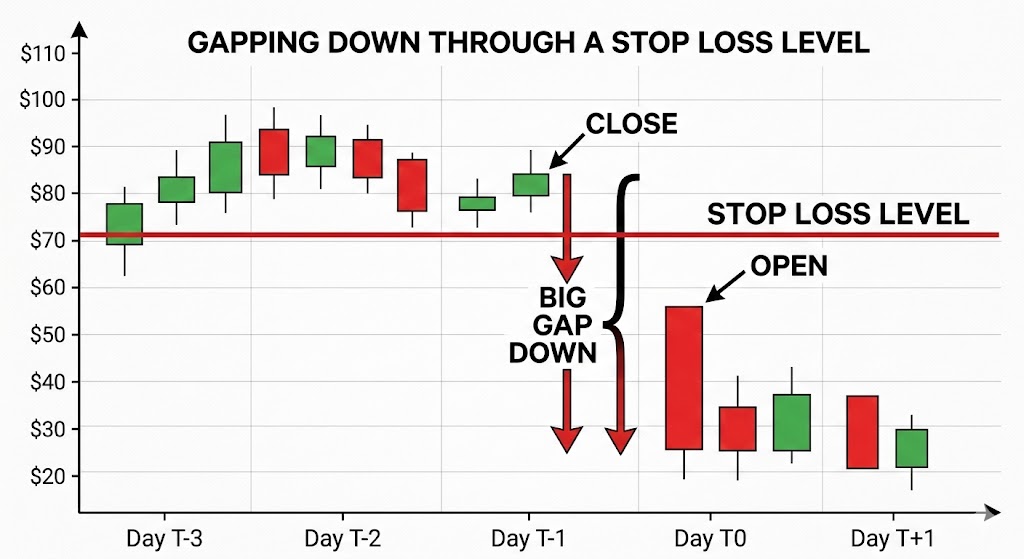
El deslizamiento puede ocurrir cuando una orden de stop se activa y se ejecuta al siguiente precio disponible, el resultado puede depender del tipo de orden, liquidez del mercado y brechas. En los mercados tranquilos, la diferencia puede ser pequeña mientras que en los mercados rápidos, los precios pueden dispararse más allá del nivel de parada.
Ilustración de la brecha de precios a través del nivel stop-loss | GO Markets
Los controladores comunes incluyen
-Principales liberaciones económicas o de ganancias. -Liquidez delgada. -Niveles de parada abarrotados. -Sesiones nocturnas.
Las órdenes stop-loss generalmente priorizan la ejecución en lugar de la certeza del precio y durante los períodos de alta volatilidad, esta distinción se vuelve importante. Ajustar el tamaño de la posición y colocar topes con referencia al movimiento típico del precio puede ser más efectivo que simplemente apretar los topes en condiciones inestables.
¿Cómo administro la división nocturna en el ASX?
Australia comercia mientras Estados Unidos duerme, y viceversa. Esta diferencia de zona horaria es, lamentablemente, una de las razones por las que los comerciantes australianos buscan con frecuencia el riesgo de brecha nocturna. Si los mercados estadounidenses caen bruscamente, el ASX podría abrir a la baja a la mañana siguiente, sin oportunidad de salir entre el cierre y el abierto.
Los ejemplos de enfoques de gestión de riesgos que los comerciantes del mercado pueden utilizar incluyen
-Cobertura de índices mediante futuros ASX 200 o CFD*. -Cobertura parcial durante eventos de alto riesgo. -Reducir la exposición antes de los principales anuncios de macro.
La cobertura puede compensar parte de un movimiento, pero introduce un riesgo de base, ya que las acciones individuales pueden no moverse en línea con el índice más amplio.
No existe una protección perfecta, solo compensaciones entre costo, complejidad y reducción de riesgos.
*Los CFDs son instrumentos complejos y conllevan un alto riesgo de perder dinero debido al apalancamiento.
¿Cuáles son los riesgos clave de los ETF apalancados o inversos en mercados volátiles?
Los ETF apalancados e inversos a menudo se buscan durante períodos de mayor volatilidad.
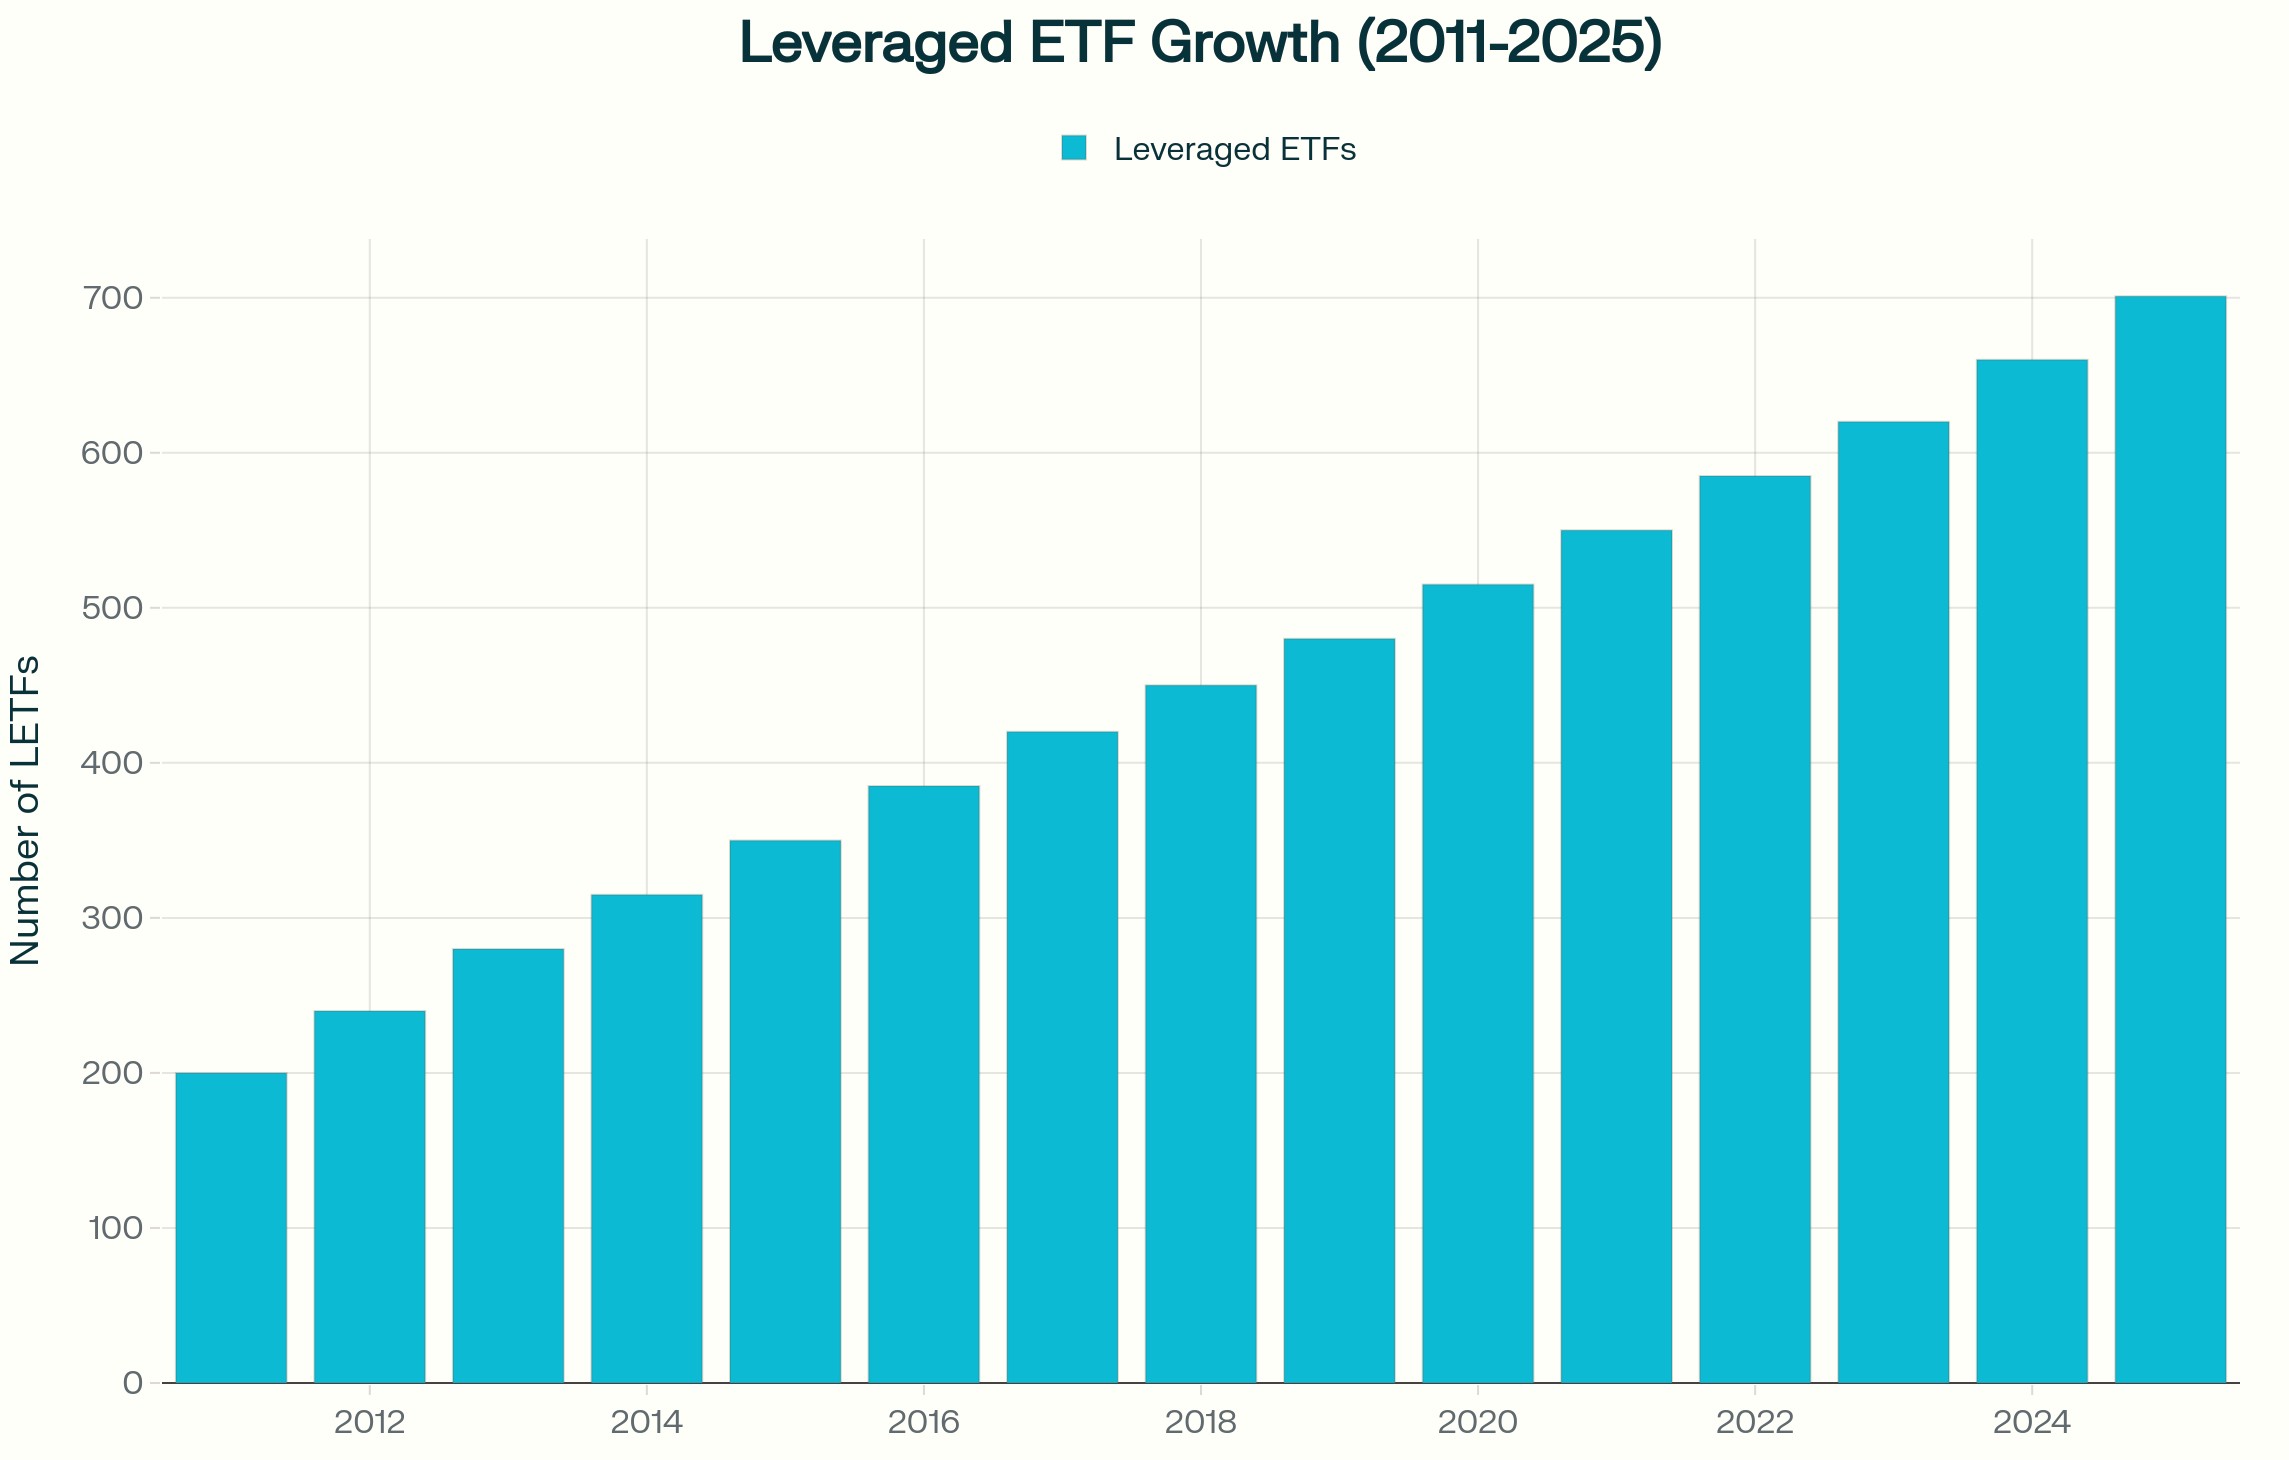
Si bien estos productos generalmente se restablecen diariamente, su objetivo es ofrecer un múltiplo del rendimiento diario del índice, no su retorno a largo plazo. En un mercado volátil, lateral, la composición diaria puede erosionar el valor aunque el índice termine cerca de su nivel inicial.
Crecimiento de ETF apalancado (2011-2025) | Fuente: Investing.com
Esto ocurre porque las ganancias y pérdidas se combinan asimétricamente. Una caída del 10 por ciento requiere una ganancia de más del 10 por ciento para recuperarse. Cuando ese efecto se multiplica diariamente, los resultados pueden divergir materialmente del índice subyacente a lo largo del tiempo.
Dichos instrumentos pueden ser utilizados tácticamente por algunos participantes en el mercado. Por lo general, no están diseñados como herramientas de cobertura a largo plazo y comprender su estructura es esencial antes de utilizarlos en una estrategia.
¿Cómo se puede utilizar ATR para informar la colocación de paradas??
El rango verdadero promedio (ATR) es un indicador comúnmente utilizado para medir la volatilidad.
ATR estima cuánto se mueve típicamente un activo durante un período determinado, incluidas las brechas. En lugar de establecer una parada en un porcentaje arbitrario, algunos comerciantes hacen referencia a ATR y colocan paradas en un múltiplo, como dos o tres veces ATR, para reflejar las condiciones prevalecientes.
Cuando la volatilidad aumenta, el ATR se expande y eso puede implicar paradas más amplias o tamaños de posición más pequeños si el riesgo general va a permanecer constante. El cambio es de preguntar: “¿Hasta dónde estoy dispuesto a perder?” a preguntar: “¿Qué es una mudanza normal en las condiciones actuales?”
Consideraciones prácticas en mercados volátiles
Durante los períodos de elevada volatilidad, los comerciantes pueden considerar
Permitiendo la posibilidad de cambios de margen
Dimensionamiento de posiciones de manera conservadora si aumenta la volatilidad
Reconocer que las órdenes de stop-loss no garantizan un precio de salida específico
Revisar la exposición antes de los principales eventos económicos
Comprender la mecánica de reinicio diario de los ETF apalancados
Uso de medidas de volatilidad como ATR para informar la colocación de paradas
Mantenimiento de los búferes de efectivo adecuados
La volatilidad no recompensa por sí sola la predicción. La preparación y el conocimiento del riesgo pueden ayudar a los comerciantes a comprender los riesgos potenciales, pero los resultados siguen siendo impredecibles.
Lo que esto significa para los comerciantes australianos
Los mercados australianos enfrentan consideraciones estructurales específicas en comparación con los mercados asiáticos y estadounidenses. El riesgo de brecha durante la noche está influenciado por las horas de negociación de Estados Unidos y los índices con gran cantidad de recursos como el ASX pueden responder rápidamente a los movimientos de los precios de las materias primas y los datos de China. La exposición a la moneda, incluidos los movimientos del AUD y el dólar estadounidense (USD), puede agregar otra capa de variabilidad.
La volatilidad no es uniforme en todas las regiones. Se comporta de manera diferente dependiendo de la estructura del mercado y la profundidad de liquidez.
Preguntas frecuentes sobre volatilidad
¿Qué causa picos repentinos en la volatilidad del mercado? Las decisiones sobre tasas de interés, los datos de inflación, la evolución geopolítica, las sorpresas de ganancias y las limitaciones de liquidez son desencadenantes comunes.
¿Por qué los brokers aumentan el margen durante los mercados volátiles? Para reducir la exposición del apalancamiento y administrar el riesgo cuando las oscilaciones de precios se amplíen.
¿Pueden fallar las órdenes stop-loss durante la volatilidad? Pueden experimentar deslizamiento si los mercados se disparan más allá del nivel stop, lo que significa que la ejecución puede ocurrir a un precio peor de lo esperado. En mercados rápidos o ilíquidos, esta diferencia puede ser significativa.
¿Los ETF apalancados son adecuados para la cobertura a largo plazo? Por lo general, están estructurados para la exposición a corto plazo debido a los reajustes diarios. Si son adecuados depende de tus objetivos, situación financiera y tolerancia al riesgo.
¿Cómo se puede medir la volatilidad antes de realizar una operación? Herramientas como ATR, indicadores de volatilidad implícita y análisis de rango histórico pueden ayudar a cuantificar las condiciones prevalecientes.
Advertencia de riesgo: Los períodos de mayor volatilidad pueden conducir a rápidos movimientos de precios, cambios de margen y ejecución a precios diferentes a los esperados. Las herramientas de gestión del riesgo, como las órdenes de stop-loss y los indicadores de volatilidad, pueden ayudar a evaluar las condiciones del mercado, pero no pueden eliminar el riesgo de pérdida, especialmente cuando se utilizan productos apalancados.
Every trader has had that moment where a seemingly perfect trade goes astray.
You see a clean chart on the screen, showing a textbook candle pattern; it seems as though the market planets have aligned, and so you enthusiastically jump into your trade.
But before you even have time to indulge in a little self-praise at a job well done, the market does the opposite of what you expected, and your stop loss is triggered.
This common scenario, which we have all unfortunately experienced, raises the question: What separates these “almost” trades from the truly higher-probability setups?
The State of Alignment
A high-probability setup isn’t necessarily a single signal or chart pattern. It is the coming together of several factors in a way that can potentially increase the likelihood of a successful trade.
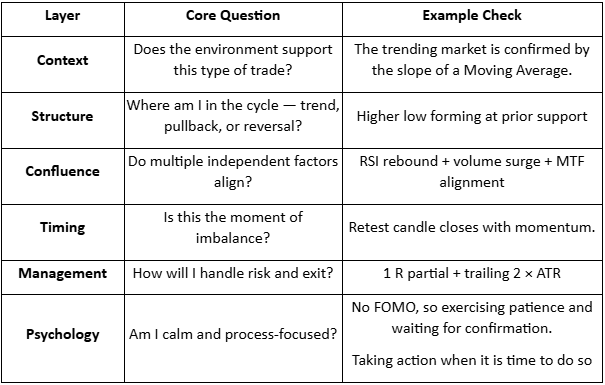
When combined, six interconnected layers can come together to form the full “anatomy” of a higher-probability trading setup:
Context
Structure
Confluence
Timing
Management
Psychology
When more of these factors are in place, the greater the (potential) probability your trade will behave as expected.
Market Context
When we explore market context, we are looking at the underlying background conditions that may help some trading ideas thrive, and contribute to others failing.
Regime Awareness
Every trading strategy you choose to create has a natural set of market circumstances that could be an optimum trading environment for that particular trading approach.
For example:
Trending regimes may favour momentum or breakout setups.
Ranging regimes may suit mean-reversion or bounce systems.
High-volatility regimes create opportunity but demand wider stops and quicker management.
Investing time considering the underlying market regime may help avoid the temptation to force a trending system into a sideways market.
Simply looking at the slope of a 50-period moving average or the width of a Bollinger Band can suggest what type of market is currently in play.
Sentiment Alignment
If risk sentiment shifts towards a specific (or a group) of related assets, the technical picture is more likely to change to match that.
For example, if the USD index is broadly strengthening as an underlying move, then looking for long trades in EURUSD setups may end up fighting headwinds.
Setting yourself some simple rules can help, as trading against a potential tidal wave of opposite price change in a related asset is not usually a strong foundation on which to base a trading decision.
Key Reference Zones
Context also means the location of the current price relative to levels or previous landmarks.
Some examples include:
Weekly highs/lows
Prior session ranges, e.g. the Asian high and low as we move into the European session
Major “round” psychological numbers (e.g., 1.10, 1000)
A long trading setup into these areas of market importance may result in an overhead resistance, or a short trade into a potential area of support may reduce the probability of a continuation of that price move before the trade even starts.
Market Structure
Structure is the visual rhythm of price that you may see on the chart. It involves the sequences of trader impulses and corrections that end up defining the overall direction and the likelihood of continuation:
Uptrend: Higher highs (HH) and higher lows (HL)
Downtrend: Lower highs (LH) and lower lows (LL)
Transition: Break in structure often followed by a retest of previous levels.
A pullback in an uptrend followed by renewed buying pressure over a previous price swing high point may well constitute a higher-probability buy than a random candle pattern in the middle of nowhere.
Compression and Expansion
Markets move through cycles of energy build-up and release. It is a reflection of the repositioning of asset holdings, subtle institutional accumulation, or a response to new information, and may all result in different, albeit temporary, broad price scenarios.
Compression: Evidenced by a tightening range, declining ATR, smaller candles, and so suggesting a period of indecision or exhaustion of a previous price move,
Expansion: Evidenced by a sudden breakout, larger candle bodies, and a volume spike, is suggestive of a move that is now underway.
A breakout that clears a liquidity zone often runs further, as ‘trapped’ traders may further fuel the move as they scramble to reposition.
A setup aligned with such liquidity flows may carry a higher probability than one trading directly into it.
Confluence
Confluence is the art of layering independent evidence to create a whole story. Think of it as a type of “market forensics” — each piece of confirmation evidence may offer a “better hand’ or further positive alignment for your idea.
There are three noteworthy types of confluence:
Technical Confluence – Multiple technical tools agree with your trading idea:
Moving average alignment (e.g., 20 EMA above 50 EMA) for a long trade
A Fibonacci retracement level is lining up with a previously identified support level.
Momentum is increasing on indicators such as the MACD.
Multi-Timeframe Confluence – Where a lower timeframe setup is consistent with a higher timeframe trend. If you have alignment of breakout evidence across multiple timeframes, any move will often be strengthened by different traders trading on different timeframes, all jumping into new trades together.
3. Volume Confluence – Any directional move, if supported by increasing volume, suggests higher levels of market participation. Whereas falling volume may be indicative of a lesser market enthusiasm for a particular price move.
Confluence is not about clutter on your chart. Adding indicators, e.g., three oscillators showing the same thing, may make your chart look like a work of art, but it offers little to your trading decision-making and may dilute action clarity.
Think of it this way: Confluence comes from having different dimensions of evidence and seeing them align. Price, time, momentum, and participation (which is evidenced by volume) can all contribute.
Timing & Execution
An alignment in context and structure can still fail to produce a desired outcome if your timing is not as it should be. Execution is where higher probability traders may separate themselves from hopeful ones.
Entry Timing
Confirmation: Wait for the candle to close beyond the structure or level. Avoid the temptation to try to jump in early on a premature breakout wick before the candle is mature.
Retests: If the price has retested and respected a breakout level, it may filter out some false breaks that we will often see.
Then act: Be patient for the setup to complete. Talking yourself out of a trade for the sake of just one more candle” confirmation may, over time, erode potential as you are repeatedly late into trades.
Session & Liquidity Windows
Markets breathe differently throughout the day as one session rolls into another. Each session's characteristics may suit different strategies.
For example:
London Open: Often has a volatility surge; Range breaks may work well.
New York Overlap: Often, we will see some continuation or reversal of morning trends.
Asian Session: A quieter session where mean-reversion or range trading approaches may do well
Trade Management
Managing the position well after entry can turn probability into realised profit, or if mismanaged, can result in losses compounding or giving back unrealised profit to the market.
Pre-defined Invalidation
Asking yourself before entry: “What would the market have to do to prove me wrong?” could be an approach worth trying.
This facilitates stops to be placed logically rather than emotionally. If a trade idea moves against your original thinking, based on a change to a state of unalignment, then considering exit would seem logical.
Scaling & Partial Exits
High-probability trade entries will still benefit from dynamic exit approaches that may involve partial position closes and adaptive trailing of your initial stop.
Trader Psychology
One of the most important and overlooked components of a higher-probability setup is you.
It is you who makes the choices to adopt these practices, and you who must battle the common trading “demons” of fear, impatience, and distorted expectation.
Let's be real, higher-probability trades are less common than many may lead you to believe.
Many traders destroy their potential to develop any trading edge by taking frequent low-probability setups out of a desire to be “in the market.”
It can take strength to be inactive for periods of time and exercise that patience for every box to be ticked in your plan before acting.
Measure “You” performance
Each trade you take becomes data and can provide invaluable feedback. You can only make a judgment of a planned strategy if you have followed it to the letter.
Discipline in execution can be your greatest ally or enemy in determining whether you ultimately achieve positive trading outcomes.
Bringing It All Together – The Setup Blueprint
Final Thoughts
Higher-probability setups are not found but are constructed methodically.
A trader who understands the “higher-probability anatomy” is less likely to chase trades or feel the need to always be in the market. They will see merit in ticking all the right boxes and then taking decisive action when it is time to do so.
It is now up to you to review what you have in place now, identify gaps that may exist, and commit to taking action!
One of the most impactful books I’ve ever read is “The 7 Habits of Highly Effective People: Powerful Lessons in Personal Change” by Stephen Covey.
When it was first published in 1989, it quickly became one of the most influential works in business and personal development literature, and retained its place on bestseller lists for the next couple of decades.
The compelling, comprehensive, and structured framework for personal growth presented in the book has undoubtedly inspired many to rethink how they organise their lives and priorities, both professionally and personally.
Although its lessons were originally designed for self-improvement and positive structured growth, the underlying principles are universal, making them easily transferable to many areas of life, including trading.
In this article, you will explore how each of Covey’s seven original habits can be reframed within a trading context, in an attempt to offer a structure that may help guide you to becoming the best trader you can be.
1. Be Proactive
Being proactive means recognising that we have the power to choose our responses and to shape outcomes through appropriate preparation with subsequent planned reactions.
In a Trading Context:
For traders, this means anticipating potential problems before they arise and putting measures in place to better mitigate risk.
Rather than waiting for issues to unfold, the proactive trader identifies potential areas of concern and ensures that they have access to the right tools, resources, and people to prepare effectively, whatever the market may throw at them.
What This Means for You:
Being proactive may involve seeking out quality education and services, maintaining access to accurate and timely market information, continually assessing risk and opportunity, and having systems to manage those risks within defined limits.
Consequences of Non-Action:
Inadequate preparation and a lack of defined systems often lead to poor trading decisions and less-than-desired outcomes.
Failing to assess risk properly can result in significant and often avoidable losses.
By contrast, a proactive approach builds resilience and confidence, ensuring that when challenges arise, your response is measured and less emotionally driven by what is happening on the screen in front of you.
2. Begin with the End in Mind
Covey's second habit is about defining purpose. It suggests that effective people are more likely to achieve what is possible if they start with a clear understanding of their destination, so every action aligns with that ultimate vision.
In a Trading Context:
Ask yourself: What is my true purpose for trading?
Many traders may instinctively answer “to make money,” but money is surely only a vehicle to achieve something else in your world for you and those you care about, not a purpose per se.
You need to clarify what trading success really means for you.
Is it a greater degree of financial independence through increased income or capital growth, the freedom of having more time, achieving a personal challenge of becoming an effective trader, or a combination of any of these?
What This Means to You:
Try framing your purpose as, “I must become a better trader so that I can…” and complete a list with your genuine reasons for tackling the market and its challenges.
This helps you establish meaningful short-term development goals that keep you moving toward your vision. Keep that purpose visible, as a note near your trading screen that reminds you why you are doing this.
Consequences of Non-Action:
Traders with a clearly defined purpose are more likely to stay disciplined and consistent.
Those without one often drift, chasing short-term gains without direction. There is ample evidence that formalising your development in whatever context through goal setting can significantly increase the likelihood of success. Why would trading be any different?
Surely the bottom-line question to ask yourself is, “Am I willing to risk my potential by trading without purpose?”
3. Put First Things First
This habit is about time management and prioritisation. This involves focusing your efforts and energy on what truly matters. As part of the exploration of this concept, Covey emphasised distinguishing between what is important and what is merely urgent.
In a Trading Context:
Trading demands commitment, learning, and reflection.
It is not just about screen time but about using that time effectively.
Managing activities to ensure your effort is spent wisely on planning, measuring, journaling and performance evaluation, and refining systems, accordingly, are all critical to sustaining both improvements in results and balance.
What This Means to You:
Traders often believe they need to spend more time trading when what they really need is to focus on better time allocation.
It is logical to suggest that prioritising activities that can often contribute directly to improvement, such as system testing, reviewing performance, analysing results, and refining your strategy, is worthwhile.
These high-value tasks can help traders focus their time more deliberately and systematically.
Consequences of Non-Action:
If you fail to control your trading time effectively, you will be more likely to spend much of it on low-impact activities that produce little progress.
Over time, this not only hurts your results but also reduces the real “hourly value” of your trading effort.
In business terms, and of course, you should be treating your trading as you would any business activity; poor prioritisation can inflate your costs and diminish your potential trading outcomes.
4. Think Win: Win
Covey's fourth habit encouraged an attitude of mutual benefit, where seeking solutions that facilitate positive outcomes for all parties.
In a Trading Context:
In trading, this concept must be adapted to suggest that developing a mindset that recognises every well-executed plan as a win, even when an individual trade results in a loss.
Some trading ideas will simply not work out, and so some losses are inevitable, but if they remain within defined limits, they should not be viewed as failures but rather as a successful adherence to a trading plan. In the aim of developing consistency in action, and the widely held belief that this is one of the cornerstones of effective trading, then it surely is a win to fulfil this.
So, in simple terms, the real “win” lies in a combination of maintaining discipline, following your system, and controlling risk beyond just looking at the P/L of a single trade.
What This Means to You:
Building and trading clear, unambiguous systems that you follow consistently has got to be the goal.
This process produces reliable data that you can later analyse and subsequently use to refine specific strategies and personal performance.
When you do this, every outcome, whether profit or loss, can serve as valuable feedback.
For example, a controlled loss that fits your plan is proof that your system works and that you are protecting your capital.
Alternatively, a trailing stop strategy, which means you exit trades in a timely way and give less profit back to the market, provides positive feedback that your system has merit in achieving outcomes.
Consequences of Non-Action:
Without this mindset shift, traders can become emotionally reactive, interpreting normal drawdowns as personal defeats.
This fosters loss aversion and other biases that can erode decision-making quality if left unchecked. Through the process of redefining “winning,” you are potentially safeguarding both your capital and, importantly, your trading confidence (a key component of trading discipline).
5. Seek First to Understand and Then Take Action
Covey's fifth habit emphasises empathy, the act of listening and aiming to fully understand before responding. In trading, this principle translates to understanding the market environment before taking any action.
In a Trading Context:
Many traders act impulsively, driven by excitement or fear, which often results in entering trades without taking into account the full context of what is happening in the market, and/or the potential short-term influences on sentiment that may increase risk.
This “minimalisation bias,” defined as acting on limited information, will rarely produce consistent results. Instead, adopt a process that begins with observation and comprehension.
What This Means to You:
Establishing a daily pre-trading routine is critical. This may include a review of key markets, sentiment indicators, and potential catalysts for change, such as imminent key data releases. Understanding what the market is telling you before you decide what to do is the aim of having this sort of daily agenda.
This approach may not only improve trade selection but also enable you to get into a state of psychological readiness that can facilitate decision-making quality throughout the session.
Consequences of Non-Action:
Failing to prepare for the trading day ahead can mean not only exposing yourself to unnecessary risk but also arguably being more likely to miss potential opportunities.
A trader who acts without understanding is vulnerable both psychologically and financially. Conversely, being forewarned is being forearmed. When you aim to understand markets first before any type of trading activity, your actions are more likely to be deliberate, grounded, and more effective.
6. Synergise
Synergy in Covey's model means valuing differences and combining the strengths of those around you to create outcomes greater than the sum of their parts.
In a Trading Context:
In trading, synergy refers to the integration of multiple systems and disciplines that work together. This includes your plan, your record keeping and performance management processes, your time management, and your emotional balance.
No single system is enough; success comes from the synergy of elements that support and inform one another.
What This Means to You:
Integrating learning and measurement is an integral part of your trading development process. Journaling, for example, allows you to assess not only your technical performance but also your behavioural consistency.
This self-awareness allows you to refine your plan and so helps you operate with greater confidence.
The synergy between rational analysis and emotional composure is what is more likely to lead to consistently sound trading decisions.
Consequences of Non-Action:
When logic and emotion are out of balance, decision-making will inevitably suffer.
If your systems are incomplete, ambiguous, or poorly connected to the reality of your current level of understanding, competence and confidence, your results are likely to be inconsistent. Building synergy across all areas of your trading practice, including that of evaluation and development in critical trading areas, will help create cohesion, efficiency, and better performance.
7. Sharpen the Saw
Covey's final habit focuses on continuous learning and refinement, including maintaining and improving the tools at your disposal and skills and knowledge that allow you to perform effectively.
In a Trading Context:
In trading, this translates to creating a plan to achieve ongoing, purposeful learning.
Even small insights can make a large difference in results. Effective traders continually refine their knowledge, ask new questions, and apply lessons from experience.
What This Means to You:
Trading learning can, of course, take many forms. Discovering new indicators that may offer some confluence to price action, testing different strategies, exploring new markets, or simply understanding more about yourself as a trader.
There is little doubt that active participation in learning keeps you engaged, adaptable and sharp. Even making sure you ask at least one question at a seminar or webinar or making a simple list at the end of each session of the "3 things I learned", can be invaluable in developing momentum for your growth as a trader.
Your record-keeping and performance metrics should generate fresh questions that can guide future development.
Consequences of Non-Action:
Without direction in your learning, your progress is likely to slow.
I often reference that when someone talks about trading experience in several years, this is only meaningful if there has been continuous growth, rather than staying in the same place every year (i.e. only one year of meaningful experience)
Passive trading learning, for example, reading an article without applying, watching a webinar without engagement, or measuring without closing the circle through putting an action plan together for your development, can all lead to stagnation.
It is fair to suggest that taking shortcuts in trading learning is likely to translate directly into shortcuts in result success.
Active, focused development is essential for sustained improvement.
Are You Ready for Action?
Stephen Covey’s The 7 Habits of Highly Effective People presented a timeless model for self-development and purposeful living.
When applied to trading, these same habits form a powerful framework for consistency, focus, and growth.
Trading is a pursuit that demands both technical skill and emotional strength. Success is rarely about finding the perfect system, but about developing the right habits that support consistent, rational decision-making over time.
By integrating the principles of Covey’s seven habits into your trading practice, you create a foundation not only for profitability but for continual personal growth.
Las acciones de defensa de ASX vuelven a estar en más listas de vigilancia y según el Instituto Internacional de Investigación para la Paz de Estocolmo (SIPRI), el gasto militar mundial alcanzó aproximadamente 2.718 billones de dólares en 2024, un alza de 9.4% en términos reales.
El entorno actual de defensa de Australia se establece en la Estrategia de Defensa Nacional de 2024 y los documentos de planificación de inversiones relacionados, que describen las prioridades de financiación de la capacidad a largo plazo. Además, Canberra ha apuntado a una inversión de capacidad de 330 mil millones de dólares australianos hasta 2034, incluida la financiación adicional para combatientes de superficie, preparación, ataque de largo alcance y sistemas autónomos.
Aquí está la parte que la mayoría de la gente extraña: no todas las acciones de defensa ASX son del mismo comercio. Algunos se sientan cerca de la construcción naval. Algunos son nombres de contra-drones y algunos son operadores más pequeños y de mayor riesgo donde un contrato puede importar mucho más de lo que el mercado supone.
Estos cinco nombres no son una lista de compras, sino que son una lista de vigilancia práctica para los inversores que intentan entender dónde puede aparecer realmente el impulso de adquisiciones en el ASX.
1) Austal (ASX: ASB)
Austal es una de las empresas cotizadas en ASX más directamente expuestas al oleoducto de construcción naval de Australia, aunque la ejecución del contrato, los márgenes y el tiempo de entrega siguen siendo variables importantes.
No solo están ganando contratos aleatorios; han firmado un acuerdo legal masivo (el Acuerdo Estratégico de Construcción Naves) que los convierte en el socio oficial para la construcción de la próxima generación de buques militares de tamaño mediano de Australia en Australia Occidental.
En febrero de 2026, el gobierno dio luz verde a Austal a un proyecto de 4 mil millones de dólares. Esto no es para un solo barco, es para 8 buques “Landing Craft Heavy”. Se trata de enormes barcos de transporte (de unos 100 metros de largo) diseñados para llevar tanques pesados y equipos directamente a una playa. Pero aquí está la parte que la mayoría de la gente extraña, la construcción naval es un maratón, no un sprint.
Como puede ver en el cronograma de entrega, mientras que la construcción comienza en 2026, el barco final no se entregará hasta 2038. Para un inversionista, esto significa que Austal tiene un flujo de ingresos “garantizado” para los próximos 12 años, pero tienen que ser muy buenos en el manejo de sus costos durante ese largo período para realmente obtener ganancias.
2) Escudo del DroneShield (ASX: DRO)
Si ha visto imágenes de pequeños drones que interrumpen los campos de batalla modernos, DroneShield está construyendo parte del “interruptor de apagado”. Su enfoque es la tecnología antidrones, que incluye sistemas que detectan, interrumpen o derrotan drones utilizando guerra electrónica, sensores y herramientas dirigidas por software, en lugar de depender solo de municiones tradicionales.
A principios de 2026, DroneShield había ido más allá de la etiqueta de una prometedora start-up y se había adentrado en una fase comercial mucho más grande. Reportó ingresos para el año fiscal 2025 por 216.5 millones de dólares estadounidenses, un 276% más que en el año fiscal 2024, y dijo que inició el año fiscal 2026 con 103.5 millones de dólares de A$ en ingresos comprometidos.
Un punto que el mercado puede pasar por alto es la capa de software en el modelo. DroneShield reportó 11.6 millones de dólares estadounidenses en ingresos de Software como Servicio (SaaS) en el año fiscal 2025 y dijo que está trabajando para que SaaS represente el 30% de los ingresos dentro de cinco años. Su modelo de suscripción incluye actualizaciones de software para sistemas implementados, lo que agrega un flujo creciente de ingresos recurrentes junto con las ventas de hardware.
Entre las acciones de defensa ASX, DroneShield es una de las formas más directas de seguir el tema Counter-UAS. También es uno de los nombres donde el sentimiento puede oscilar rápidamente, porque las historias de crecimiento pueden regenerar tanto hacia arriba como hacia abajo cuando cambia el tiempo de los pedidos.
EOS construye tanto el “cerebro” como el “músculo” para plataformas militares. Es mejor conocido por los sistemas de armas remotas, que permiten a los operadores controlar torretas armadas desde el interior de vehículos protegidos, y por los sistemas láser de alta energía dirigidos a la defensa contra drones. EOS ha dicho que su rezago incondicional alcanzó alrededor de 459.1 millones de dólares estadounidenses a principios de 2026, tras una serie de victorias contractuales hasta 2025. Eso apunta a una base mucho mayor de trabajo seguro, aunque el tiempo de entrega y la conversión de ingresos siguen siendo importantes.
EOS firmó un contrato de 71.4 millones de euros, unos 125 millones de dólares australianos, con un cliente europeo para un sistema de armas láser de alta energía de 100 kilovatios. EOS dice que el sistema está diseñado para un bajo costo por disparo y puede involucrar hasta 20 drones por minuto. El gobierno australiano ha reservado 1.300 millones de dólares australianos a lo largo de 10 años para la adquisición de capacidad de contra-drones, y EOS ha revelado que formó parte de un exitoso equipo de licitación de LAND 156. Eso no garantiza ingresos futuros, pero sí soporta visibilidad a mediano plazo en un mercado al que la compañía ya se dirige.
EOS se lee como una historia de rebote, pero una que aún depende de la ejecución. La compañía se ha reorientado en torno a sistemas de armas remotas, sistemas de contra-drones y láseres, todas áreas vinculadas a un mayor gasto en defensa. La pregunta clave es si puede seguir convirtiendo el backlog y la canalización en ingresos entregados mientras mantiene la disciplina del balance.
4) Codan (ASX: CDA)
Codan a veces se deja fuera de las listas de acciones de defensa casuales porque está más diversificado. Eso puede ser un descuido. En sus resultados del primer semestre fiscal 26, Codan dijo que su negocio de Comunicaciones diseña comunicaciones de misión crítica para los mercados militares y de seguridad pública globales. Los ingresos por comunicaciones subieron 19% a 221,8 millones de dólares de A$. La compañía también dijo que DTC brindó un fuerte crecimiento de la demanda de sistemas no tripulados y de defensa, con ingresos por sistemas no tripulados que aumentaron 68% a A$73 millones. Codan dijo que aproximadamente la mitad de esos ingresos no tripulados estaban vinculados a aplicaciones de defensa operativa en zonas de conflicto.
Aquí es donde la historia se vuelve más matizada. En una canasta de acciones de defensa ASX, Codan puede ofrecer un perfil diferente, con una sensibilidad de titular menos pura, una diversificación operativa más amplia y una exposición significativa a las comunicaciones militares y los sistemas no tripulados sin ser un nombre de tema único. Esa diversificación también puede significar que las acciones no siempre se negocian como un nombre de defensa de juego puro.
HighCom se encuentra en el extremo especulativo de esta lista, y debería etiquetarse de esa manera. La compañía dice que sus dos negocios continuos son HighCom Armor, que suministra protección balística, y HighCom Technology, que suministra y mantiene pequeños y medianos sistemas aéreos no tripulados, sistemas aéreos contra-no tripulados, e ingeniería relacionada, integración, mantenimiento y apoyo logístico para la ADF y otros ejércitos regionales alineados.
En el primer trimestre del año fiscal 26, los ingresos por operaciones continuas cayeron 59% a A$10.9 millones, mientras que el EBITDA pasó a una pérdida de A$5.4 millones desde una ganancia de A$1.9 millones un año antes. HighCom también reveló 5,1 millones de dólares australianos en ingresos de HighCom Technology, incluidos 3,5 millones de dólares australianos de piezas de repuesto para sistemas aéreos no tripulados (SUAS) y 1,6 millones de dólares australianos por servicios de sostenimiento prestados al Departamento de Defensa de Australia.
Entonces sí, HighCom es una de las acciones de defensa ASX más sensibles financieramente en la junta. Pero también es el tipo de nombre más pequeño que puede mostrar cómo las adquisiciones se filtran hacia el soporte, el mantenimiento y el equipo de protección especializado.
Observaciones clave del mercado
Haga un seguimiento de los hitos del programa, no solo los titulares políticos. Las adjudicaciones de contratos, los inicios de fabricación, los cronogramas de entrega y el trabajo de mantenimiento a menudo importan más que un solo día de anuncio.
Separe la exposición pura de la exposición diversificada. DroneShield y EOS están más cerca de los temas concentrados de tecnología de defensa, mientras que Codan aporta exposición a las comunicaciones dentro de una combinación de negocios más amplia.
Vea temas de capacidad soberana en Australia. Austal y EOS están vinculados a la fabricación local, la integración y las cadenas de suministro australianas, lo que respalda el tema de capacidad soberana más amplio en este grupo.
Presta atención a los balances y conversión de efectivo. El impulso de las adquisiciones puede ser real incluso cuando el tiempo se vuelve desordenado. La última mitad de HighCom es un recordatorio de eso.
Los titulares de defensa pueden parecer inmediatos. Por lo general, las ganancias no lo son. El principal trabajo naval de Austal se extiende hasta la próxima década. Los contratos EOS se entregan a lo largo de varios años. El flujo de pedidos de DroneShield parece sólido, pero la compañía aún separa los ingresos comprometidos de una oportunidad de canalización más amplia. HighCom muestra la otra cara de la moneda. La exposición a las adquisiciones no se traduce automáticamente en una ejecución financiera fluida.
Las referencias a las acciones de defensa que cotizan en ASX son solo información general, no una recomendación para comprar, vender o mantener cualquier título o CFD. Estas acciones pueden ser altamente volátiles y son sensibles al momento de los contratos, la política gubernamental, la geopolítica, el riesgo de ejecución y las condiciones del mercado. Las expectativas de backlog, pipeline e ingresos no son garantías de performance futuro.
Tres bancos centrales están decidiendo las tasas simultáneamente, el crudo Brent se balancea salvajemente alrededor de 100 dólares el barril, y una guerra en el Medio Oriente está reescribiendo las perspectivas de inflación en tiempo real. Pase lo que pase esta semana podría marcar la pauta para los mercados para el resto de 2026.
Datos rápidos
El Banco de la Reserva de Australia (RBA) anuncia su próxima decisión sobre la tasa de efectivo el martes, con los mercados ahora valorando una probabilidad del 66% de una segunda subida a 4.1%.
Algunos analistas han advertido que la guerra de Irán podría empujar la inflación estadounidense a 3.5% para fin de año y retrasar los recortes de tipos de la Fed hasta septiembre, lo que convierte el diagrama de puntos del FOMC de esta semana en el más observado en años.
El crudo Brent está coqueteando con 100 dólares el barril después de que Irán lanzara lo que medios estatales describieron como su “operación más intensa desde el comienzo de la guerra”.
RBA: ¿Australia volverá a subir?
El RBA elevó la tasa de caja por primera vez en dos años a 3.85% en su reunión de febrero luego de que la inflación repuntara materialmente en el segundo semestre de 2025.
La pregunta ahora es si vuelve a moverse antes incluso de ver la próxima impresión trimestral del IPC, que no vence hasta el 29 de abril.
El vicegobernador Andrew Hauser reconoció antes de la reunión que los formuladores de políticas enfrentan una decisión genuinamente dividida, moldeada por señales económicas conflictivas en el país y la creciente inestabilidad en el extranjero.
Actualmente los mercados financieros asignan alrededor de un 66% de probabilidad a otra alza, con un aumento de mayo considerado prácticamente seguro independientemente de lo que ocurra el lunes.
Fechas clave
Decisión sobre la tasa de efectivo del RBA: martes 17 marzo, 14:30 h AEDT
Conferencia de prensa del gobernador Bullock: martes 17 marzo, 15:30 h AEDT
Monitorear
Cualquier referencia de Bullock a nuevas subidas es probable en mayo
FOMC: Es probable que todos los ojos estén puestos en el diagrama de puntos
El FOMC se reúne del 17 al 18 de marzo, con la declaración de política programada para las 2:00pm ET del 18 de marzo y la conferencia de prensa del presidente Jerome Powell a las 2:30pm. El CME FedWatch muestra una probabilidad del 99% de que la Fed mantenga las tasas en 3.50% a 3.75%.
El verdadero accionar se encuentra en el Resumen de Proyecciones Económicas (SEP) y el diagrama de puntos. El punto medio actual muestra un corte de 25 puntos básicos para 2026. Si cambia a dos cortes, eso es dóciles y alcistas para los activos de riesgo. Si se desplaza a cero recortes o agrega una subida de tasas a la proyección, los mercados podrían reaccionar en la otra dirección.
Para complicar aún más las cosas, el mandato de Powell como Presidente de la Reserva Federal expira el 23 de mayo de 2026. Kevin Warsh es el principal candidato para reemplazarlo, visto como más duro en política monetaria. Cualquier comentario de Powell sobre esta transición podría mover los mercados independientemente de la decisión de tasa en sí.
Fecha clave
Decisión de tasa FOMC + Gráfica SEP/punto: jueves 19 de marzo, 4:00 a.m. AEDT
Conferencia de prensa de Powell: jueves 19 de marzo, 4:30 a.m. AEDT
Monitorear
El lenguaje de Powell sobre el petróleo y la inflación arancelaria.
Reacción de rendimiento de tesorería a 2 años.
Reajuste de precios de FedWatch de CME para cualquier cambio en la probabilidad de corte de septiembre.
Banco de Japón: Podría adelantarse un mayor endurecimiento
El BOJ se reúne del 18 al 19 de marzo, con la decisión prevista para el jueves por la mañana, hora de Tokio. La tasa de política actual se sitúa en 0.75% (un máximo de 30 años), y la reunión de enero de 2026 produjo una retención en una votación de 8-1.
El gobernador Ueda ha categorizado la reunión de marzo como “en vivo”, señalando que el cronograma para un mayor endurecimiento podría “adelantarse” si las negociaciones salariales de primavera de Shunto arrojan resultados más fuertes de lo esperado.
Esos resultados van a comenzar a fluir durante la semana, convirtiéndolos en el insumo crítico para la decisión del BOJ. Nomura espera que las subidas salariales de Shunto 2026 lleguen en torno al 5.0%, incluida la antigüedad, con un crecimiento salarial base de aproximadamente 3.4%. Si los resultados confirman esa trayectoria, el caso de una alza en marzo se fortalece considerablemente.
La complicación es el telón de fondo global. Japón importa aproximadamente el 90% de sus necesidades energéticas, y el petróleo alrededor de 100 dólares por barril está empujando al alza los costos de importación y amenazando con agregar presión inflacionaria. Una subida del BOJ a un shock petrolero global sería un movimiento inusualmente audaz.
La mayoría de los participantes del mercado aún se inclinan hacia una espera en esta reunión, siendo abril o julio vistos como el momento más probable para el próximo movimiento.
Fecha clave
Decisión sobre la tasa de política del BOJ (actualmente 0.75%): Jueves 19 de marzo, mañana AEDT
Monitorear
Resultados salariales de Shunto como principal detonante de un alza en marzo.
Idioma de la conferencia de prensa de Ueda y orientación a futuro en abril y julio.
El crudo Brent tocó brevemente 119,50 dólares por barril a principios de semana antes de caer 17% a menos de US$80, luego rebotando hacia US$95 ante señales mixtas de Washington sobre el Estrecho de Ormuz.
Al jueves, Brent estaba de vuelta por más de 100 dólares, ya que Irán lanzó nuevos ataques contra el transporte marítimo comercial y la liberación de la reserva de la AIE no logró brindar un alivio significativo.
En el escenario donde un conflicto más prolongado inflige daños a la infraestructura energética, los analistas estiman que el IPC podría subir a 3.5% para fines de 2026, con los precios de la gasolina acercándose a los 5 dólares por galón en el segundo trimestre.
Para esta semana, el petróleo actúa como una macro meta-variable. Cada titular geopolítico, señal de alto el fuego, ataque de petroleros, liberación de reservas y comentario de Trump podrían mover acciones, bonos y monedas en tiempo real.
Monitorear
Cualquier flujo de petrolero reanudado del Estrecho de Ormuz.
Los ataques estadounidenses e israelíes contra Irán lanzados el 28 de febrero hicieron que el crudo Brent superara los 119 dólares el barril, el oro por encima de los 5.200 dólares, y acciones de defensa a máximos históricos.
En ese contexto, los inversionistas se están enfocando en un pequeño grupo de nombres vinculados a materias primas que pueden seguir siendo sensibles a nuevos movimientos en petróleo, GNL y oro. La pregunta clave es si el choque resulta sostenido, o si un alto el fuego, la normalización del transporte marítimo o una acción política eliminan parte de la prima de riesgo geopolítico.
1. ExxonMobil (NYSE: XOM)
ExxonMobil ha sido uno de los beneficiarios más claros del aumento de precios. Las acciones alcanzaron un máximo histórico de US$159,60 a principios de marzo y están subiendo aproximadamente 28% en lo que va de año.
La compañía produce 4.7 millones de barriles de petróleo equivalente por día, tiene un punto de equilibrio en la Cuenca Pérmica de alrededor de 35 dólares por barril, y está comprometida con 20 mil millones de dólares en recompras para 2026.
Wells Fargo elevó su objetivo de precios a 183 dólares desde 156 dólares tras la escalada, mientras que el consenso de analistas más amplio se sitúa en torno a US$140—US$144. Sin embargo, XOM ya está negociando por encima de muchos objetivos de consenso, y la interrupción de su socio de GNL QatarEnergy plantea un viento en contra operativo a corto plazo.
Qué ver
Si las interrupciones de Ormuz persisten más allá de 4 a 6 semanas.
Una liberación de las existencias de emergencia del G7 o un alto el fuego creíble podrían comprimir la prima de riesgo de guerra.
Cualquier ajuste a los objetivos de consenso de los analistas.
Chevron tocó un nuevo máximo de 52 semanas de 196,76 dólares a principios de marzo y ha subido aproximadamente 24% en lo que va de año.
El punto de equilibrio Brent de la compañía para dividendos y gastos de capital ronda los 50 dólares por barril. Esto significa que a los precios actuales del petróleo por encima de los 90 dólares, está generando un importante flujo de caja libre.
Sin embargo, Chevron ha detenido temporalmente las operaciones en un campo de gas frente a la costa de Israel tras la actividad de misiles en la región, y desde entonces el stock ha retrocedido más del 1% ya que el conflicto afecta directamente sus operaciones.
Qué ver
Actualizaciones operativas directas de los activos israelíes y de Oriente Medio de Chevron.
Cualquier otra paralización que pueda pesar sobre la producción a corto plazo.
Retención de crudo por encima de los 90 dólares, lo que mantiene a Chevron generando un importante flujo de caja libre.
3. Woodside Energy (ASX: WDS/NYSE: WDS)
Dado que Qatar detuvo la producción después de los ataques con aviones no tripulados iraníes, los compradores de toda Asia y Europa están buscando un suministro alternativo. Woodside, como uno de los mayores productores y exportadores de GNL de Australia, se encuentra fuera de la zona de conflicto y está bien posicionado para beneficiarse de la demanda redireccionada.
Los analistas advirten que la sustitución real lleva tiempo debido a las restricciones de envío y del contrato, lo que significa que el aumento de precios puede ser más duradero que un simple comercio al contado. Los precios del gas de referencia del TTF europeo se dispararon más del 50% en una semana, amplificando el entorno de margen para los productores de GNL que no son de Oriente Medio.
Qué ver
El ritmo y el cronograma de cualquier reinicio de la producción de GNL de Qatar.
Si QatarEnergy permanece fuera de línea durante semanas, Woodside podría comenzar a recontratar compradores europeos a precios puntuales elevados.
Un movimiento del dólar australiano al alza podría ser un viento en contra que vale la pena rastrear para las ganancias denominadas en USD.
4. Cheniere Energy (NYSE: GNL)
Junto a Woodside, Cheniere es el beneficiario estadounidense más directo de la interrupción del GNL de Qatar. Al ser el mayor exportador de GNL de Estados Unidos, vio fortaleza intradiaria al inicio de la semana del conflicto.
La producción nacional de energía de Estados Unidos ha amortiguado a los consumidores estadounidenses de lo peor de la conmoción, pero la prima de exportación se ha ampliado a medida que los compradores europeos y asiáticos pagan por el suministro fuera del Golfo.
El comercio es “geopolíticamente sensible”, y cualquier resolución podría revertir rápidamente al alza. Pero mientras la infraestructura de gas de Ormuz y del Golfo siga comprometida, Cheniere está posicionada para beneficiarse estructuralmente.
Qué ver
Cualquier avance diplomático que reabra las rutas marítimas del Golfo.
Anuncios de nuevos contratos de rebajas a largo plazo firmados a precios actuales elevados.
El oro repuntó 5.2% en una sola sesión el 1 de marzo, al tocar los US$5,246/oz, ya que los mercados buscaban activos de refugio seguro. Newmont, el mayor productor de oro del mundo, ha visto sus reservas efectivamente revaluadas a estos precios.
Está al alza junto con la ganancia anual del 24% del oro hasta la fecha, y sus costos de sostenimiento total permanecen en gran medida fijos.
No obstante, los mineros de oro se vendieron bruscamente el 4 de marzo, y Newmont cayó casi 8% en una sola sesión, ya que un desapalancamiento más amplio del riesgo afectó a las renta variable de metales preciosos.
El stock se ha recuperado desde entonces, pero la volatilidad sigue siendo alta. Para los inversionistas de mayor duración, los analistas señalan que las jurisdicciones mineras “seguras” como Canadá, Australia y Nevada están ordenando nuevas primas a medida que la inestabilidad de Oriente Medio eleva el valor del suministro geopolíticamente seguro.
Qué ver
Si el oro puede aguantar más de US$5,000/oz.
Un conflicto prolongado podría acelerar un ciclo de M&A en mineros de oro junior.
Un alto el fuego o un evento amplio de desapalancamiento de la equidad como riesgo principal a monitorear.
Lockheed Martin alcanzó un nuevo máximo histórico de 676.70 dólares el 3 de marzo, un aumento de más del 4% durante el día. Sus cazas F-35, municiones guiadas de precisión, sistemas THAAD y artillería de cohetes HIMARS son fundamentales para la campaña aérea en curso.
El Departamento de Defensa de Estados Unidos se está moviendo para reponer las reservas de municiones, y la ambición declarada de Trump de elevar el presupuesto de defensa de Estados Unidos a 1,5 billones de dólares para 2027 agrega un viento de cola estructural a más largo plazo más allá del conflicto inmediato.
Las acciones de defensa están subiendo en medio de la clásica fijación de precios de riesgo geopolítico, pero los inversores deben tener en cuenta que el flujo contractual real tarda tiempo en traducirse en ganancias, y las valoraciones ya reflejan un optimismo considerable.
Qué ver
El ritmo de las órdenes de reposición de municiones del Departamento de Defensa de Estados Unidos.
La rapidez con la que gana el contrato se traduce en un crecimiento del backlog.
Barrick está siguiendo la racha histórica del oro junto a Newmont, con las acciones subidas bruscamente en lo que va de año. Se encuentra en una capitalización bursátil de aproximadamente 78 mil millones de dólares estadounidenses y está reportando proyecciones récord de flujo de caja libre, ya que sus costos de mantenimiento total se mantienen muy por debajo de los precios al contado actuales.
Al igual que Newmont, experimentó una fuerte venta en una sola sesión de más del 8% durante el evento más amplio de desapalancamiento del 4 de marzo, antes de recuperarse parcialmente.
Las empresas de regalías y streaming como Wheaton Precious Metals (WPM) están siendo favorecidas por algunos inversores como una forma más protegida contra la inflación de acceder al oro al alza, dada su menor exposición a los costos operativos. Pero Barrick sigue siendo uno de los mineros de oro que cotizan en bolsa más grandes del mundo, con ganancias que son muy sensibles a los cambios en el precio del oro.
Qué ver
La capacidad del oro para mantener por encima de US$5,000/oz.
Cualquier Barrick se mueve hacia adquisiciones de mineros junior.
Inflación de costos de energía, ya que el aumento de los precios de los combustibles podría comenzar a exprimir los márgenes operativos de los mineros.


.jpg)
.jpg)


