Venezuela At number one, we have a country which has been in turmoil in the last few months – Venezuela. Economic and social crisis have hit the South American nation and things are not looking to get better any time soon. However, it does top the list as the country with the largest crude oil reserves in the world at 300 billion barrels.
Worth pointing out that it was the 15 th largest crude oil exporter at $26,4 billion barrels making it up 2.3% of the world total. Capital: Caracas Official language: Spanish Population: 31,568,179 Gross Domestic Product: $92 billion Currency: Petro (PTR), Bolivar Soberano (VES) Saudi Arabia The next on the list is Saudi Arabia, which was actually the top crude oil exporter in the world last year with $182 billion worth of oil exports which was around 15,9% of the total crude oil exports in the world. The middle eastern country is highly reliant on its oil exports and its proven oil reserves amount to around 266 billion barrels.
Capital: Riyadh Official language: Arabic Population: 33,000,000 Gross Domestic Product: $759 billion Currency: Saudi Riyal (SAR) Canada At number three we have the North American nation of Canada with crude oil reserves of around 169 billion barrels with 95% of these reserves are in the oil sands deposits in the western province of Alberta. Canada was the 4th largest crude oil exporter last year with $68,9 billion worth of exports, making it up 5.8% of the total. Capital: Ottawa Official language: English and French Population: 37,067,011 Gross Domestic Product: $1,9 trillion Currency: Canadian Dollar (CAD) Iran The Islamic Republic of Iran is at number four with 158 billion worth of proven oil reserves.
Iran was the 8 th largest crude oil exporter in the world with $45,7 billion, which was around 4% of the world total. Capital: Tehran Official language: Persian Population: 81,672,300 Gross Domestic Product: $413 billion Currency: Iranian Rial (IRR) Iraq The last one on our list of countries with the largest crude oil exporters is Iraq with 142 billion barrels. Iraq was the 3 rd biggest crude oil exporter in 2018 with $91 billion worth of exports which made up 7.9% of the total.
Iraq was one of the founding member Organization of the Petroleum Exporting Countries (OPEC) with Iran, Kuwait, Saudi Arabia, and Venezuela when it was established back in 1960. Iraq’s economy is highly depended on oil with oil production accounting for 2/3 of the country’s GDP. Capital: Baghdad Official language: Arabic and Kurdish Population: 37,202,671 Gross Domestic Product: $233 billion Currency: Iraqi dinar (IQD) This article is written by a GO Markets Analyst and is based on their independent analysis.
They remain fully responsible for the views expressed as well as any remaining error or omissions. Traders can access hundreds of CFD instruments including Forex, Shares, Indices and Oil Commodities. Trading Forex and Derivatives carries a high level of risk.
The information provided is of general nature only and does not take into account your personal objectives, financial situations or needs. Before acting on any information provided, you should consider whether the information is suitable for you and your personal circumstances and if necessary, seek appropriate professional advice. All opinions, conclusions, forecasts or recommendations are reasonably held at the time of compilation but are subject to change without notice. Past performance is not an indication of future performance. Go Markets Pty Ltd, ABN 85 081 864 039, AFSL 254963 is a CFD issuer, and trading carries significant risks and is not suitable for everyone. You do not own or have any interest in the rights to the underlying assets. You should consider the appropriateness by reviewing our TMD, FSG, PDS and other CFD legal documents to ensure you understand the risks before you invest in CFDs.
Langkah terbaru dalam minyak telah menempatkan nama-nama energi kembali dalam fokus. Selama enam bulan terakhir, Exxon Mobil dan Baker Hughes telah mengungguli minyak mentah Brent secara normal, Chevron tetap konstruktif secara luas, SLB telah tertinggal dari komoditas dan konsensus broker Woodside telah lebih terukur.
Ketika minyak mentah bergerak, dampaknya jarang tetap terkendali pada komoditas itu sendiri. Harga minyak yang lebih tinggi dapat mempengaruhi ekspektasi inflasi, biaya pengiriman dan margin perusahaan di seluruh ekonomi global.
Apa yang ditunjukkan oleh langkah terbaru
Ada tiga cara besar perusahaan dapat memperoleh manfaat dari harga minyak yang lebih kencang:
Memproduksi minyak dan gas, dengan menjual komoditas dengan harga yang lebih tinggi
Menyediakan jasa dan peralatan kepada produsen
Mengangkut minyak ke seluruh dunia
Masing-masing nama di bawah ini mewakili salah satu jenis eksposur tersebut, dengan profil risiko yang berbeda ketika minyak mentah naik.
1. Exxon Mobil (NYSE: XOM)
Selama enam bulan terakhir, Exxon Mobil telah mengungguli minyak mentah Brent, dengan harga sahamnya naik hampir 35% dibandingkan dengan sekitar 30% untuk Brent. Pada 11 Maret 2026, keduanya diperdagangkan lebih dari 3% di bawah level tertinggi sepanjang masa, sementara Exxon tetap mendekati level tertinggi 52 minggu.
Exxon Mobil adalah salah satu perusahaan minyak terintegrasi terbesar di dunia, dengan eksposur yang mencakup eksplorasi, produksi, penyulingan, dan bahan kimia. Ketika harga minyak naik, bisnis hulu mungkin mendapat manfaat dari margin yang lebih luas, sementara skala dan diversifikasi dapat membantu melindungi bagian siklus yang lebih lemah.
Kinerja 6 bulan Exxon Mobil (XOM) vs Brent Crude
Minyak mentah Exxon Mobil dan Brent menormalkan kinerja selama enam bulan, pada 11 Maret 2026 pada saat penulisan | Sumber: Share Trader
Konsensus analis: Beli
Menurut data TradingView, sentimen analis terhadap Exxon secara luas positif. Dari 31 analis yang dilacak, 15 menilai saham Strong Buy atau Buy, 13 menilai itu Hold, 1 menilai Sell dan 2 menilai Strong Sell.
Pandangan positif itu terkait dengan kekuatan neraca Exxon dan produksi margin yang lebih tinggi. Analis paling optimis memproyeksikan target harga 1 tahun setinggi US $183,00. Target harga rata-rata adalah US$145,00, yang berada sekitar 3,6% di bawah harga perdagangan saat ini.
Peringkat analis Exxon Mobil dan target harga, per 11 Maret 2026 pada saat penulisan | Sumber: TradingView
2. Chevron (NYSE: CVX)
Chevron adalah perusahaan utama terintegrasi global lainnya yang telah mendapat manfaat dari pergerakan minyak mentah baru-baru ini yang lebih tinggi, dengan sahamnya diperdagangkan mendekati level tertinggi 52 minggu. Seperti Exxon, Chevron beroperasi di seluruh rantai nilai, termasuk produksi hulu, pemurnian dan pemasaran.
Akuisisi Chevron atas Hess yang telah selesai menambahkan Guyana dan aset hulu lainnya, yang dilihat oleh beberapa analis sebagai pendukung dari waktu ke waktu. Konon, dampak pendapatan tetap tunduk pada integrasi, pelaksanaan proyek dan risiko harga komoditas.
Kinerja Exxon Mobil vs Chevron, grafik 6 bulan
Chevron dan Exxon Mobil menormalkan kinerja selama enam bulan, pada 11 Maret 2026 pada saat penulisan | Sumber: Share Trader
Konsensus analis: Beli
Chevron dipandang mirip dengan Exxon, dengan sentimen broker tetap konstruktif secara luas. Agregat TradingView terbaru menunjukkan 30 analis yang mencakup saham selama tiga bulan terakhir, dengan 17 menilai itu Strong Buy atau Buy, 11 di Hold, 1 di Sell dan 1 di Strong Sell.
Analis telah menyoroti portofolio Chevron yang beragam dan potensi kontribusi dari Hess, meskipun volatilitas harga komoditas dan risiko eksekusi mungkin membuat beberapa orang lebih berhati-hati.
Peringkat analis Chevron dan target harga, per 11 Maret 2026 pada saat penulisan | Sumber: TradingView
3. SLB (NYSE: SLB)
SLB, sebelumnya dikenal sebagai Schlumberger, adalah salah satu penyedia layanan ladang minyak dan teknologi terbesar di dunia. Ini memasok alat, peralatan, dan perangkat lunak yang membantu produsen menemukan, mengebor, dan menyelesaikan sumur dengan lebih efisien.
Selama enam bulan terakhir, SLB telah tertinggal dari minyak mentah Brent, dengan perdagangan harga saham dalam kisaran yang lebih tajam dan tetap di bawah puncaknya baru-baru ini. Itu menunjukkan latar belakang minyak yang lebih kuat belum sepenuhnya tercermin dalam harga saham.
Pola itu tidak biasa bagi perusahaan jasa ladang minyak, di mana keputusan pengeluaran pelanggan sering mengikuti pergerakan dalam komoditas yang mendasarinya daripada bergerak seiring dengan mereka. Setiap peringkat ulang di masa depan akan tergantung pada faktor-faktor termasuk pengeluaran modal produsen, waktu kontrak, harga layanan, aktivitas lepas pantai dan kondisi pasar yang lebih luas. Harga minyak yang lebih kuat seharusnya tidak diasumsikan secara otomatis diterjemahkan ke dalam harga saham SLB yang lebih kuat.
Minyak mentah SLB vs Brent, kinerja normal 6 bulan
Minyak mentah SLB dan Brent menormalkan kinerja selama enam bulan, per 11 Maret 2026 pada saat penulisan | Sumber: Share Trader
Konsensus: Beli
Menurut data TradingView, konsensus analis pihak ketiga tentang SLB adalah Beli. Dari 33 analis yang meliput saham, 27 menilai Strong Buy atau Buy, 4 menilai Hold dan 2 menilai Sell atau Strong Sell.
Itu menunjukkan sentimen broker yang konstruktif, meskipun kesenjangan antara harga minyak dan kinerja harga saham SLB baru-baru ini menunjukkan investor mungkin masih menginginkan bukti yang lebih jelas tentang peningkatan permintaan layanan dan penetapan harga sebelum saham sepenuhnya mencerminkan latar belakang komoditas yang lebih kuat.
Peringkat analis SLB dan target harga, per 11 Maret 2026 pada saat penulisan | Sumber: TradingView
4. Baker Hughes (NASDAQ: BKR)
Baker Hughes adalah penyedia layanan dan peralatan ladang minyak utama lainnya, dengan eksposur tambahan ke segmen industri seperti LNG dan infrastruktur listrik. Bahkan ketika harga minyak tidak berada pada titik tertinggi yang ekstrim, kemajuan dalam teknologi pengeboran dan biaya impas yang lebih rendah telah membantu menjaga banyak permainan serpih menguntungkan, mendukung permintaan akan layanannya.
Perusahaan juga telah digambarkan sebagai posisi yang baik karena neraca dan eksposurnya terhadap aktivitas eksplorasi dan produksi yang sedang berlangsung. Dalam periode harga minyak yang lebih tinggi, atau bahkan stabil ke perusahaan, campuran layanan dan teknologi energi dapat menciptakan beberapa pendorong pendapatan.
Selama enam bulan terakhir, Baker Hughes secara material mengungguli minyak mentah Brent secara normal. Brent diperdagangkan dalam kisaran yang jauh lebih ketat untuk sebagian besar periode sebelum bergerak lebih tinggi akhir-akhir ini, sementara BKR naik lebih mantap dan mencapai keuntungan kumulatif yang jauh lebih kuat. Itu menunjukkan harga saham BKR diuntungkan tidak hanya dari latar belakang minyak, tetapi juga dari optimisme khusus perusahaan dan dukungan yang lebih luas untuk layanan ladang minyak dan nama teknologi energi.
Minyak mentah BKR vs Brent, kinerja normal 6 bulan
Baker Hughes dan minyak mentah Brent menormalkan kinerja selama enam bulan, pada 11 Maret 2026 pada saat penulisan | Sumber: Share Trader
Konsensus analis: Beli
Menurut data TradingView, Baker Hughes dikategorikan sebagai Strong Buy. Berdasarkan 25 analis yang memberikan peringkat selama tiga bulan terakhir, 16 menilai saham Strong Buy, 3 menilai itu Beli, 4 menilai itu Hold, 1 menilai Sell dan 1 menilai Strong Sell.
Secara keseluruhan, sentimen broker terhadap Baker Hughes secara luas positif, dengan lebih dari tiga perempat analis penutupan menilai saham baik Strong Buy atau Buy, sementara sebagian besar sisanya berada di Hold. Pandangan analis yang mendukung itu tampaknya mencerminkan paparan BKR terhadap layanan ladang minyak tradisional dan pasar teknologi energi dan industri yang lebih luas, termasuk infrastruktur LNG.
Peringkat analis Baker Hughes dan target harga, per 11 Maret 2026 pada saat penulisan | Sumber: TradingView
5. Energi Woodside (ASX: WDS)
Woodside Energy memberikan daftar produsen yang berbasis di Australia dengan eksposur signifikan ke pasar LNG dan minyak. Pendapatannya terkait erat dengan harga komoditas yang direalisasikan, yang membuat saham sensitif terhadap perubahan harga minyak mentah dan gas, serta permintaan energi global yang lebih luas.
Dibandingkan dengan beberapa nama energi AS yang lebih besar, sentimen broker terhadap Woodside tampak lebih terukur. Investor menyeimbangkan eksposur LNG global perusahaan dan leverage terhadap harga energi yang lebih kuat terhadap harga realisasi baru-baru ini yang lebih lunak, risiko proyek dan eksekusi, serta tekanan regulasi dan dekarbonisasi jangka panjang.
Konsensus analis: Tahan
Menurut data TradingView, Woodside dinilai Neutral/Hold. Dari 15 analis, 2 menilai itu Strong Buy, 4 menilai Beli, 7 menilai Hold, 1 menilai Sell dan 1 menilai Strong Sell.
Target harga rata-rata 12 bulan adalah A $29.20 versus harga saat ini sekitar A $30.28, menyiratkan penurunan sekitar 3.6%. Dibandingkan dengan nama energi AS yang lebih besar dalam daftar ini, itu menunjukkan pandangan broker yang lebih hati-hati.
Peringkat analis Woodside Energy dan target harga, per 11 Maret 2026 pada saat penulisan | Sumber: TradingView
6. Operator tanker minyak global
Perusahaan tanker minyak dapat memperoleh manfaat ketika harga minyak yang lebih kencang, perubahan kebijakan OPEC+ dan ketegangan geopolitik meningkatkan pengiriman jarak jauh dan mengganggu rute perdagangan biasa. Ketika volume minyak bergerak lebih jauh, permintaan 'tonne-mil' dapat mendukung tarif harian kapal tanker dan profitabilitas bahkan ketika pasar energi yang lebih luas tidak stabil.
Konsensus analis: N/A
Ini adalah kategori industri yang lebih luas daripada satu saham yang diperdagangkan secara publik, jadi tidak ada konsensus broker tunggal untuk dikutip. Pandangan analis perlu dinilai di tingkat perusahaan, seperti Frontline plc (FRO), Euronav (EURN) atau Scorpio Tankers (STNG).
Secara lebih luas, sektor ini bersifat siklus. Manfaat apa pun dari pasar pengiriman yang lebih ketat dapat berbalik jika rute menjadi normal, tarif pengiriman turun atau pasokan meningkat.
Risiko dan kendala
Harga minyak yang lebih tinggi tidak menghilangkan risiko untuk nama-nama ini.
Jika harga naik terlalu jauh, terlalu cepat, penghancuran permintaan dan respons kebijakan dapat membebani pendapatan di masa depan.
Keputusan politik dari OPEC+ atau produsen utama lainnya dapat membalikkan reli dengan meningkatkan pasokan.
Perusahaan jasa dan kapal tanker sangat siklis. Ketika siklus berubah, daya penetapan harga dapat memudar dengan cepat.
Masalah khusus perusahaan, termasuk pelaksanaan proyek, penetapan harga realisasi dan pengeluaran modal, masih penting.
Secara keseluruhan, nama-nama ini mungkin mendapat manfaat dari harga minyak yang lebih kuat, tetapi mereka juga membawa risiko spesifik sektor, geopolitik, dan tingkat perusahaan yang patut mendapat perhatian ketat.
Pengamatan pasar utama
Woodside menyediakan eksposur LNG dan minyak, meskipun sentimen broker saat ini lebih netral daripada untuk nama-nama AS yang lebih besar.
Operator kapal tanker mungkin mendapat manfaat ketika pasar angkutan mengencang, meskipun perdagangan itu tetap sangat siklis dan bergantung pada rute.
SLB dan Baker Hughes mungkin mendapat manfaat jika harga minyak yang lebih kuat diterjemahkan ke dalam lebih banyak kegiatan pengeboran dan penyelesaian, tetapi respons harga saham beragam.
Exxon Mobil dan Chevron menawarkan eksposur langsung ke margin hulu yang lebih kuat, didukung oleh diversifikasi operasi.
Referensi dalam artikel ini untuk Exxon Mobil, Chevron, SLB, Baker Hughes, Woodside, operator tanker, peringkat konsensus analis dan target harga disertakan hanya untuk komentar pasar umum dan bukan merupakan rekomendasi atau penawaran sehubungan dengan produk keuangan atau keamanan apa pun. Data pihak ketiga, termasuk peringkat konsensus dan harga target, dapat berubah tanpa pemberitahuan dan tidak boleh diandalkan secara terpisah. Eksposur energi dan pengiriman bersifat siklus dan dapat dipengaruhi secara material oleh volatilitas harga komoditas, penetapan harga yang direalisasikan, perubahan produksi, pelaksanaan proyek, gangguan geopolitik, kondisi pasar pengiriman, perkembangan peraturan, dan pergeseran sentimen investor. Setiap pandangan tentang calon penerima manfaat dari harga minyak yang lebih tinggi tunduk pada ketidakpastian yang signifikan.
Sebelum grafik mulai berbicara, wilayah melakukannya. Selama akhir pekan, Timur Tengah beralih dari tegang ke kinetik. Serangan gabungan AS dan Israel menghantam target di dalam Iran, dan beberapa outlet melaporkan Pemimpin Tertinggi Iran Ayatollah Ali Khamenei tewas. Fakta tunggal itu mengubah keseluruhan struktur kalimat pasar dan bukan hanya geopolitik, itu adalah premi risiko yang dihargai ulang secara real time, lintas energi, volatilitas, dan prospek pertumbuhan global.
Pasar tidak memperdagangkan tragedi, melainkan memperdagangkan ketidakpastian. Ketika ketidakpastian berada di atas arteri energi global, penemuan harga menurun.
Sekilas
Apa yang terjadi: Beberapa media besar melaporkan bahwa Pemimpin Tertinggi Iran Ayatollah Ali Khamenei tewas setelah serangan gabungan AS dan Israel di Iran, dengan media pemerintah Iran dikutip mengkonfirmasi kematiannya.
Apa yang mungkin difokuskan pasar sekarang: Penetapan harga ulang premia risiko geopolitik yang bergerak cepat, dipimpin oleh produk minyak mentah dan olahan, ditambah volatilitas lintas aset sebagai berita utama mendorong likuiditas, korelasi, dan rentang intraday.
Apa yang belum terjadi: Pasar mungkin menetapkan harga lebih dari premi risiko utama daripada gangguan pasokan fisik yang sepenuhnya terbukti dan berkelanjutan.
24 hingga 72 jam berikutnya: Fokus kemungkinan akan tetap pada sinyal eskalasi dan kendala tingkat kedua, termasuk dampak apa pun pada rute pelayaran Teluk dan kebijakan dan jalur diplomatik, termasuk dinamika Dewan Keamanan PBB.
Pengait Australia dan Asia: Gangguan penerbangan dan wilayah udara sudah meluas ke luar wilayah. Untuk pasar, sensitivitas yang menghadapi Asia dapat muncul melalui margin kilang dan biaya pengiriman dan asuransi, sementara AUD dapat berperilaku sebagai barometer risiko ketika selera risiko global tidak stabil.
Minyak adalah mekanisme transmisi
Minyak mentah Brent melonjak sebanyak 13% pada awal perdagangan pada Senin 2 Maret, menyentuh sekitar US $82 per barel dalam pelaporan, karena risiko Selat Hormuz bergerak dari teori ke langsung. Selat itu penting karena kira-kira seperlima pengiriman minyak dan gas global melewatinya dan ketika kapal tanker ragu, perusahaan asuransi memberi harga ulang, dan rute ditulis ulang, energi menjadi produk volatilitas.
Kasus dasar: gangguan parsional dan “premi risiko” yang lebih tinggi dalam minyak mentah, dengan perubahan intraday yang besar. Risiko naik: Perlambatan pengiriman berkelanjutan atau infrastruktur langsung, yang diperingatkan oleh beberapa analis dapat mendorong minyak mentah lebih tinggi secara material. Risiko penurunan: berita utama de-eskalasi, tanggapan pasokan darurat, atau perlindungan pengiriman yang lebih jelas yang menekan premi risiko.
VIX tidak bergerak dalam ruang hampa, dan lonjakan ketidakpastian ini sudah tumpah ke kelas aset lain dengan cara yang cukup 'buku teks'. Ketika volatilitas harga kembali, naluri pertama pasar adalah pelarian ke tempat yang aman, di samping perebutan komoditas yang paling terpapar konflik.
Senin melihat Asia dibuka dengan nada itu: Nikkei 225 Jepang dilaporkan turun sekitar 2.4%, dan ASX 200 Australia turun sebelum stabil. Pada saat yang sama, posisi defensif muncul di tempat aman klasik. Emas berjangka melemah lebih tinggi sekitar 3% selama akhir pekan, sementara mata uang perlindungan tradisional, yang dipimpin oleh franc Swiss, menarik arus masuk langsung terhadap euro dan dolar AS.
Risiko ekuitas, sebaliknya, mendapat pukulan. Indeks berjangka AS, termasuk Dow dan S&P 500, dibuka lebih rendah karena bursa bergerak ke harga dalam ancaman ganda konflik regional yang lebih luas dan hambatan inflasi yang dapat mengikuti lonjakan tajam dalam biaya energi.
Tempat berlindung yang aman melakukan apa yang mereka lakukan
Emas menguat seiring pasar mencapai asuransi. Pelaporan menunjukkan emas naik mendekati 3% pada sesi Senin yang sama ketika minyak melonjak. Perlu diperhatikan bagi pedagang Australia dan Asia: ketika minyak melonjak dan emas melonjak bersama, pasar sering memberi tahu Anda bahwa mereka khawatir tentang inflasi dan pertumbuhan. Itu adalah campuran yang berantakan untuk bank sentral, termasuk RBA, karena inflasi yang didorong oleh minyak dapat meningkat bahkan ketika permintaan melunak.
Apa artinya ini untuk manajemen risiko CFD
Fokus 1: memetakan kalender risiko acara
Di pasar yang digerakkan oleh headline, harga dapat bergerak lebih cepat daripada likuiditas. Risikonya bukan hanya salah; itu juga bisa menjadi risiko waktu dan eksekusi dalam kondisi yang tidak stabil.
Beberapa pedagang memantau perkembangan mana yang mungkin mengubah sentimen pasar (misalnya, pernyataan resmi atau pembaruan operasional terverifikasi). Jika Anda memilih untuk berdagang, mungkin ada baiknya memahami bagaimana kesenjangan harga dan volatilitas dapat memengaruhi posisi Anda, termasuk di sekitar sesi pembukaan dan pengumuman besar.
Pasar dapat mengalami gap atau bergerak cepat, dan eksekusi order (termasuk stop order, jika digunakan) mungkin tidak terjadi pada tingkat yang diharapkan, terutama dalam kondisi cepat atau likuiditas rendah. Fitur dan hasil tergantung pada syarat produk dan kondisi pasar.
Fokus 2: perhatikan jalur energi ke inflasi
Jika minyak mentah tetap tinggi, pasar mungkin melihat apakah ekspektasi inflasi bergeser. Jika itu terjadi, itu dapat mempengaruhi suku bunga, ekuitas dan FX dan meskipun hasilnya bergantung pada beberapa faktor dan dapat berubah dengan cepat.
Itu mungkin tercermin dalam:
Imbal hasil obligasi global, seiring dengan penyesuaian pasar suku bunga.
Sensitivitas penilaian ekuitas, terutama di area durasi panjang dan pertumbuhan berat.
FX bergerak, termasuk di seluruh dolar Australia, yen Jepang, dan beberapa mata uang terkait komoditas.
Asia starts the week with a fresh geopolitical shock that is already being framed in oil terms, not just security terms. The first-order move may be a repricing of risk premia and volatility across energy and macro, while markets wait to see whether this becomes a durable physical disruption or a fast-fading headline premium.
At a glance
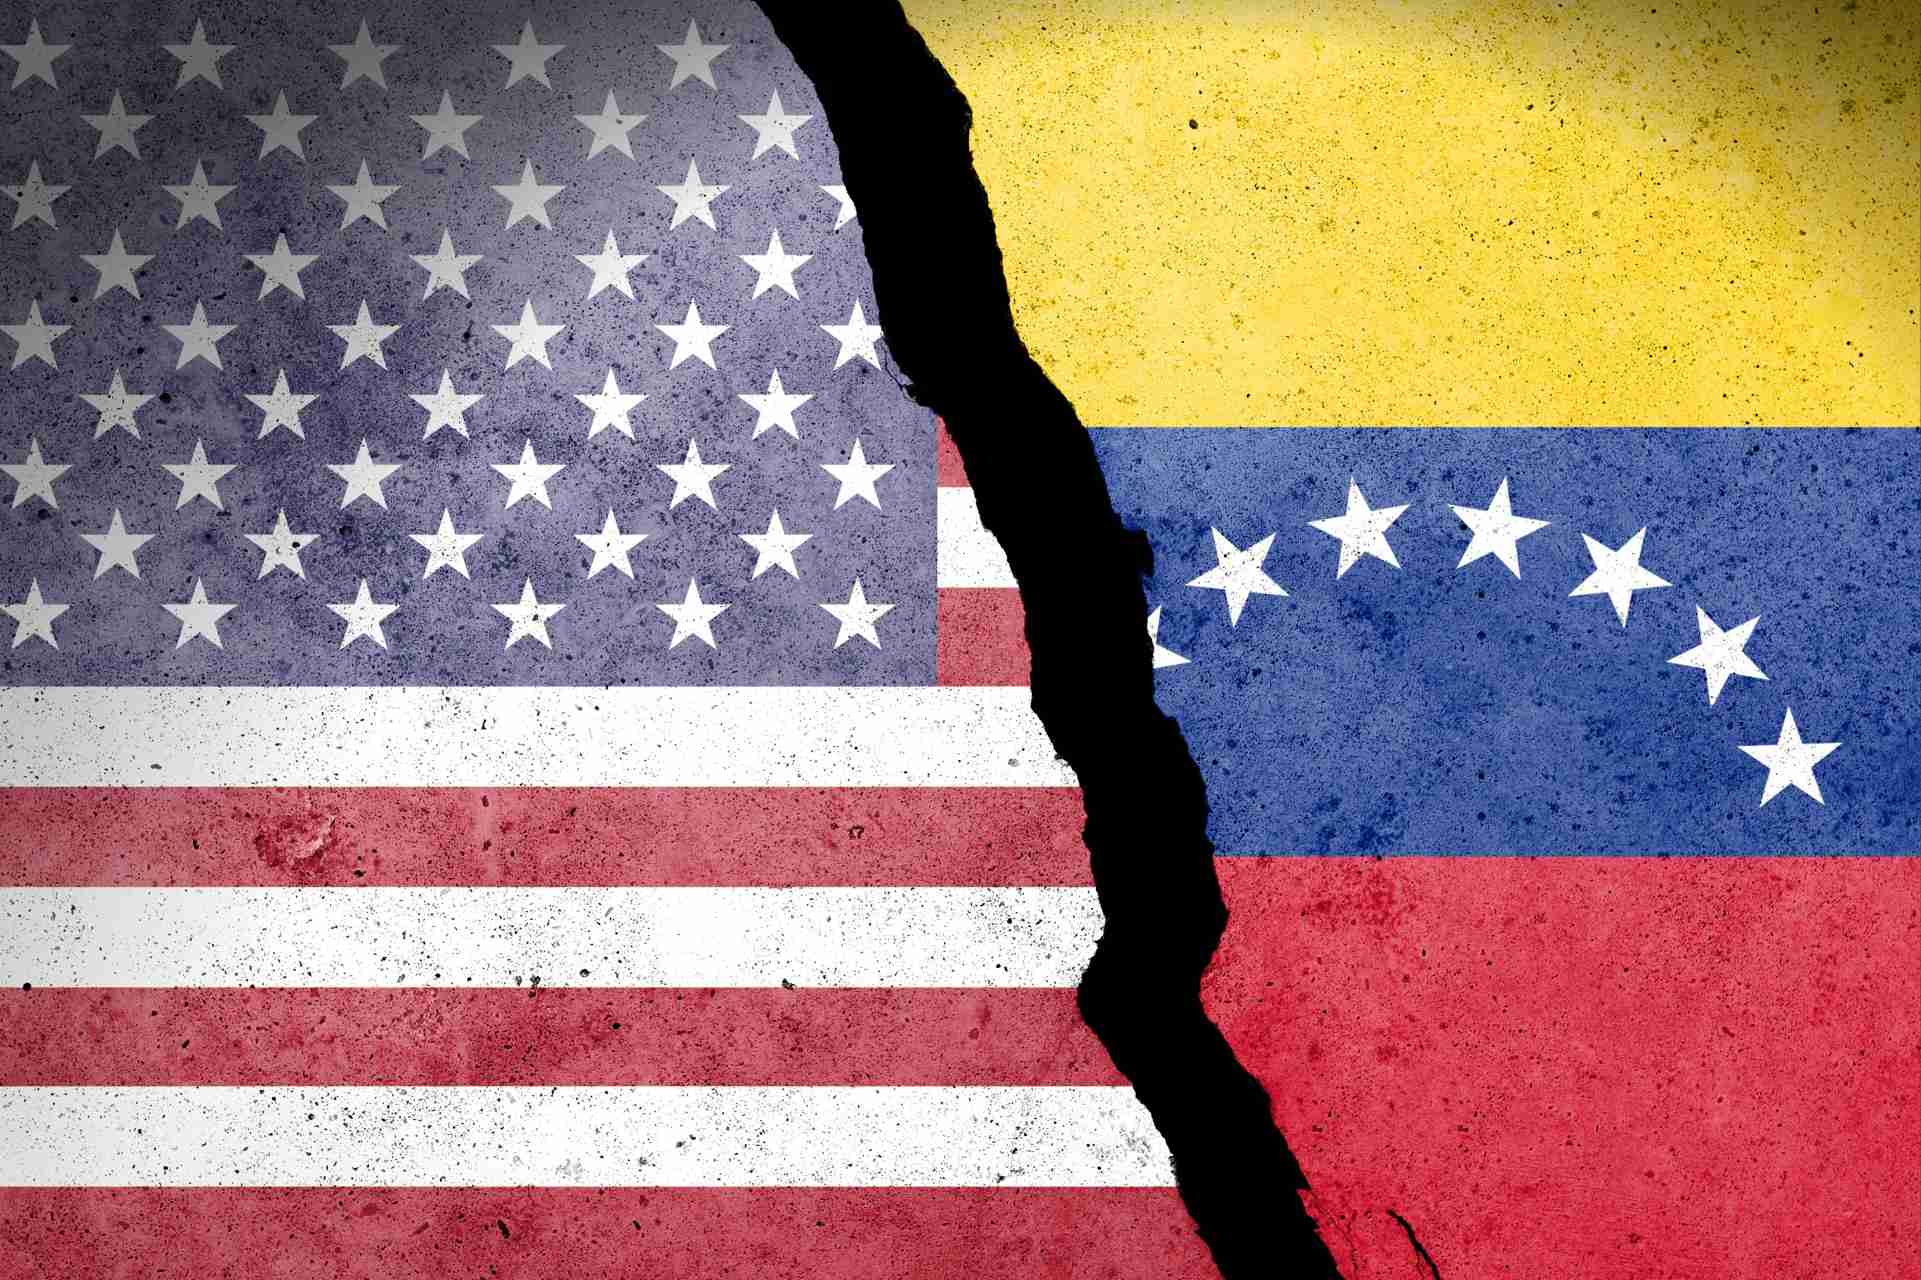
What happened: US officials said the US carried out “Operation Absolute Resolve”, including strikes around Caracas, and that Venezuela’s President Nicolás Maduro and his wife were taken into US custody and flown to the United States (subject to ongoing verification against the cited reporting).
What markets may focus on now: Headline-driven risk premia and volatility, especially in products and heavy-crude-sensitive spreads, rather than a clean “missing barrels” shock.
What is not happening yet: Early pricing has so far looked more like a headline risk premium than a confirmed physical supply shock, though this can change quickly, with analysts pointing to ample global supply as a possible cap on sustained upside.
Next 24 to 72 hours: Market participants are likely to focus on the shape of the oil “quarantine”, the UN track, and whether this stays “one and done” or becomes open-ended.
Australia and Asia hook: AUD as a risk barometer, Asia refinery margins in diesel and heavy, and shipping and insurance where the price can show up in friction before it shows up in benchmarks.
What happened, facts fast
Before anyone had time to workshop the talking points, there were strikes, there was a raid, and there was a custody transfer. US officials say the operation culminated in Maduro and his wife being flown to the United States, where court proceedings are expected.
Then came the line that turned a foreign policy story into a markets story. President Trump publicly suggested the US would “run” Venezuela for now, explicitly tying the mission to oil.
Almost immediately after that came a message-discipline correction. Secretary of State Marco Rubio said the US would not govern Venezuela day to day, but would press for changes through an oil “quarantine” or blockade.
That tension, between maximalist presidential rhetoric and a more bureaucratically describable “quarantine”, is where the uncertainty lives. Uncertainty is what gets priced first.
Source: Adobe images
Why this is price relevant now
What’s new versus known for positioning
What’s new, and price relevant, is that the scale and outcome are not incremental. A major military operation, a claimed removal of Venezuela’s leadership from the country, and a US-led custody transfer are not the sort of things markets can safely treat as noise.
Second, the oil framing is explicit. Even if you assume the language gets sanded down later, the stated lever is petroleum. Flows, enforcement, and pressure via exports.
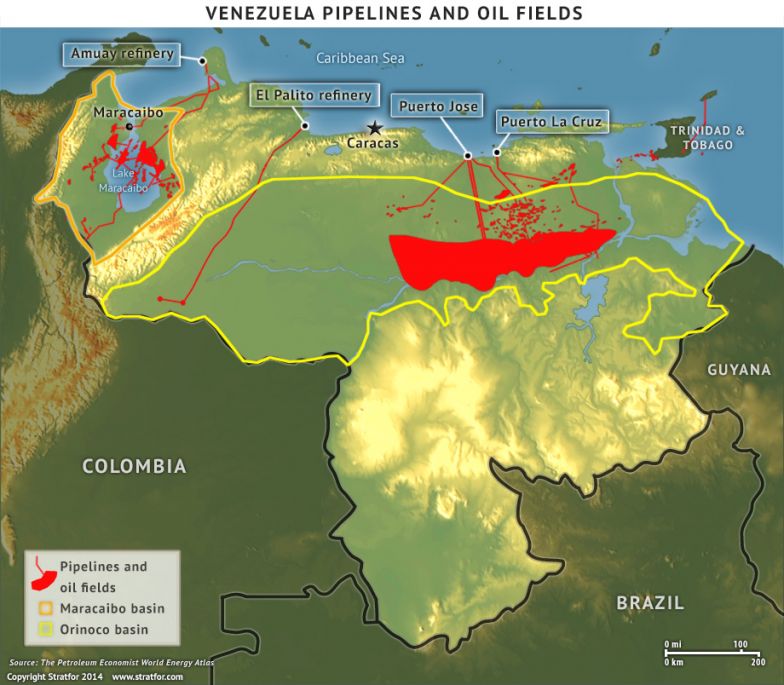
Third, the embargo is not just a talking point anymore. Reporting says PDVSA has begun asking some joint ventures to cut output because exports have been halted and storage is tightening, with heavy-crude and diluent constraints featuring prominently.
What’s still unknown, and where volatility comes from
Key unknowns include how strict enforcement is on water, what exemptions look like in practice, how stable the on-the-ground situation is, and which countries recognise what comes next. Those are not philosophical questions. Those are the inputs for whether this is a temporary risk premium or a durable regime shift.
Political and legal reaction, why this drives tail risk
The fastest way to understand the tail here is to watch who calls this illegal, and who calls it effective, then ask what those camps can actually do.
Internationally, reaction has been fast, with emphasis on international law and the UN Charter from key partners, and UN processes in view. In the US, lawmakers and commentators have begun debating the legal basis, including questions of authority and war powers. That matters for markets because it helps define whether this is a finite operation with an aftershock, or the opening chapter of a rolling policy regime that keeps generating headlines.
Market mechanism, the core “so what”
Here’s the key thing about oil shocks. Sometimes the headline is the shock. Sometimes the plumbing is the shock.
Venezuela’s heavy-crude system: Orinoco production, key pipelines, and export/refining bottlenecks.
Volumes and cushion
Venezuela is not the world’s swing producer. Its production is meaningful at the margin, but not enough by itself to imply “the world runs out of oil tomorrow”. The risk is not just volume. It is duration, disruption, and friction.
The market’s mental brake is spare capacity and the broader supply backdrop. Reporting over the weekend pointed to ample global supply as a likely cap on sustained gains, even as prices respond to risk.
Quality and transmission
Venezuela’s barrels are disproportionately extra heavy, and extra heavy crude is not just “oil”. It is oil that often needs diluent or condensate to move and process. That is exactly the kind of constraint that shows up as grade-specific tightness and product effects.
Reporting has highlighted diluent constraints and storage pressure as exports stall. Translation: even if Brent stays relatively civil, watch cracks, diesel and distillates, and any signals that “heavy substitution” is getting expensive.
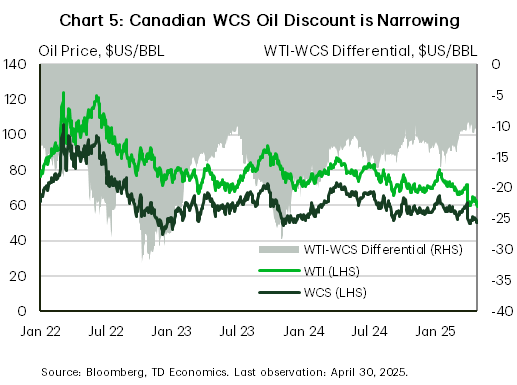
Heavy-light spread as a stress gauge: rising differentials can signal costly substitution and tighter heavy supply.
Products transmission, volatility first, pump later
If crude is the headline, products are the receipt, because products tell you what refiners can actually do with the crude they can actually get. The short-run pattern is usually: futures reprice risk fast, implied volatility pops; physical flows adapt more slowly; retail follows with a lag, and often with less drama than the first weekend of commentary promised.
For Australia and Asia desks, the bigger point is transmission. Energy moves can influence inflation expectations, which can feed into rates pricing and the dollar, and in turn affect Asia FX and broader risk, though the links are not mechanical and can vary by regime.
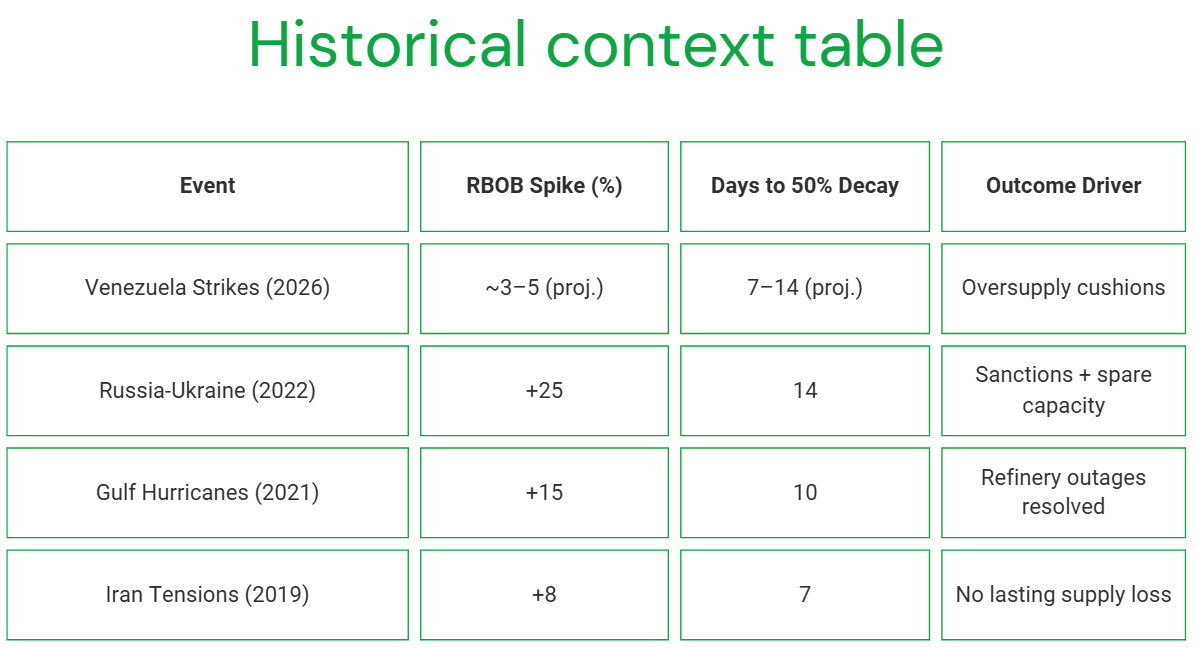
Some market participants also monitor refined-product benchmarks, including gasoline contracts such as reformulated gasoline blendstock, as part of that chain rather than as a stand-alone signal.
Historical context, the two patterns that matter
Two patterns matter more than any single episode.
Pattern A: scare premium. Big headline, limited lasting outage. A spike, then a fade as the market decides the plumbing still works.
Pattern B: structural. Real barrels are lost or restrictions lock in; the forward curve reprices; the premium migrates from front-month drama to whole-curve reality.
One commonly observed pattern is that when it is only premium, volatility tends to spike more than price. When it is structural, levels and time spreads move more durably.
The three possible market reactions
Contained, rhetorical: quarantine exists but porous; diplomacy churns; no second-wave actions. Premium bleeds out; volatility mean-reverts.
Escalation, prolonged control risk: “not governing” language loses credibility; repeated operations; allies fracture further. Longer-duration premium; broader risk-off impulse across FX and rates.
Australia and Asia angle
For Sydney, Singapore, and Hong Kong screens, this is less about Venezuelan retail politics and more about how a Western Hemisphere intervention bleeds into Asia pricing.
AUD is the quick and dirty risk proxy. Asia refiners care about the kind of oil and the friction cost. Heavy crude plus diluent dependency makes substitution non-trivial. If enforcement looks aggressive, the “price” can show up in freight, insurance, and spreads before it shows up in headline Brent.
Catalyst calendar, key developments markets may monitor
US policy detail: quarantine rules, enforcement posture, exemptions.
UN and allies: statements that signal whether this becomes a long legitimacy fight.
Saham pertahanan ASX kembali ke daftar pantauan dan menurut Stockholm International Peace Research Institute (SIPRI), pengeluaran militer global mencapai sekitar US$2,718 triliun pada 2024, naik 9,4% secara riil.
Pengaturan pertahanan Australia saat ini ditetapkan dalam Strategi Pertahanan Nasional 2024 dan dokumen perencanaan investasi terkait, yang menguraikan prioritas pendanaan kemampuan jangka panjang. Selain itu, Canberra telah menunjuk investasi kemampuan A$330 miliar hingga 2034, termasuk dana tambahan untuk kombatan permukaan, kesiapsiagaan, serangan jarak jauh dan sistem otonom.
Inilah bagian yang kebanyakan orang lewatkan: tidak semua saham pertahanan ASX adalah perdagangan yang sama. Beberapa duduk dekat dengan pembuatan kapal angkatan laut. Beberapa adalah nama kontra-drone dan beberapa adalah operator yang lebih kecil dan berisiko lebih tinggi di mana satu kontrak mungkin jauh lebih penting daripada yang diasumsikan pasar.
Kelima nama ini bukan daftar beli, melainkan daftar pantauan praktis bagi investor yang mencoba memahami di mana momentum pengadaan sebenarnya muncul di ASX.
1) Australia (ASX: ASB)
Austal adalah salah satu perusahaan yang terdaftar di ASX yang paling langsung terkena pipa pembuatan kapal angkatan laut Australia, meskipun pelaksanaan kontrak, margin, dan waktu pengiriman tetap menjadi variabel penting.
Mereka tidak hanya memenangkan kontrak acak; mereka telah menandatangani perjanjian hukum besar-besaran (Perjanjian Pembuatan Kapal Strategis) yang menjadikan mereka mitra resmi untuk membangun generasi berikutnya kapal militer menengah Australia di Australia Barat.
Pada Februari 2026, pemerintah memberi Austal lampu hijau pada proyek senilai $4 miliar. Ini bukan hanya untuk satu kapal, ini untuk 8 kapal “Landing Craft Heavy”. Ini adalah kapal pengangkut besar (panjang sekitar 100 meter) yang dirancang untuk membawa tank berat dan peralatan langsung ke pantai. Tapi inilah bagian yang kebanyakan orang lewatkan, pembuatan kapal adalah maraton, bukan sprint.
Seperti yang Anda lihat di garis waktu pengiriman, sementara konstruksi dimulai pada tahun 2026, kapal terakhir tidak akan dikirim sampai 2038. Bagi seorang investor, ini berarti Austal memiliki aliran pendapatan “terjamin” selama 12 tahun ke depan, tetapi mereka harus sangat pandai mengelola biaya mereka selama periode yang lama untuk benar-benar menghasilkan keuntungan.
2) DroneShield (ASX: DRO)
Jika Anda telah melihat rekaman drone kecil yang mengganggu medan perang modern, DroneShield sedang membangun bagian dari “sakelar mati”. Fokusnya adalah teknologi kontra-drone, termasuk sistem yang mendeteksi, mengganggu atau mengalahkan drone menggunakan perang elektronik, sensor, dan alat yang dipimpin perangkat lunak, daripada hanya mengandalkan amunisi tradisional.
Pada awal 2026, DroneShield telah bergerak melampaui label start-up yang menjanjikan dan ke fase komersial yang jauh lebih besar. Ini melaporkan pendapatan FY2025 sebesar A $216.5 juta, naik 276% dari FY2024, dan mengatakan memulai FY2026 dengan pendapatan berkomitmen A $103.5 juta.
Satu hal yang mungkin diabaikan pasar adalah lapisan perangkat lunak dalam model. DroneShield melaporkan pendapatan Software as a Service (SaaS) sebesar A$11.6 juta pada FY2025 dan mengatakan sedang bekerja menuju SaaS yang menghasilkan 30% dari pendapatan dalam lima tahun. Model berlangganannya mencakup pembaruan perangkat lunak untuk sistem yang digunakan, yang menambahkan aliran pendapatan berulang yang berkembang di samping penjualan perangkat keras.
Di antara saham pertahanan ASX, DroneShield adalah salah satu cara paling langsung untuk mengikuti tema Counter-UAS. Ini juga salah satu nama di mana sentimen dapat berayun dengan cepat, karena cerita pertumbuhan dapat berubah kembali ke atas dan ke bawah ketika waktu pesanan berubah.
EOS membangun “otak” dan “otot” untuk platform militer. Hal ini terkenal karena sistem senjata jarak jauh, yang memungkinkan operator untuk mengontrol menara bersenjata dari dalam kendaraan yang dilindungi, dan untuk sistem laser berenergi tinggi yang ditujukan untuk pertahanan kontra-drone. EOS mengatakan backlog tanpa syarat mencapai sekitar A$459,1 juta pada awal 2026, menyusul serangkaian kemenangan kontrak hingga 2025. Itu menunjukkan basis pekerjaan yang aman yang jauh lebih besar, meskipun waktu pengiriman dan konversi pendapatan masih penting.
EOS menandatangani kontrak senilai €71,4 juta, sekitar A$125 juta, dengan pelanggan Eropa untuk sistem senjata laser energi tinggi 100 kilowatt. EOS mengatakan sistem ini dirancang untuk biaya rendah per bidikan dan dapat melibatkan hingga 20 drone per menit. Pemerintah Australia telah menyisihkan 1,3 miliar dolar Australia selama 10 tahun untuk akuisisi kemampuan kontra-drone, dan EOS telah mengungkapkan bahwa mereka adalah bagian dari tim tawaran LAND 156 yang sukses. Itu tidak menjamin pendapatan di masa depan, tetapi mendukung visibilitas jangka menengah di pasar yang sudah ditargetkan perusahaan.
EOS dibaca sebagai cerita rebound, tetapi yang masih bergantung pada eksekusi. Perusahaan telah berorientasi ulang di sekitar sistem senjata jarak jauh, sistem kontra-drone dan laser, semua area terkait dengan pengeluaran pertahanan yang lebih kuat. Pertanyaan kuncinya adalah apakah ia dapat terus mengubah backlog dan pipeline menjadi pendapatan yang disampaikan sambil mempertahankan disiplin neraca.
4) Kode (ASX: CDA)
Codan terkadang ditinggalkan dari daftar saham pertahanan biasa karena lebih beragam. Itu mungkin kekeliruan. Dalam hasil H1 FY26, Codan mengatakan bisnis Komunikasi merancang komunikasi penting untuk pasar keamanan militer dan publik global. Pendapatan komunikasi naik 19% menjadi A $221,8 juta. Perusahaan juga mengatakan DTC menghasilkan pertumbuhan yang kuat dari permintaan pertahanan dan sistem tak berawak, dengan pendapatan sistem tak berawak naik 68% menjadi A$73 juta. Codan mengatakan sekitar setengah dari pendapatan tak berawak itu terkait dengan aplikasi pertahanan operasional di zona konflik.
Di sinilah cerita menjadi lebih bernuansa. Dalam sekeranjang saham pertahanan ASX, Codan dapat menawarkan profil yang berbeda, dengan sensitivitas judul yang kurang murni, diversifikasi operasi yang lebih luas dan paparan yang berarti terhadap komunikasi militer dan sistem tak berawak tanpa menjadi nama tema tunggal. Diversifikasi itu juga dapat berarti saham tidak selalu diperdagangkan seperti nama pertahanan murni.
HighCom berada di akhir spekulatif daftar ini, dan harus diberi label seperti itu. Perusahaan mengatakan dua bisnisnya yang berkelanjutan adalah HighCom Armor, yang memasok perlindungan balistik, dan HighCom Technology, yang memasok dan memelihara sistem udara kecil dan menengah tanpa awak, sistem udara tanpa awak, dan rekayasa terkait, integrasi, pemeliharaan dan dukungan logistik untuk ADF dan militer regional yang selaras lainnya.
Di H1 FY26, pendapatan dari operasi berkelanjutan turun 59% menjadi A $10,9 juta, sementara EBITDA bergerak ke kerugian A $5.4 juta dari laba A$1.9 juta tahun sebelumnya. HighCom juga mengungkapkan pendapatan A$5,1 juta dalam HighCom Technology, termasuk A$3,5 juta dari suku cadang sistem udara kecil tanpa awak (SUAS) dan A $1,6 juta dari layanan keberlanjutan yang diberikan kepada Departemen Pertahanan Australia.
Jadi ya, HighCom adalah salah satu saham pertahanan ASX yang lebih sensitif secara finansial di dewan direksi. Tapi itu juga jenis nama yang lebih kecil yang dapat menunjukkan bagaimana pengadaan menyaring ke dalam peralatan pendukung, keberlanjutan, dan perlindungan spesialis.
Pengamatan pasar utama
Lacak tonggak program, bukan hanya berita utama politik. Penghargaan kontrak, produksi dimulai, jadwal pengiriman, dan pekerjaan pemeliharaan sering kali lebih penting dari satu hari pengumuman.
Pisahkan eksposur permainan murni dari eksposur yang beragam. DroneShield dan EOS lebih dekat dengan tema teknologi pertahanan terkonsentrasi, sementara Codan membawa paparan komunikasi dalam bauran bisnis yang lebih luas.
Tonton tema kemampuan kedaulatan di Australia. Austal dan EOS terkait dengan manufaktur lokal, integrasi, dan rantai pasokan Australia, yang mendukung tema kemampuan kedaulatan yang lebih luas dalam grup ini.
Perhatikan neraca dan konversi tunai. Momentum pengadaan bisa menjadi nyata bahkan ketika waktu menjadi berantakan. Setengah terakhir HighCom adalah pengingat akan hal itu.
Berita utama pertahanan bisa terlihat langsung. Penghasilan biasanya tidak. Pekerjaan angkatan laut utama Austal membentang hingga dekade berikutnya. Kontrak EOS dikirimkan selama beberapa tahun. Aliran pesanan DroneShield tampak kuat, tetapi perusahaan masih memisahkan pendapatan berkomitmen dari peluang pipeline yang lebih luas. HighCom menunjukkan sisi lain dari koin. Paparan pengadaan tidak secara otomatis diterjemahkan ke dalam eksekusi keuangan yang lancar.
Referensi ke saham pertahanan yang terdaftar di ASX hanya informasi umum, bukan rekomendasi untuk membeli, menjual, atau memegang sekuritas atau CFD apa pun. Saham-saham ini bisa sangat fluktuatif dan sensitif terhadap waktu kontrak, kebijakan pemerintah, geopolitik, risiko eksekusi, dan kondisi pasar. Backlog, pipeline, dan ekspektasi pendapatan bukanlah jaminan kinerja masa depan.
Siap untuk berdagang di luar mata uang utama? Buka akun · Masuk
Tiga bank sentral menentukan suku bunga secara bersamaan, minyak mentah Brent berayun liar di sekitar US $100 per barel, dan perang di Timur Tengah menulis ulang prospek inflasi secara real time. Apa pun yang terjadi minggu ini dapat mengatur nada pasar untuk sisa tahun 2026.
Fakta singkat
Bank Cadangan Australia (RBA) mengumumkan keputusan suku bunga tunai berikutnya pada hari Selasa, dengan pasar sekarang menetapkan peluang 66% untuk kenaikan kedua menjadi 4,1%.
Beberapa analis telah memperingatkan perang Iran dapat mendorong inflasi AS menjadi 3,5% pada akhir tahun dan menunda penurunan suku bunga Fed hingga September, menjadikan plot dot FOMC minggu ini yang paling diawasi ketat dalam beberapa tahun.
Minyak mentah Brent menggoda US$100 per barel setelah Iran meluncurkan apa yang digambarkan media pemerintah sebagai “operasi paling intens sejak awal perang.”
RBA: Akankah Australia naik lagi?
RBA menaikkan suku bunga tunai untuk pertama kalinya dalam dua tahun menjadi 3,85% pada pertemuan Februari setelah inflasi meningkat secara material pada paruh kedua tahun 2025.
Pertanyaannya sekarang adalah apakah itu bergerak lagi bahkan sebelum melihat cetakan CPI kuartalan berikutnya, yang tidak akan jatuh tempo sampai 29 April.
Wakil Gubernur Andrew Hauser mengakui menjelang pertemuan bahwa pembuat kebijakan menghadapi keputusan yang benar-benar terpecah, dibentuk oleh sinyal ekonomi yang saling bertentangan di dalam negeri dan meningkatnya ketidakstabilan di luar negeri.
Pasar keuangan saat ini menetapkan sekitar 66% probabilitas untuk kenaikan lain, dengan kenaikan Mei dianggap hampir pasti terlepas dari apa yang terjadi pada hari Senin.
Tanggal utama
Keputusan Suku Bunga RBA: Selasa, 17 Maret, 14:30 AEDT
FOMC: Kemungkinan besar, semua mata tertuju pada plot titik
FOMC bertemu pada 17-18 Maret, dengan pernyataan kebijakan dijadwalkan pukul 14:00 ET pada 18 Maret dan konferensi pers Ketua Jerome Powell pada pukul 14:30. CME FedWatch menunjukkan probabilitas 99% bahwa Fed mempertahankan suku bunga pada 3,50% hingga 3,75%.
Tindakan sebenarnya ada di Ringkasan Proyeksi Ekonomi (SEP) dan plot titik. Titik median saat ini menunjukkan satu potongan 25-titik basis untuk 2026. Jika bergeser ke dua pemotongan, itu dovish dan bullish untuk aset berisiko. Jika bergeser ke nol pemotongan atau menambahkan kenaikan suku bunga ke dalam proyeksi, pasar dapat bereaksi ke arah lain.
Lebih lanjut memperumit masalah, masa jabatan Powell sebagai Ketua Federal Reserve berakhir pada 23 Mei 2026. Kevin Warsh adalah kandidat utama untuk menggantikannya, dipandang lebih hawkish dalam kebijakan moneter. Setiap komentar dari Powell tentang transisi ini dapat menggerakkan pasar secara independen dari keputusan suku bunga itu sendiri.
Tanggal Kunci
Keputusan Suku Bunga FOMC+Plot Sep/DOT: Kamis 19 Maret, 4:00 pagi AEDT
Konferensi pers Powell: Kamis 19 Maret, 4:30 pagi AEDT
Memantau
Bahasa Powell tentang minyak dan inflasi tarif.
Reaksi imbal hasil Treasury 2 tahun.
Harga ulang CME FedWatch untuk setiap perubahan dalam probabilitas pemotongan September.
Bank of Japan: Pengetatan lebih lanjut bisa dilakukan
BOJ bertemu pada 18-19 Maret, dengan keputusan yang diharapkan Kamis pagi waktu Tokyo. Suku bunga kebijakan saat ini berada di 0.75% (tertinggi 30 tahun), dan pertemuan Januari 2026 menghasilkan penahanan dalam suara 8-1.
Gubernur Ueda telah mengkategorikan pertemuan Maret sebagai “langsung,” mencatat jadwal untuk pengetatan lebih lanjut dapat “dibawa ke depan” jika negosiasi upah musim semi Shunto menghasilkan hasil yang lebih kuat dari perkiraan.
Hasil-hasil tersebut akan mulai mengalir selama seminggu, menjadikannya masukan penting untuk keputusan BOJ. Nomura memperkirakan kenaikan upah Shunto pada 2026 akan mencapai sekitar 5,0%, termasuk senioritas, dengan pertumbuhan gaji pokok sekitar 3,4%. Jika hasil mengkonfirmasi lintasan itu, kasus untuk kenaikan bulan Maret menguat secara signifikan.
Komplikasinya adalah latar belakang global. Jepang mengimpor sekitar 90% dari kebutuhan energinya, dan minyak sekitar US $100 per barel mendorong kenaikan biaya impor dan mengancam akan menambah tekanan inflasi. Kenaikan BOJ ke guncangan minyak global akan menjadi langkah yang luar biasa berani.
Sebagian besar pelaku pasar masih condong ke arah penahanan pada pertemuan ini, dengan April atau Juli dipandang sebagai waktu yang lebih mungkin untuk langkah berikutnya.
Tanggal Kunci
Keputusan Suku Bunga Kebijakan BOJ (saat ini 0,75%): Kamis 19 Maret, pagi AEDT
Memantau
Hasil upah Shunto sebagai pemicu utama kenaikan bulan Maret.
Bahasa konferensi pers Ueda dan panduan ke depan pada bulan April dan Juli.
Minyak mentah Brent sempat menyentuh US$119,50 per barel pada awal pekan sebelum turun 17% menjadi di bawah US $80, kemudian rebound menuju US $95 di tengah sinyal beragam dari Washington tentang Selat Hormuz.
Pada hari Kamis, Brent kembali lebih dari US $100 karena Iran melancarkan serangan baru terhadap pengiriman komersial dan rilis cadangan IEA gagal membawa bantuan yang berarti.
Dalam skenario di mana konflik yang lebih lama menyebabkan kerusakan pada infrastruktur energi, analis memperkirakan CPI dapat naik menjadi 3,5% pada akhir 2026, dengan harga bensin mendekati US $5 per galon pada kuartal kedua.
Untuk minggu ini, minyak bertindak sebagai meta-variabel makro. Setiap berita geopolitik, sinyal gencatan senjata, serangan tanker, pelepasan cadangan, dan komentar Trump dapat menggerakkan ekuitas, obligasi, dan mata uang secara real time.
Memantau
Setiap aliran tanker Selat Hormuz yang dilanjutkan.
Serangan AS-Israel terhadap Iran yang diluncurkan pada 28 Februari membuat minyak mentah Brent melonjak melewati US $119 per barel, emas di atas US $5.200, dan stok pertahanan ke level tertinggi sepanjang masa.
Dengan latar belakang itu, investor fokus pada sekelompok kecil nama terkait komoditas yang mungkin tetap sensitif terhadap pergerakan lebih lanjut dalam minyak, LNG dan emas. Pertanyaan kuncinya adalah apakah guncangan terbukti berkelanjutan, atau apakah gencatan senjata, normalisasi pengiriman, atau tindakan kebijakan menghilangkan sebagian dari premi risiko geopolitik.
1. Exxon Mobil (NYSE: XOM)
ExxonMobil telah menjadi salah satu penerima manfaat paling jelas dari lonjakan harga. Saham mencapai rekor tertinggi US$159,60 pada awal Maret dan naik sekitar 28% tahun-ke-saat ini.
Perusahaan memproduksi 4,7 juta barel setara minyak per hari, memiliki titik impas Permian Basin sekitar US $35/barel, dan berkomitmen untuk pembelian kembali US$20 miliar untuk tahun 2026.
Wells Fargo menaikkan target harga menjadi US$183 dari US$156 menyusul eskalasi, sementara konsensus analis yang lebih luas berada di sekitar US$140-$144. Namun, XOM sudah diperdagangkan di atas banyak target konsensus, dan gangguan terhadap mitra LNG-nya QatarEnergy menimbulkan hambatan operasional jangka pendek.
Apa yang harus ditonton
Apakah gangguan Hormuz bertahan lebih dari 4-6 minggu.
Rilis cadangan darurat G7 atau gencatan senjata yang kredibel dapat menekan premi risiko perang.
Setiap penyesuaian terhadap target konsensus analis.
Chevron menyentuh level tertinggi 52 minggu baru di US$196,76 pada awal Maret dan telah meningkat sekitar 24% tahun-ke-saat ini.
Impas Brent perusahaan untuk dividen dan belanja modal berada di sekitar US $50/barel. Ini berarti bahwa pada harga Minyak saat ini di atas US $90, itu menghasilkan arus kas bebas yang signifikan.
Namun, Chevron telah menghentikan sementara operasi di ladang gas di lepas pantai Israel menyusul aktivitas rudal di wilayah tersebut, dan stok telah turun lebih dari 1% karena konflik secara langsung mempengaruhi operasinya.
Apa yang harus ditonton
Pembaruan operasional langsung dari aset Timur Tengah dan Israel Chevron.
Penghentian lebih lanjut yang dapat membebani produksi jangka pendek.
Minyak mentah bertahan di atas US $90, yang membuat Chevron menghasilkan arus kas bebas yang signifikan.
3. Energi Woodside (ASX: WDS/NYSE: WDS)
Dengan Qatar menghentikan produksi setelah serangan drone Iran, pembeli di seluruh Asia dan Eropa berebut pasokan alternatif. Woodside, sebagai salah satu produsen dan eksportir LNG terbesar di Australia, berada di luar zona konflik dan berada di posisi yang baik untuk mendapatkan keuntungan dari permintaan yang dialihkan.
Analis memperingatkan bahwa substitusi aktual membutuhkan waktu karena kendala pengiriman dan kontrak, yang berarti kenaikan harga mungkin lebih tahan lama daripada perdagangan spot sederhana. Harga gas acuan TTF Eropa melonjak lebih dari 50% dalam seminggu, memperkuat lingkungan margin untuk produsen LNG non-Timur Tengah.
Apa yang harus ditonton
Kecepatan dan garis waktu memulai kembali produksi LNG Qatar.
Jika QatarEnergy tetap offline selama berminggu-minggu, Woodside dapat mulai mengontrak kembali pembeli Eropa dengan harga spot yang lebih tinggi.
Pergerakan dolar Australia yang lebih tinggi bisa menjadi hambatan yang layak dilacak untuk pendapatan dalam denominasi USD.
4. Energi Cheniere (NYSE: LNG)
Bersama Woodside, Cheniere adalah penerima manfaat paling langsung AS dari gangguan LNG Qatar. Sebagai pengekspor LNG terbesar di Amerika Serikat, ia melihat kekuatan intraday pada awal minggu konflik.
Produksi energi domestik AS telah menyangga konsumen Amerika dari kejutan terburuk, tetapi premi ekspor telah melebar karena pembeli Eropa dan Asia membayar untuk pasokan non-Teluk.
Perdagangan ini “sensitif secara geopolitik,” dan resolusi apa pun dapat membalikkan kenaikan dengan cepat. Tetapi selama Hormuz dan infrastruktur gas Teluk tetap terganggu, Cheniere diposisikan untuk mendapat manfaat secara struktural.
Apa yang harus ditonton
Setiap terobosan diplomatik yang membuka kembali jalur pelayaran Teluk.
Pengumuman kontrak offtake jangka panjang baru yang ditandatangani dengan harga tinggi saat ini.
Emas melonjak 5,2% dalam satu sesi pada 1 Maret, menyentuh US $5.246/oz, karena pasar mencari aset safe-haven. Newmont, produsen emas terbesar di dunia, telah melihat cadangannya secara efektif dinilai kembali pada harga ini.
Ini naik bersamaan dengan kenaikan 24% dari tahun ke hari ini, dan biaya pelestarian keseluruhannya sebagian besar tetap tetap.
Namun, penambang emas terjual tajam pada 4 Maret, dan Newmont turun hampir 8% dalam satu sesi karena deleveraging risiko yang lebih luas mengenai ekuitas logam mulia.
Saham telah pulih sejak itu, tetapi volatilitas tetap tinggi. Untuk investor jangka panjang, analis mencatat bahwa yurisdiksi pertambangan “aman” seperti Kanada, Australia, dan Nevada memerintahkan premi baru karena ketidakstabilan Timur Tengah meningkatkan nilai pasokan yang aman secara geopolitik.
Apa yang harus ditonton
Apakah emas dapat bertahan di atas US $5.000/oz.
Konflik yang berkepanjangan dapat mempercepat siklus M&A di penambang emas junior.
Gencatan senjata atau peristiwa deleveraging ekuitas yang luas sebagai risiko utama untuk dipantau.
Lockheed Martin mencapai level tertinggi baru sepanjang masa sebesar US$676,70 pada 3 Maret, naik lebih dari 4% untuk hari itu. Pesawat tempur F-35, amunisi berpemandu presisi, sistem THAAD, dan artileri roket HIMARS adalah pusat kampanye udara yang sedang berlangsung.
Departemen Pertahanan AS bergerak untuk mengisi kembali stok amunisi, dan ambisi Trump yang dinyatakan untuk meningkatkan anggaran pertahanan AS menjadi US $1,5 triliun pada tahun 2027 menambah angin struktural jangka panjang di luar konflik langsung.
Saham pertahanan naik di tengah penetapan harga risiko geopolitik klasik, tetapi investor harus mencatat bahwa arus kontrak aktual membutuhkan waktu untuk diterjemahkan ke dalam pendapatan, dan valuasi sudah mencerminkan optimisme yang cukup besar.
Apa yang harus ditonton
Laju pesanan pengisian amunisi Departemen Pertahanan AS.
Seberapa cepat kemenangan kontrak diterjemahkan ke dalam pertumbuhan backlog.
Barrick melacak pergerakan emas bersejarah bersama Newmont, dengan saham naik tajam dari tahun ke saat ini. Perusahaan ini berada pada kapitalisasi pasar sekitar US$78 miliar dan melaporkan rekor proyeksi arus kas bebas karena biaya pelestarian keseluruhan tetap jauh di bawah harga spot saat ini.
Seperti Newmont, ia mengalami aksi jual satu sesi yang tajam lebih dari 8% selama peristiwa deleveraging 4 Maret yang lebih luas, sebelum pulih sebagian.
Perusahaan royalti dan streaming seperti Wheaton Precious Metals (WPM) disukai oleh beberapa investor sebagai cara yang lebih dilindungi inflasi untuk mengakses kenaikan emas, mengingat eksposur biaya operasional mereka yang lebih rendah. Namun Barrick tetap menjadi salah satu penambang emas terbesar yang terdaftar di dunia, dengan pendapatan yang sangat sensitif terhadap perubahan harga emas
Apa yang harus ditonton
Kemampuan emas bertahan di atas US $5,000/oz.
Setiap Barrick bergerak menuju akuisisi penambang junior.
Inflasi biaya energi, karena kenaikan harga bahan bakar dapat mulai menekan margin operasi penambang.