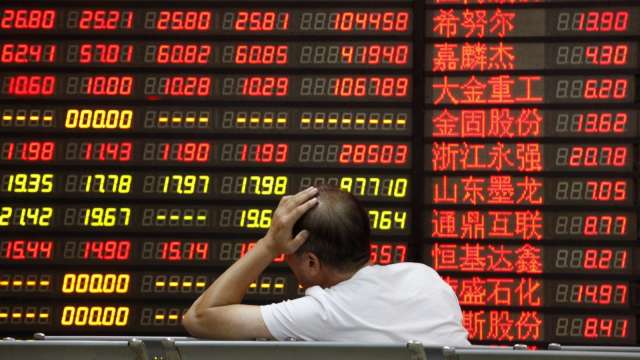
热门话题近期AI 人工智能的话题火热,在Chatgpt 4上线后,人们逐渐发现,这一代的AI开始出现了逻辑性甚至是一些的推理性。那么今天就和大家聊一聊AI的摩尔定律和目前发展的情况。
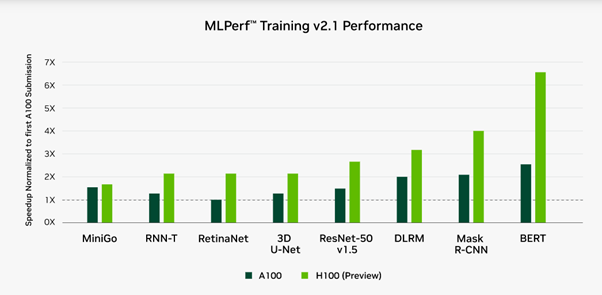
首先和大家简单阐述一下什么是摩尔定律。摩尔定律(Moore's Law)是在1965年由英特尔公司的联合创始人戈登·摩尔提出的观察结果,它预测了半导体集成电路的性能每18到24个月就会翻倍。这一预测在过去几十年中持续成立,使得计算机硬件性能以惊人的速度增长。那么在今年已经开始出现3nm的芯片消息,预计在明年年初将会投入使用,那么对标2020年底的5nm芯片,时间也正好对的上。那么和硬件能力息息相关的AI是不是也会完全遵守摩尔定律呢?这个问题目前来说众说纷纭。比较火热的就是之前OpenAI的 CEO Sam Altman在社交媒体上发布的一段话,AI的摩尔定律将要出现,称全球人工智能运算量每隔18个月翻一番。当然,以个人理性的判断来说,这个具体的数字并不是非常绝对的,因为AI的进步不仅仅只是取决于硬件或者说算力的进步,还是会包括但不限于算法的改进、数据可用性以及计算资源可用性的增加。这些因素都在推动AI的发展,但它们并不受摩尔定律的直接影响。因此,想要描述其AI的进步,可能会考虑的是数据的增长(比如网络数据的指数增长)和算法的改进(比如深度学习等技术的发展)。那么我们由此来简单剖析一下目前的AI训练的情况如何。在前几年,AI的训练还是会花费几天甚至是数周的时间,于是在数十亿的投资之后,各种新兴计算公司接踵而至,包括其中包括Cerebras Systems、Graphcore、Habana Labs以及SambaNova Systems等。此外,Google、Intel、Nvidia等已经建立的公司也进行了类似规模的内部投资。近期新版的MLPerf训练基准测试结果的出炉后,证明了这些投资是很值得的。自从MLPerf基准测试开始以来,AI训练性能的提升“显著超过了摩尔定律”,首先解释下什么是MLPerf。MLPerf是一个行业标准的基准测试,旨在为机器学习(Machine Learning)硬件、软件和服务提供公正、可比较的性能评估。
MLPerf包含了多个任务子类别,从计算机视觉、自然语言处理到推荐系统等,它涵盖了各种常见的机器学习模型和应用场景。MLPerf有两个主要类别的基准测试:训练(Training)和推断(Inference)。MLPerf Training基准测试专注于衡量机器学习模型的训练性能。这包括衡量所需的时间和计算资源来训练一个模型达到预定的质量标准。这个基准测试在多种模型和任务上进行,如图像分类、对象检测、语言模型训练等。说回MLperf测试结果,在之前2021年测试版本中,芯片的迭代和早期对比有两倍的提升。但是软件的改进加上计算器处理架构的进步,速度的提升来到了6-11倍。根据Nvidia的说法,使用A100 GPUs的系统性能在过去的18个月中已经增加了5倍以上,近2.5年增长了近7倍,而在最初的MLPerf基准测试三年前,性能已经增加了20倍。有数据可见,AI的发展速度其实和诸多因素有着关联,然后再近18个月来,其提升速度远超于之前的好几年。
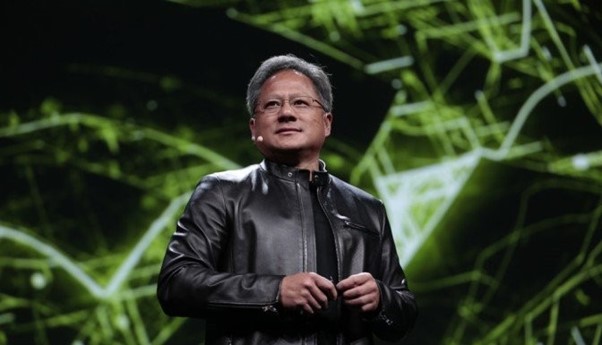
(Source:NVIDIA)在今年年初,英伟达和CEO老黄表示,AI的发展可以克服摩尔定律的逐渐消亡。人工智能的进步可以推动芯片等的性能的提升。老黄解释道:目前的AI行业已经经历了几个重要的发展阶段。第一个阶段是开发人工智能所需的芯片、软件库和系统。这一阶段从2017年之后,发展快到难以想象。第二个阶段包括对感知(如视觉和语音识别)的突破。目前这个阶段已经趋于成熟,感知也开始走向拟人化。目前的阶段是建立智能能力,比如理解世界发生的事情。有逻辑性的推测,对已发生事物的分析和未来的预测。最后一个阶段将是AI软件和现实世界结合起来,用于诸如工厂自动化等事物。日前AI发展的速度远超我们大家的想象,像英伟达,Intel,AMD,Google,微软,亚马逊等占据巨大数据资源加上先进半导体科技技术的公司绝对是关注的重点。像英伟达在近6个月上涨了接近83%,AMD也有39%的上涨。
笔者曾在去年有写过,在半导体的争端之下,各个大型的半导体公司将会有不俗的发展,而今年的赛道不仅仅只是半导体等硬件,或是软件端的竞争,AI人工智能也加入了战局,传统型思维很有可能在近年被打破,无论是生活还是投资也将可能面临大的变革,我们拭目以待。免责声明:GO Markets分析师或外部发言人提供的信息基于其独立分析或个人经验。所表达的观点或交易风格仅代表其个人;并不代表GO Markets的观点或立场。联系方式:墨尔本 03 8658 0603悉尼 02 9188 0418中国地区(中文) 400 120 8537中国地区(英文) +248 4 671 903作者:Neo Yuan | GO Markets 分析师

The information provided is of general nature only and does not take into account your personal objectives, financial situations or needs. Before acting on any information provided, you should consider whether the information is suitable for you and your personal circumstances and if necessary, seek appropriate professional advice. All opinions, conclusions, forecasts or recommendations are reasonably held at the time of compilation but are subject to change without notice. Past performance is not an indication of future performance. Go Markets Pty Ltd, ABN 85 081 864 039, AFSL 254963 is a CFD issuer, and trading carries significant risks and is not suitable for everyone. You do not own or have any interest in the rights to the underlying assets. You should consider the appropriateness by reviewing our TMD, FSG, PDS and other CFD legal documents to ensure you understand the risks before you invest in CFDs. 免责声明:文章来自 GO Markets 分析师和参与者,基于他们的独立分析或个人经验。表达的观点、意见或交易风格仅代表作者个人,不代表 GO Markets 立场。建议,(如有),具有“普遍”性,并非基于您的个人目标、财务状况或需求。在根据建议采取行动之前,请考虑该建议(如有)对您的目标、财务状况和需求的适用程度。如果建议与购买特定金融产品有关,您应该在做出任何决定之前了解并考虑该产品的产品披露声明 (PDS) 和金融服务指南 (FSG)。