The Crucial Data is Finally Here | GO Markets Week Ahead
Mike Smith
1/12/2025
•
0 min read
Share this post
Copy URL
Markets have bounced back strongly this week. The S&P 500 is now just 1.5% from record highs, and the Nasdaq is recovering well following its pullback.
Rate Cut Expectations
The main driver behind this rally was a shift in Federal Reserve rate cut expectations. Markets are currently pricing in a quarter-point rate cut for December, with only a 25% chance of another reduction in January. This week's economic data will be crucial in shaping expectations going into 2026.
Key Economic Data This Week
Several important data releases are scheduled for this week. The PCE inflation data — the Fed's preferred inflation measure — for September will finally be released on Friday and could have the biggest impact on December and January rate decisions. The ADP jobs report and weekly jobless claims will also be released, while the non-farm payrolls report has been delayed again.
Global Manufacturing Snapshot
Today also kicks off a busy week of manufacturing data releases. Global PMI numbers are due across the board, including figures from the Eurozone, UK, Germany, and the US this evening. These reports will provide a critical snapshot of global economic health and could help reveal the impact of the US trade tariffs.
Gold Breaks Higher
Gold made a significant move on Friday, breaching the key $4,200 level after consolidating last week. The precious metal has followed through today, and the $4,400 level now looks achievable if buying pressure continues.
Bitcoin Under Pressure
Bitcoin has given up last week's modest gains and seen substantial selling pressure. A significant drop of about $4,000 occurred during Asian trading this morning — a notable decline for an Asia session. The key level to watch is $84,000, with potential support at $80,000 (the lowest level since March).
Market Insights
Watch Mike Smith's analysis of the week ahead in markets.
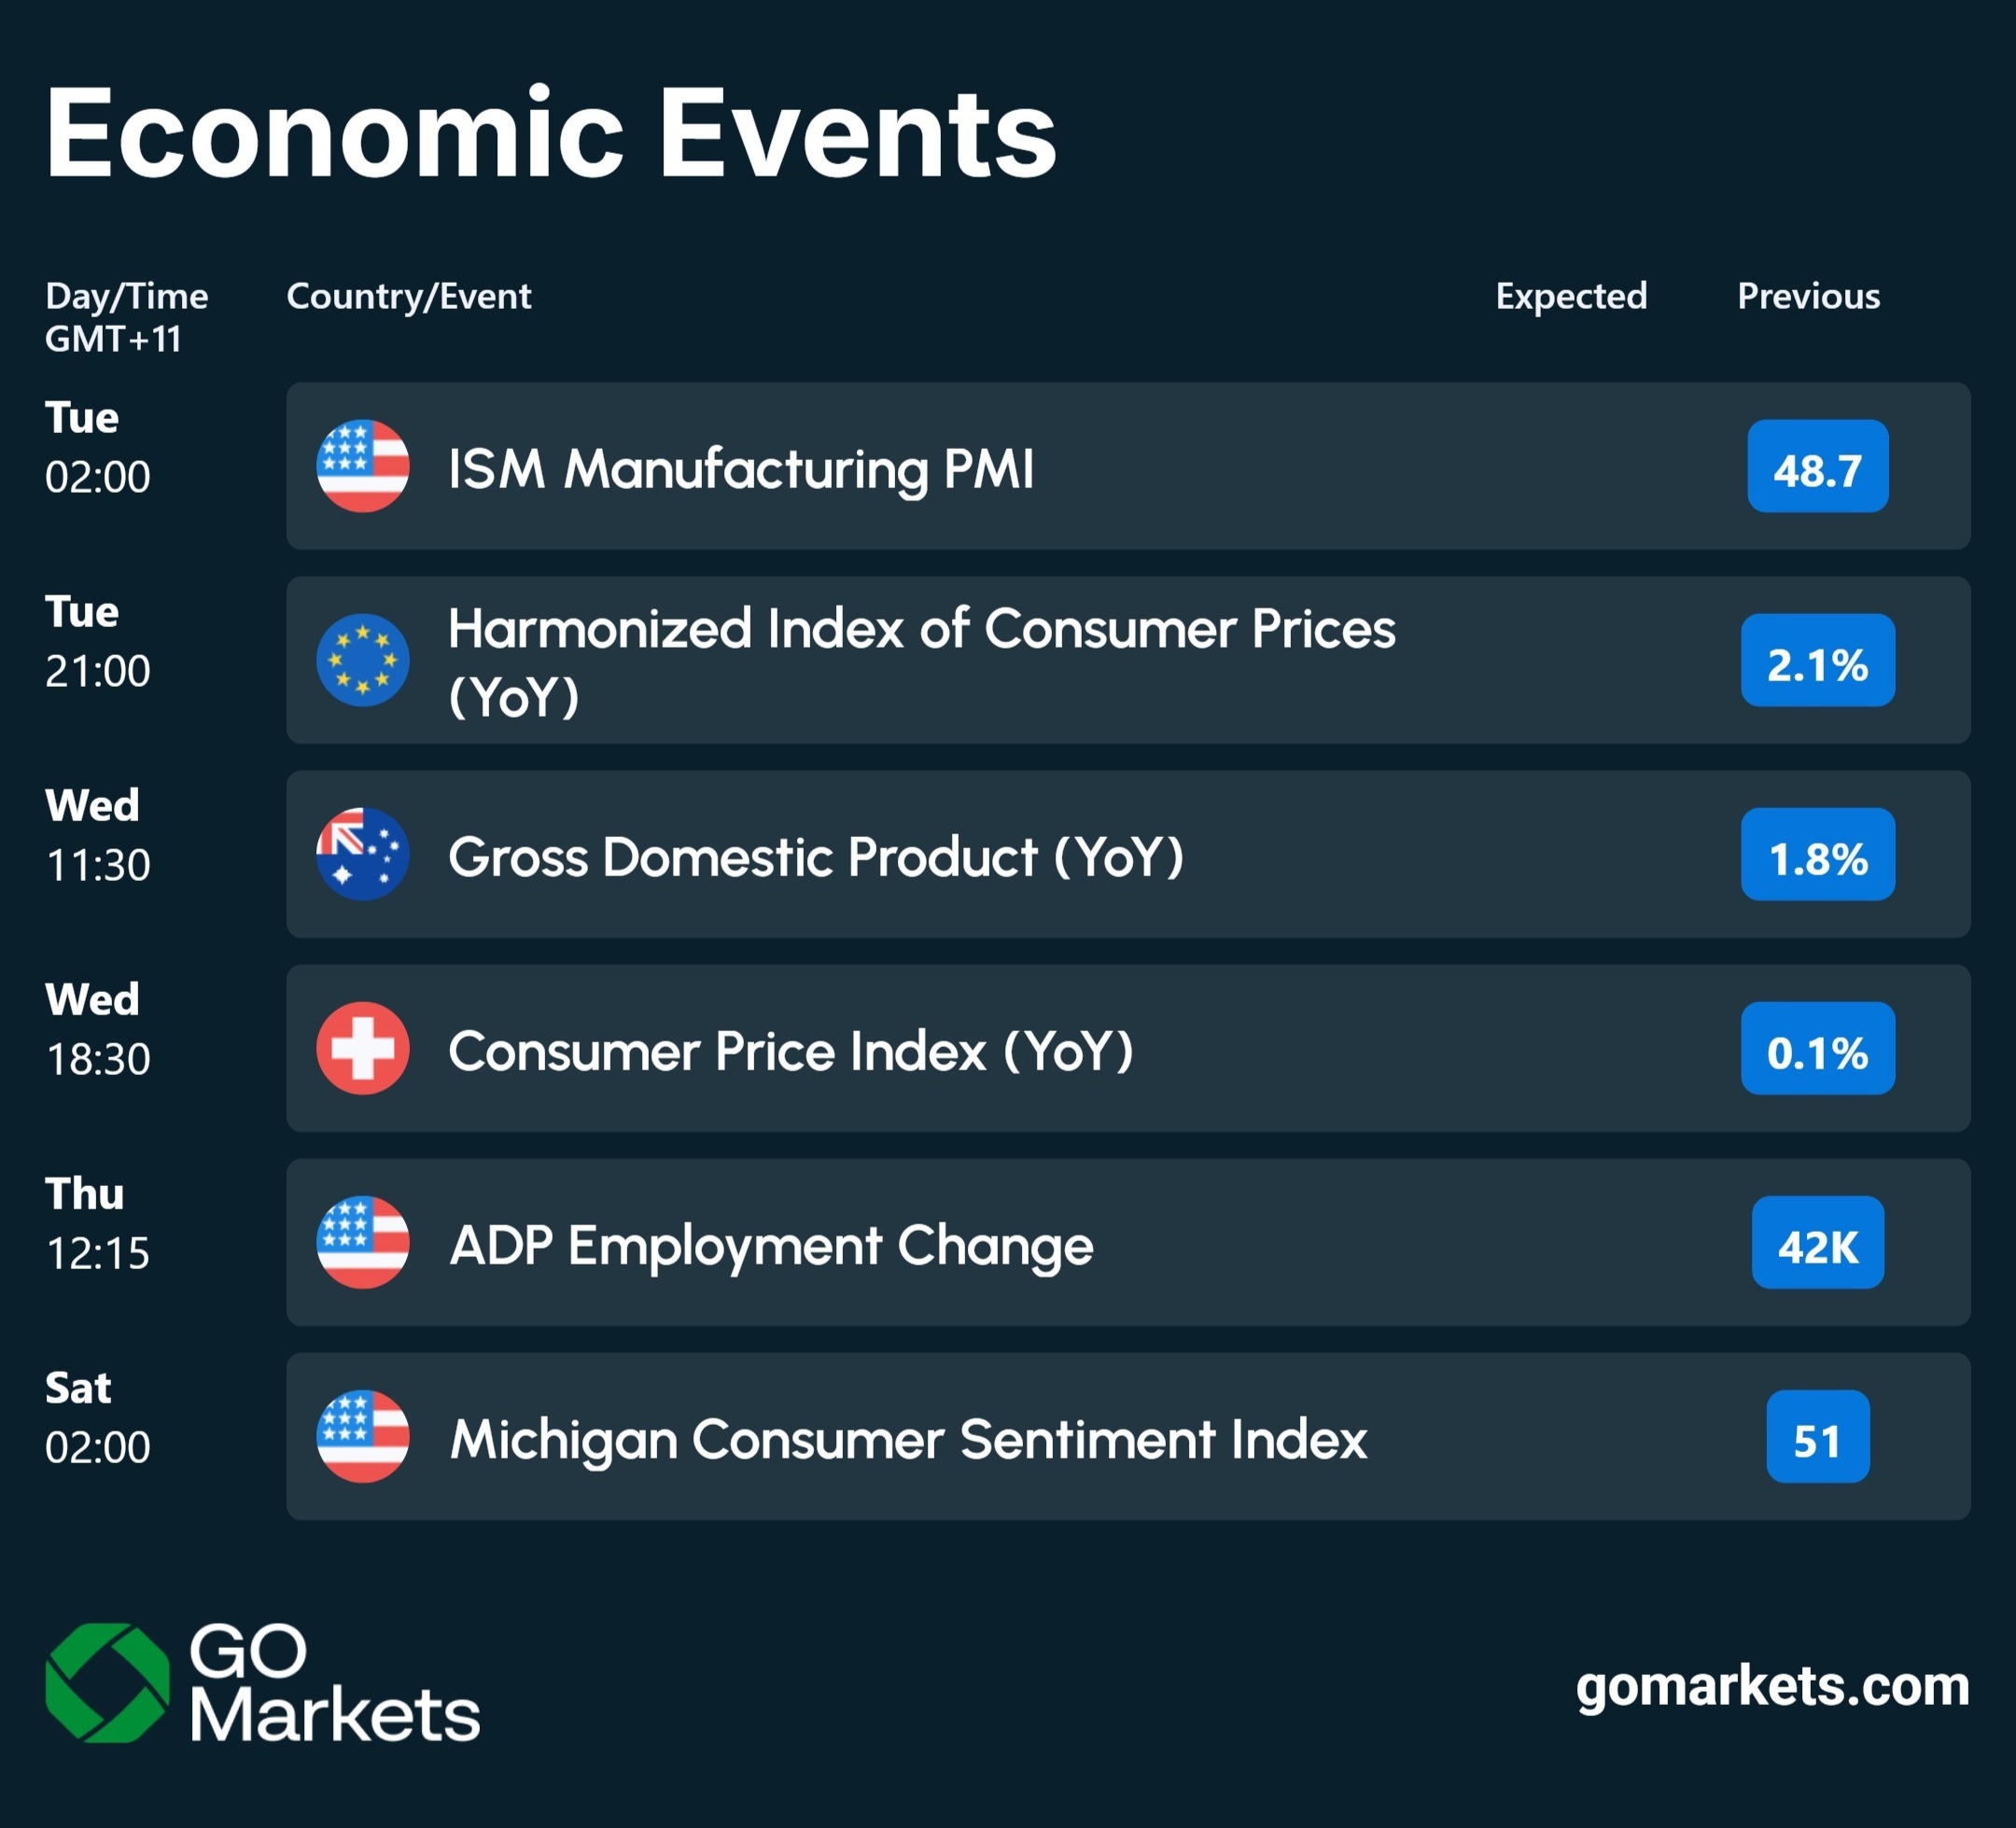
Key Economic Events
Stay up to date with the key economic events for the week.
Times in AEDT (GMT+11)
By
Mike Smith
Mike Smith (MSc, PGdipEd)
Client Education and Training
The information provided is of general nature only and does not take into account your personal objectives, financial situations or needs. Before acting on any information provided, you should consider whether the information is suitable for you and your personal circumstances and if necessary, seek appropriate professional advice. All opinions, conclusions, forecasts or recommendations are reasonably held at the time of compilation but are subject to change without notice. Past performance is not an indication of future performance. Go Markets Pty Ltd, ABN 85 081 864 039, AFSL 254963 is a CFD issuer, and trading carries significant risks and is not suitable for everyone. You do not own or have any interest in the rights to the underlying assets. You should consider the appropriateness by reviewing our TMD, FSG, PDS and other CFD legal documents to ensure you understand the risks before you invest in CFDs. These documents are available here.
免责声明:文章来自 GO Markets 分析师和参与者,基于他们的独立分析或个人经验。表达的观点、意见或交易风格仅代表作者个人,不代表 GO Markets 立场。建议,(如有),具有“普遍”性,并非基于您的个人目标、财务状况或需求。在根据建议采取行动之前,请考虑该建议(如有)对您的目标、财务状况和需求的适用程度。如果建议与购买特定金融产品有关,您应该在做出任何决定之前了解并考虑该产品的产品披露声明 (PDS) 和金融服务指南 (FSG)。
Ahead of the US nonfarm payrolls (NFP) release (Friday, 9 January, 8:30 am ET/ Saturday, 10 January, 12:30 am AEDT), major US equity indices have been trading near recent highs (as at 9 January 2026).
Next week, attention is likely to shift to inflation data, any change in expectations for Federal Reserve (Fed) policy, and the start of US earnings season. Together, these may support or challenge current valuations.
Quick facts:
US inflation: The consumer price index (CPI) and producer price index (PPI) releases will test whether inflation is showing signs of persistence.
Earnings season: Major US banks report first, providing an early read on financial conditions and whether current valuations can hold up.
Gold futures: Gold futures remain close to record levels, with US dollar (USD) moves after key data a potential swing factor.
Geopolitics: Ongoing tensions remain on the radar and could influence risk sentiment.
US inflation data: could CPI and PPI shift rate-cut expectations?
Timing:
CPI: Wednesday 14 January, 12:30 am AEDT
PPI: Thursday 15 January, 12:30 am AEDT
CPI and PPI are the major scheduled macro events for the week. The updated inflation prints across consumer and producer prices will help markets assess whether disinflation is continuing or whether inflation is showing signs of persistence.
Market impact:
A softer outcome could support risk sentiment and weigh on Treasury yields and the USD. However, reactions can vary depending on positioning and broader macro headlines, including how confidently markets price a March Fed rate cut.
A stronger-than-expected reading may pressure equities and reinforce caution in bond markets.
US earnings season begins with the banks
Timing:
JPMorgan Chase (JPM): Tuesday, 6:35 am ET
US earnings season begins with results from major banks, providing an early snapshot of financial conditions and economic momentum. Investor attention is likely to extend beyond headline earnings to guidance and management commentary.
Market impact
Strong results versus earnings per share (EPS) and revenue expectations could support sentiment, particularly within financials.
Cautious forward guidance may pressure share prices and could weigh on broader indices if it becomes a common theme.
Early bank prints can shape expectations for the wider season. Watch how the first reporters in each sector influence related stocks.
Gold futures to retest record highs?
After a recent pullback, gold futures are trading within striking distance of record highs again. The backdrop remains a mix of geopolitical uncertainty and the potential for data-driven moves in the USD.
Market impact
Continued strength could support a retest of late December highs around US$4,585.
The short-term US$4,500 area may act as a short-term technical resistance in determining whether upside momentum can hold.
Another pullback may occur if yields rise or the USD strengthens following key data releases.
All gold futures prices quoted were captured as of 9 January 2026, 10:30 am AEDT (source: TradingView).
Geopolitics remains in focus
Geopolitics remains a background market consideration, with headlines and broader policy messaging sometimes influencing risk sentiment. Markets have shown resilience to date, but sensitivity may rise if developments escalate.
Market impact
Escalation could influence energy prices, defence stocks, and hedging assets such as gold.
A cooling in the narrative may reduce volatility and allow markets to refocus on macro data and earnings.
Venezuela commands the world's largest proven oil reserves at 303 billion barrels. Yet political turmoil, global sanctions, and recent US intervention show that being the biggest isn’t always best.
Quick facts:
Venezuela holds 18% of the world's total proven oil reserves despite producing less than 1% of global consumption.
Just four countries (Venezuela, Saudi Arabia, Iran, and Canada) control over half the planet's proven reserves.
Saudi Arabia dominates crude oil production contributing to over 16% of global exports.
US shale technology has enabled America to lead in production despite ranking ninth in reserves.
Top 10 countries by proven oil reserves
1. Venezuela – 303 billion barrels
Controls 18% of global reserves, primarily extra-heavy crude in the Orinoco Belt requiring specialised refining.
Heavy crude trades $15-20 below Brent benchmarks due to high sulphur content and complex processing requirements.
Output crashed 60% from 2.5 million bpd in 2014 to less than 1.0 million bpd last year.
Approximately 80% of exports flow to China as loan repayment, with export revenues dwarfed by reserve potential.
2. Saudi Arabia – 267 billion barrels
Majority light, sweet crude oil requires minimal refining and commands premium prices, contributing to world-leading exports of $191.1 billion in 2024.
Maintains 2-3 million bpd of spare production capacity, providing market stabilisation capability during supply disruptions.
Oil comprises roughly 50% of the country’s GDP and 70% of its export earnings.
Production decisions significantly impact international oil prices due to market dominance.
Heavy Western sanctions severely limit the country’s ability to monetise and access international markets.
Production estimates vary significantly (2.5-3.8 million bpd) due to sanctions, limited transparency, and restricted international reporting.
Significant crude volumes flow to China through discount arrangements and sanctions-evading mechanisms.
Sanctions relief could rapidly boost production toward 4-5 million bpd, though domestic consumption (12th globally) reduces export potential.
4. Canada – 163 billion barrels
Approximately 97% of reserves are oil sands (bitumen) requiring steam-assisted extraction and significant upfront capital investment.
Political stability and regulatory frameworks position Canada as a secure source compared to volatile producers, with direct pipeline access to US refineries.
Supplied over 60% of U.S. crude oil imports in 2024, making Canada America's top source by far.
5. Iraq – 145 billion barrels
Decades of war and sanctions have prevented optimal field development and infrastructure modernisation.
Improved security conditions since 2017 have enabled production recovery, but pipeline attacks and aging facilities continue to constrain output.
Oil revenue comprises over 90% of government income, creating extreme fiscal vulnerability.
Exports flow primarily to China, India, and Asian buyers seeking a reliable Middle Eastern supply, with most production from super-giant southern fields near Basra.
6. United Arab Emirates – 113 billion barrels
Produces primarily medium-to-light sweet crude commanding premium prices, ranking fourth globally in export value at $87.6 billion.
Has successfully diversified its economy through tourism, finance, and trade, reducing oil's GDP share compared to Gulf peers.
Strategic location near the Strait of Hormuz and openness to international oil companies help facilitate efficient global distribution.
7. Kuwait – 101.5 billion barrels
Reserves are concentrated in aging super-giant fields like Burgan, which require enhanced recovery techniques.
Favourable geology enables extraction costs around $8-10 per barrel, with proven reserves providing 80+ years of supply at current production rates.
Oil comprises 60% of GDP and over 95% of export revenue.
8. Russia – 80 billion barrels
World's third-largest producer despite ranking eighth in reserves.
Post-2022 Western sanctions redirected crude flows from Europe to Asia, with China and India now absorbing the majority at discounted prices.
Despite export restrictions and G7 price cap at $60/barrel, it posted the second-highest global export value at $169.7 billion in 2024.
Russian Urals crude typically trades $15-30 below Brent due to quality, sanctions, and logistics, with November 2024 revenues declining to $11 billion.
9. United States – 74.4 billion barrels
The shale revolution through horizontal drilling and hydraulic fracturing has made the U.S. the world's #1 oil producer despite holding only the 9th-largest reserves.
The Permian Basin accounts for nearly 50% of production, with shale/tight oil representing 65% of total output.
Achieved net petroleum exporter status in 2020 for the first time since 1949, with crude exports growing from near-zero in 2015 to over 4 million bpd in 2024.
The U.S. government maintains a 375+ million barrel strategic reserve.
10. Libya – 48.4 billion barrels
Holds Africa's largest proven oil reserves at 48.4 billion barrels, producing light sweet crude commanding premium prices.
Rival bordering governments compete for oil revenue control, causing production to fluctuate based on political conditions.
Oil facilities face blockades, militia attacks, and political leverage tactics, preventing consistent returns.
Favourable geology enables extraction costs around $10-15 per barrel, with geographic proximity making Libya a natural supplier to European refineries.
What does this mean for oil markets?
The concentration of reserves among OPEC members (60% of the global total) ensures the organisation has continued influence over pricing, even as US shale provides a production counterweight.
Venezuela's potential return as a major exporter post-U.S. occupation could eventually ease supply constraints, though most analysts view significant production increases as years away.
Sanctions could create a situation where discounted crude seeks buyers willing to navigate compliance risks. Refiners with heavy crude processing capability may benefit from price differentials if Venezuelan barrels increase.
While reserves appear abundant, economically recoverable volumes depend on sustained high prices. If renewable adoption accelerates and demand peaks sooner than projected, stranded assets become a material risk for reserve-heavy producers.
FX markets enter the month influenced by uncertain growth momentum, inflation dynamics and central bank policy, yield sensitivity, and shifts in how markets are pricing geopolitical risk.
Quick facts:
USD remains primarily responsive to inflation data, and this may have overtaken growth as the main driver.
JPY sensitivity to potential Bank of Japan (BOJ) action remains high, creating asymmetric responses to global rate moves and policy communication.
EUR and AUD continue to trade reactively to global events and commodity price moves.
Volatility may be episodic, clustering around key data releases rather than a single sustained directional trend.
With central bank expectations still evolving into the first quarter (Q1), key releases and policy communication are likely to stay central to near-term FX pricing. In this environment, moves may cluster around scheduled events and headline risk, rather than build into a single dominant trend.
USD performance remains closely tied to inflation data and what it could mean for Federal Reserve policy expectations. Market pricing can shift quickly around CPI and labour-market outcomes, particularly where outcomes affect how investors perceive the timing and pace of any policy changes.
Jobs data and GDP numbers will be watched as gauges of growth momentum. The start of the US earnings season may also influence FX indirectly through its impact on equity performance, risk sentiment, and yield expectations, rather than acting as a direct currency driver.
Key chart: US dollar index (DXY) weekly chart
Periods of market uncertainty can support USD demand around prior support areas near 97, while the 100 region may continue to act as a reference point for resistance, including where it aligns with commonly watched moving averages (noting technical indicators can fail).
A break in either direction may reflect shifting expectations about how different central banks will respond to the next run of inflation and growth data.
Euro (EUR)
Key data and events:
CPI (Euro area HICP, Dec 2025 reference period): 19 January 2026 European Central Bank
European Central Bank (ECB) messaging on policy direction and inflation remains key. A prolonged hold is one scenario market participants continue to debate, but outcomes are likely to remain data-dependent and sensitive to changes in the growth and inflation backdrop.
The geopolitical situation in Ukraine will also remain in focus.
Key chart: EUR/USD weekly chart
Differences in likely central bank direction could support a test of the top end of the current multi-month range near 1.18. A sustained break above that level would be technically significant.
For now, price may stay range-bound until there is clearer guidance on policy direction on both sides of the Atlantic.
Japanese yen (JPY)
Key data and events:
BOJ policy decision: 22–23 January 2026 Bank of Japan
Tokyo core CPI (Ku-area of Tokyo, preliminary; Dec 2025 reference month): 23 January 2026 Statistics Bureau of Japan
What to watch:
Following the BOJ’s December rate rise, markets appear to be weighing the likelihood of further action in Q1. Whether the January meeting delivers another move remains uncertain and may depend on incoming inflation and wage signals, as well as BOJ communication.
Data released ahead of the decision may be important in shaping expectations.
Key chart: GBP/JPY daily chart
As of 7 January 2026, GBPJPY has traded around the 211.50 area, near levels last seen in 2008. Continued consolidation may suggest fresh drivers are needed to extend gains.
If the cross can’t push higher, some traders will start watching for a pullback toward 210.00, where support has shown up before. And if expectations for BOJ action build, selling could accelerate, with price potentially drifting down through those previously tested support zones and toward the more established support near 208.00.
RBA rate decision: 3 February 2026 (Monetary Policy Board meeting 2–3 February) Reserve Bank of Australia
AUD continues to behave as a proxy for global growth sentiment and commodity demand.
Stabilisation in Chinese data, firmer commodity prices, and expectations around the Reserve Bank of Australia (RBA) policy path may be providing relative support for AUD. Sensitivity to broader risk conditions remains high.
Key chart: EUR/AUD daily chart
Moves in commodity prices have coincided with a sharp fall in EURAUD since the 31 December close, breaking down out of the prior range. The next key level to the downside sits at 1.7305.
The area around 1.7305 may help indicate whether selling pressure is continuing or whether momentum is fading for now. Near-term commodity price moves are likely to remain important.
Bottom line
FX conditions this month may remain reactive, with volatility clustering around key data releases rather than a sustained directional trend. With Q1 central bank expectations still forming, price moves may be sharper around the calendar, policy communication, and geopolitical headlines.
[2] Sina Finance. (2026). Gold Prices Surge Over 64% in One Year: Reasons Explained. https://finance.sina.com.cn
[3] HSBC. (2026, January 8). Gold Could Hit $5,000 an Ounce in First Half of 2026. https://www.reuters.com/business/gold-could-hit-5000-an-ounce-first-half-2026-says-hsbc-2026-01-08/
[4] Cailian Press. (2026). Commodity Markets Enter New Era: Geopolitical Risks Become "Permanent Pricing Mechanism". https://www.cls.cn
[6] Beijing News. (2026). Central Bank Increases Gold Holdings for 14 Consecutive Months; Foreign Exchange Reserves Rise for 5 Consecutive Months. https://www.bjnews.com.cn
[7] Reuters. (2026). Gold Trading Alert: Price Crashes Nearly 1% at High Levels. https://finance.sina.com.cn
[8] Sina Finance. (2026). Global Largest Gold ETF Fund SPDR Holdings Data. https://quotes.sina.cn
[9] Sina Finance. (2026). HSBC: Spot Gold Expected to Reach $5,000 per Ounce in First Half of 2026. https://finance.sina.com.cn
[10] Sina Finance. (2026). Morgan Stanley Prediction: Gold to Rise to $4,800 in Fourth Quarter of 2026. https://finance.sina.com.cn
[11] Wall Street News. (2026). Goldman Sachs Commodities Outlook: Central Bank Gold Buying + Fed Rate Cuts, Bullish on Gold in 2026. https://wallstreetcn.com
[12] Sina Finance. (2025, December 31). Zijin Mining 2025 Net Profit Expected to Increase 59%-62%: Gold, Silver, and Copper Volume and Price All Rise. https://finance.sina.com.cn/roll/2025-12-31/doc-inhesnwn9157323.shtml
Ahead of the US nonfarm payrolls (NFP) release (Friday, 9 January, 8:30 am ET/ Saturday, 10 January, 12:30 am AEDT), major US equity indices have been trading near recent highs (as at 9 January 2026).
Next week, attention is likely to shift to inflation data, any change in expectations for Federal Reserve (Fed) policy, and the start of US earnings season. Together, these may support or challenge current valuations.
Quick facts:
US inflation: The consumer price index (CPI) and producer price index (PPI) releases will test whether inflation is showing signs of persistence.
Earnings season: Major US banks report first, providing an early read on financial conditions and whether current valuations can hold up.
Gold futures: Gold futures remain close to record levels, with US dollar (USD) moves after key data a potential swing factor.
Geopolitics: Ongoing tensions remain on the radar and could influence risk sentiment.
US inflation data: could CPI and PPI shift rate-cut expectations?
Timing:
CPI: Wednesday 14 January, 12:30 am AEDT
PPI: Thursday 15 January, 12:30 am AEDT
CPI and PPI are the major scheduled macro events for the week. The updated inflation prints across consumer and producer prices will help markets assess whether disinflation is continuing or whether inflation is showing signs of persistence.
Market impact:
A softer outcome could support risk sentiment and weigh on Treasury yields and the USD. However, reactions can vary depending on positioning and broader macro headlines, including how confidently markets price a March Fed rate cut.
A stronger-than-expected reading may pressure equities and reinforce caution in bond markets.
US earnings season begins with the banks
Timing:
JPMorgan Chase (JPM): Tuesday, 6:35 am ET
US earnings season begins with results from major banks, providing an early snapshot of financial conditions and economic momentum. Investor attention is likely to extend beyond headline earnings to guidance and management commentary.
Market impact
Strong results versus earnings per share (EPS) and revenue expectations could support sentiment, particularly within financials.
Cautious forward guidance may pressure share prices and could weigh on broader indices if it becomes a common theme.
Early bank prints can shape expectations for the wider season. Watch how the first reporters in each sector influence related stocks.
Gold futures to retest record highs?
After a recent pullback, gold futures are trading within striking distance of record highs again. The backdrop remains a mix of geopolitical uncertainty and the potential for data-driven moves in the USD.
Market impact
Continued strength could support a retest of late December highs around US$4,585.
The short-term US$4,500 area may act as a short-term technical resistance in determining whether upside momentum can hold.
Another pullback may occur if yields rise or the USD strengthens following key data releases.
All gold futures prices quoted were captured as of 9 January 2026, 10:30 am AEDT (source: TradingView).
Geopolitics remains in focus
Geopolitics remains a background market consideration, with headlines and broader policy messaging sometimes influencing risk sentiment. Markets have shown resilience to date, but sensitivity may rise if developments escalate.
Market impact
Escalation could influence energy prices, defence stocks, and hedging assets such as gold.
A cooling in the narrative may reduce volatility and allow markets to refocus on macro data and earnings.
Venezuela commands the world's largest proven oil reserves at 303 billion barrels. Yet political turmoil, global sanctions, and recent US intervention show that being the biggest isn’t always best.
Quick facts:
Venezuela holds 18% of the world's total proven oil reserves despite producing less than 1% of global consumption.
Just four countries (Venezuela, Saudi Arabia, Iran, and Canada) control over half the planet's proven reserves.
Saudi Arabia dominates crude oil production contributing to over 16% of global exports.
US shale technology has enabled America to lead in production despite ranking ninth in reserves.
Top 10 countries by proven oil reserves
1. Venezuela – 303 billion barrels
Controls 18% of global reserves, primarily extra-heavy crude in the Orinoco Belt requiring specialised refining.
Heavy crude trades $15-20 below Brent benchmarks due to high sulphur content and complex processing requirements.
Output crashed 60% from 2.5 million bpd in 2014 to less than 1.0 million bpd last year.
Approximately 80% of exports flow to China as loan repayment, with export revenues dwarfed by reserve potential.
2. Saudi Arabia – 267 billion barrels
Majority light, sweet crude oil requires minimal refining and commands premium prices, contributing to world-leading exports of $191.1 billion in 2024.
Maintains 2-3 million bpd of spare production capacity, providing market stabilisation capability during supply disruptions.
Oil comprises roughly 50% of the country’s GDP and 70% of its export earnings.
Production decisions significantly impact international oil prices due to market dominance.
Heavy Western sanctions severely limit the country’s ability to monetise and access international markets.
Production estimates vary significantly (2.5-3.8 million bpd) due to sanctions, limited transparency, and restricted international reporting.
Significant crude volumes flow to China through discount arrangements and sanctions-evading mechanisms.
Sanctions relief could rapidly boost production toward 4-5 million bpd, though domestic consumption (12th globally) reduces export potential.
4. Canada – 163 billion barrels
Approximately 97% of reserves are oil sands (bitumen) requiring steam-assisted extraction and significant upfront capital investment.
Political stability and regulatory frameworks position Canada as a secure source compared to volatile producers, with direct pipeline access to US refineries.
Supplied over 60% of U.S. crude oil imports in 2024, making Canada America's top source by far.
5. Iraq – 145 billion barrels
Decades of war and sanctions have prevented optimal field development and infrastructure modernisation.
Improved security conditions since 2017 have enabled production recovery, but pipeline attacks and aging facilities continue to constrain output.
Oil revenue comprises over 90% of government income, creating extreme fiscal vulnerability.
Exports flow primarily to China, India, and Asian buyers seeking a reliable Middle Eastern supply, with most production from super-giant southern fields near Basra.
6. United Arab Emirates – 113 billion barrels
Produces primarily medium-to-light sweet crude commanding premium prices, ranking fourth globally in export value at $87.6 billion.
Has successfully diversified its economy through tourism, finance, and trade, reducing oil's GDP share compared to Gulf peers.
Strategic location near the Strait of Hormuz and openness to international oil companies help facilitate efficient global distribution.
7. Kuwait – 101.5 billion barrels
Reserves are concentrated in aging super-giant fields like Burgan, which require enhanced recovery techniques.
Favourable geology enables extraction costs around $8-10 per barrel, with proven reserves providing 80+ years of supply at current production rates.
Oil comprises 60% of GDP and over 95% of export revenue.
8. Russia – 80 billion barrels
World's third-largest producer despite ranking eighth in reserves.
Post-2022 Western sanctions redirected crude flows from Europe to Asia, with China and India now absorbing the majority at discounted prices.
Despite export restrictions and G7 price cap at $60/barrel, it posted the second-highest global export value at $169.7 billion in 2024.
Russian Urals crude typically trades $15-30 below Brent due to quality, sanctions, and logistics, with November 2024 revenues declining to $11 billion.
9. United States – 74.4 billion barrels
The shale revolution through horizontal drilling and hydraulic fracturing has made the U.S. the world's #1 oil producer despite holding only the 9th-largest reserves.
The Permian Basin accounts for nearly 50% of production, with shale/tight oil representing 65% of total output.
Achieved net petroleum exporter status in 2020 for the first time since 1949, with crude exports growing from near-zero in 2015 to over 4 million bpd in 2024.
The U.S. government maintains a 375+ million barrel strategic reserve.
10. Libya – 48.4 billion barrels
Holds Africa's largest proven oil reserves at 48.4 billion barrels, producing light sweet crude commanding premium prices.
Rival bordering governments compete for oil revenue control, causing production to fluctuate based on political conditions.
Oil facilities face blockades, militia attacks, and political leverage tactics, preventing consistent returns.
Favourable geology enables extraction costs around $10-15 per barrel, with geographic proximity making Libya a natural supplier to European refineries.
What does this mean for oil markets?
The concentration of reserves among OPEC members (60% of the global total) ensures the organisation has continued influence over pricing, even as US shale provides a production counterweight.
Venezuela's potential return as a major exporter post-U.S. occupation could eventually ease supply constraints, though most analysts view significant production increases as years away.
Sanctions could create a situation where discounted crude seeks buyers willing to navigate compliance risks. Refiners with heavy crude processing capability may benefit from price differentials if Venezuelan barrels increase.
While reserves appear abundant, economically recoverable volumes depend on sustained high prices. If renewable adoption accelerates and demand peaks sooner than projected, stranded assets become a material risk for reserve-heavy producers.