

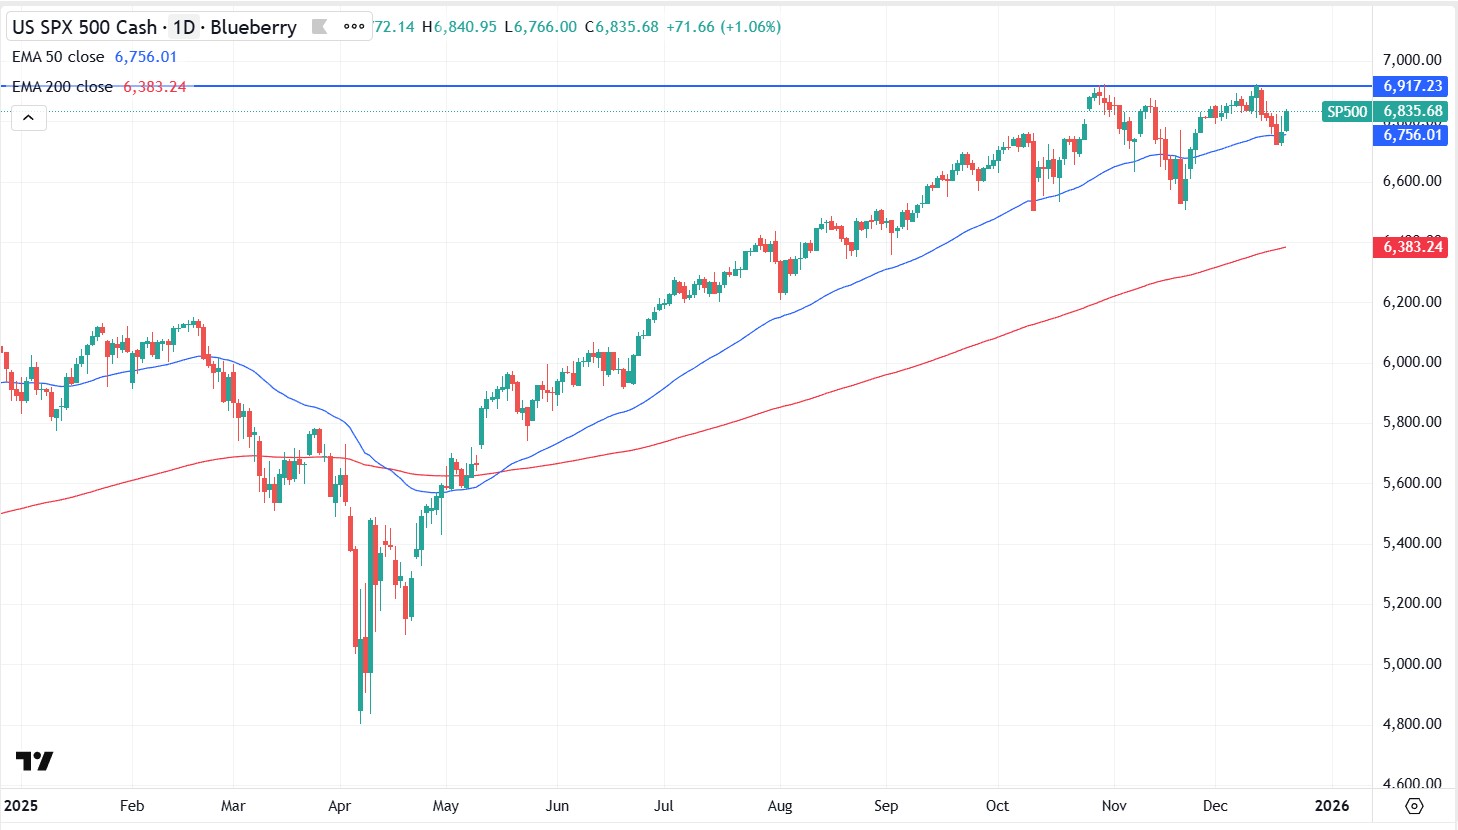
In 2025, the S&P 500 traded around 6,835 and was up approximately 16% year to date (YTD). Market direction remained most sensitive to Federal Reserve expectations, inflation data and the earnings outlook, with returns also shaped by mega-cap tech leadership and the broader AI narrative. The index pulled back from earlier December highs, but it has so far held above key major moving averages (MA).
Key 2025 drivers included:
- Fed expectations and inflation: Inflation cooled through the year but remained sticky around 2.5% to 3%. A Fed easing bias likely supported price to earnings (P/E) multiples and “risk-on” positioning. More recently, markets appeared increasingly rate-sensitive, with the decreased likelihood of an additional rate cut until March 2026.
- Earnings and guidance: Corporate earnings remained strong quarter on quarter. Recent Q3 results reportedly saw over 80% of the S&P 500 beat earnings per share (EPS) expectations. For Q4, the estimated year-over-year earnings growth rate is 8.1%, despite ongoing concerns around import tariffs and potential margin pressure.
- Index leadership and breadth: Returns were heavily influenced by mega-cap tech and AI beneficiaries, even as broader market breadth appeared less consistent at points through the year.
- Policy headlines and volatility: Trade and tariff headlines drove sharp moves, particularly earlier in the year. Some investors pointed to the “TACO” trade, with rapid recoveries after policy proposals were softened. Over time, similar shocks appeared to have less impact as the market became somewhat desensitised.
- Valuations and sensitivity: The forward 12-month P/E ratio for the S&P 500 is 22, above the 5-year average (20.0) and above the 10-year average (18.7). That gap kept valuation sensitivity, especially in AI-linked names, firmly in focus.
Current state
The S&P 500 is about 1% below record highs hit earlier in December. That could indicate the broader uptrend remains in place, with a move back toward the recent highs one possible scenario if momentum improves. Despite the recent retracement, the index remains above all key major moving averages (MA). The latest bounce followed lower than expected CPI numbers earlier this week, alongside continued, and to some, surprising optimism about what may come next.
What to watch in January
- Q4 earnings from mid-January: Results and guidance may help clarify whether valuations are being supported by forward expectations.
- AI narrative and positioning: With AI-linked mega-caps carrying a large share of market capitalisation, changes in sentiment or expectations could have an outsized impact on index performance.
- US jobs and CPI data: The latest US jobs report reportedly points to the highest headline unemployment rate since 2021. Cooling inflation this week may keep markets alert to shifts in rate cut timing, particularly around the March decision.
S&P 500 daily chart
Major FX pairs

AUD/USD
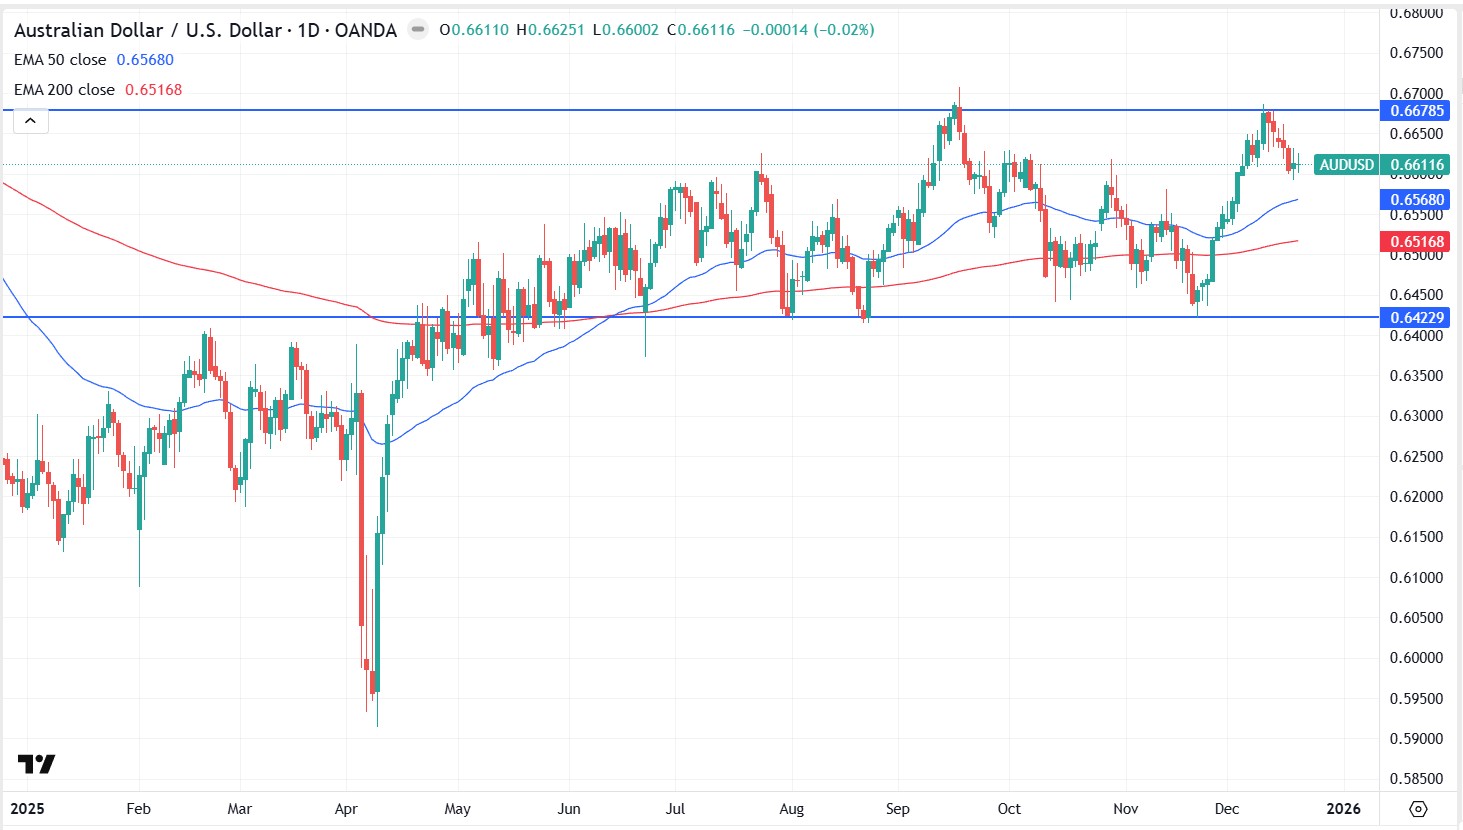
AUD/USD has been choppy in 2025. Since the “redemption day” drop in April, the move has looked more like a steady grind higher than a clean upside trend.
Key levels
Recent peaks in early September and mid-December highlight resistance near 0.6625. Support has been evident around 0.6425, where price bounced over the last month.
What is supporting the bounce
That support test coincided with stronger than expected jobs and inflation data, lifting expectations that the Reserve Bank of Australia (RBA) may raise rates during 2026 rather than cut again. The latest pullback looks contained so far, with buying interest already visible and price still above key longer-term moving averages.
What could drive a breakout
The pair remains range-bound, but the tilt is still constructive. If Chinese data stays firm, metals prices hold up, and the central bank outlook remains relatively hawkish, a break above resistance could gain more traction.
AUD/USD daily chart
EUR/USD
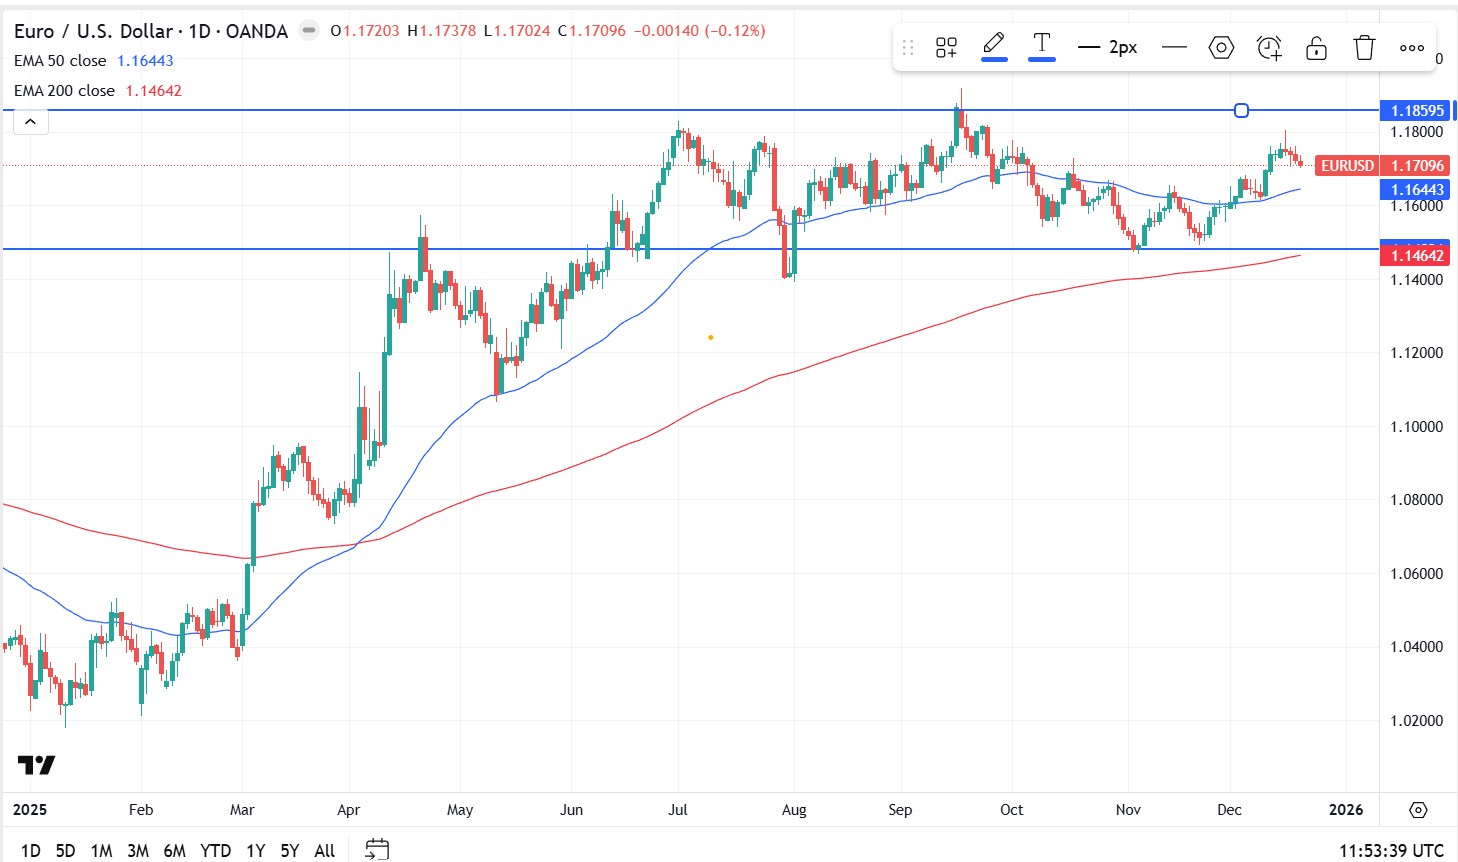
After early 2025 euro strength, EUR/USD has mostly consolidated since June in a roughly 270 pip range. This month tested 1.18 resistance, reaching highs not seen since September.
What price is doing now
The recent pullback still lacks strong downside conviction. Some technical analysts refer to the 1.17 area as a near-term reference level.
What could come next
If price holds 1.17 and buyers step back in, another push toward 1.18 is possible. One view is that the European Central Bank (ECB) could be less inclined to ease in 2026, which could be consistent with a firmer EUR/USD scenario. Broader analyst commentary also suggests the euro may stall rather than collapse against the US dollar, although outcomes remain data and policy dependent.
EUR/USD daily chart
USD/JPY
Year-to-date picture
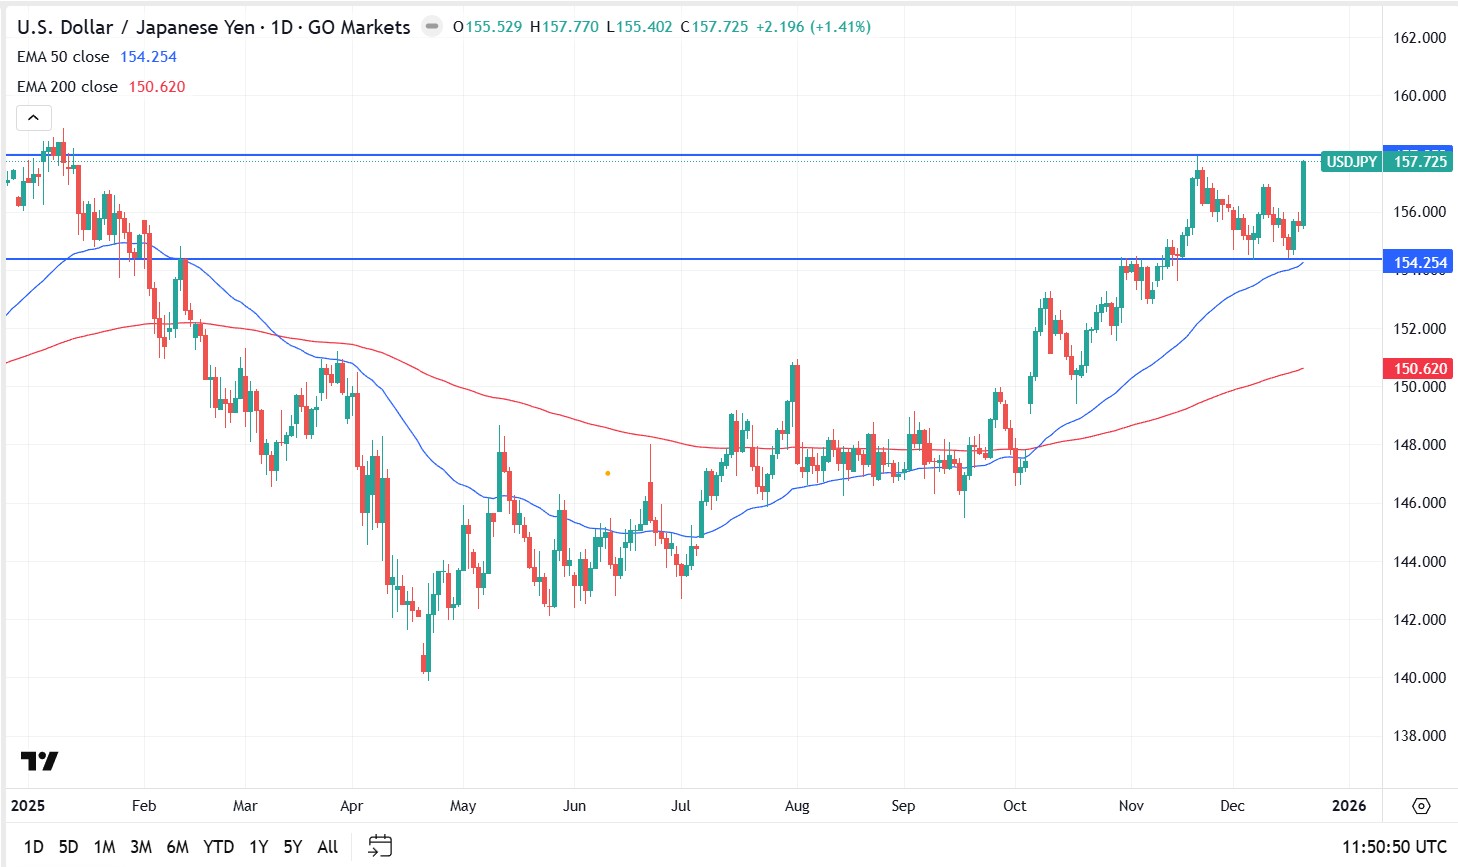
USD/JPY is close to flat overall for the year. After US dollar weakness in Q1, the pair reversed higher and now sits just below resistance near 158.
Rates remain the main driver
Rate differentials still favour the US dollar. The Bank of Japan (BOJ) held steady for much of the period despite expectations it might act, and the recent rate increase was modest. Policy has only moved marginally away from zero.
What could shift the balance
Rate differentials remain a key influence. Without a clearer shift in BOJ policy, the JPY may find it difficult to sustain a rebound. Some market commentators cite 154.20 as a chart reference level.
USD/JPY daily chart

Reportingdates and release times are based on company investor relations calendars whereconfirmed. Where dates or times are not marked confirmed, they are GO Marketsestimates. Consensus EPS, revenue and analyst-range data are sourced fromBloomberg and Earnings Whispers, as at 09 July 2026 (AEST). Company guidance,backlog and operating metrics are sourced from the latest company filings orresults presentations, unless stated otherwise. Any scenario analysis reflectsGO Markets analysis. Figures and schedules may change without notice.
The information provided is of general nature only and does not take into account your personal objectives, financial situations or needs. Before acting on any information provided, you should consider whether the information is suitable for you and your personal circumstances and if necessary, seek appropriate professional advice. All opinions, conclusions, forecasts or recommendations are reasonably held at the time of compilation but are subject to change without notice. Past performance is not an indication of future performance. Go Markets Pty Ltd, ABN 85 081 864 039, AFSL 254963 is a CFD issuer, and trading carries significant risks and is not suitable for everyone. You do not own or have any interest in the rights to the underlying assets. You should consider the appropriateness by reviewing our TMD, FSG, PDS and other CFD legal documents to ensure you understand the risks before you invest in CFDs. 免责声明:文章来自 GO Markets 分析师和参与者,基于他们的独立分析或个人经验。表达的观点、意见或交易风格仅代表作者个人,不代表 GO Markets 立场。建议,(如有),具有“普遍”性,并非基于您的个人目标、财务状况或需求。在根据建议采取行动之前,请考虑该建议(如有)对您的目标、财务状况和需求的适用程度。如果建议与购买特定金融产品有关,您应该在做出任何决定之前了解并考虑该产品的产品披露声明 (PDS) 和金融服务指南 (FSG)。


.jpeg)
