
.jpg)
近期,全球投资者越来越明显地感受到一个信号——美元的钱,开始“紧”了。这似乎有些不对劲,美联储10月底刚刚降息,理论上市场流动性应该更宽松,资金成本更低,但现实却是美元资金反而愈发紧张,资产价格开始同步下挫。这究竟是怎么回事?先看一个最直接的指标:纽约联储的正回购操作(Repo)和逆回购操作(Reverse Repo)。一个基本的原理是:Repo 上升、Reverse Repo 下降 = 市场资金紧张;Repo 下降、Reverse Repo 上升 = 市场资金充裕。10月末,联储的正回购操作量一度达到 500亿美元,这一数值在以往往往出现在极端流动性紧张的时刻。更关键的是,这种“抽水”并非短暂的月末现象——进入11月初后,正回购仍在持续,这意味着美元市场的“钱紧”已经趋于常态化。
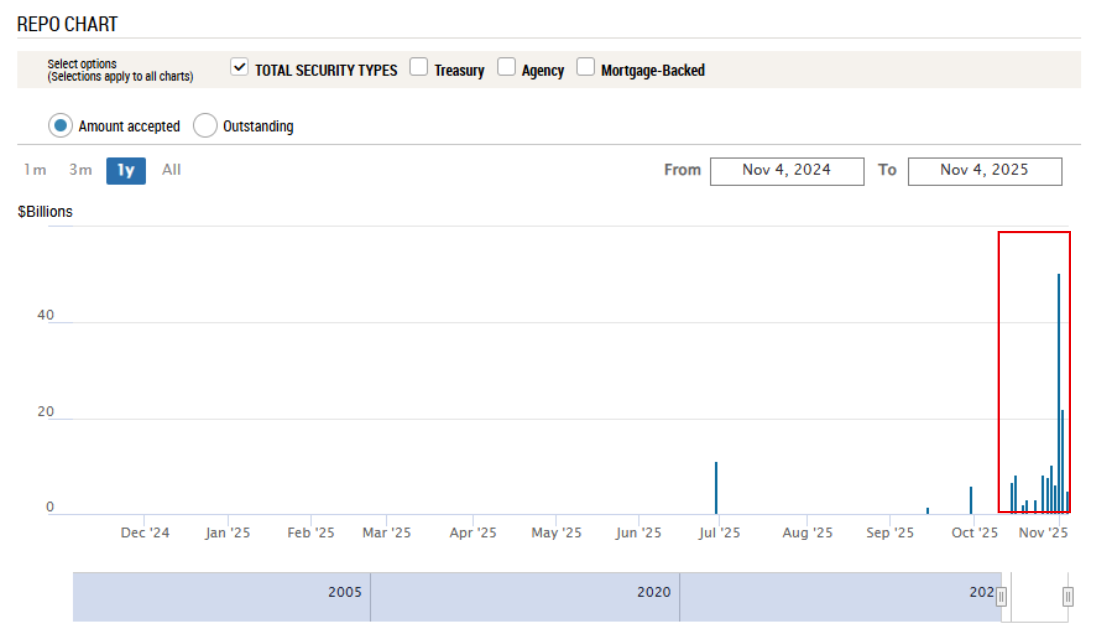
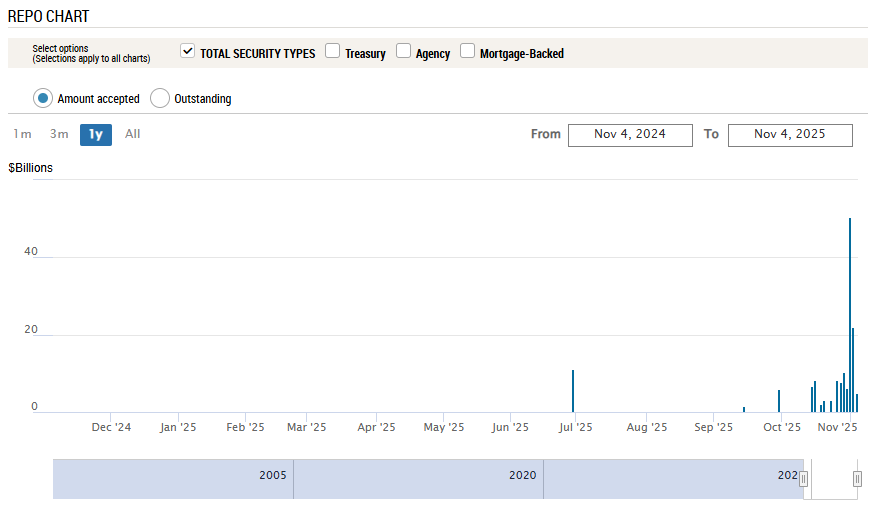
(纽联储官网)
资金紧张的根源在于:原先支撑流动性的“美元蓄水池”——ONRRP(超额逆回购工具)几乎被抽干了。
在过去两年,美联储在执行量化紧缩(QT)和财政部大量发债的同时,市场的流动性压力能通过ONRRP缓冲。但如今,这个高峰时期曾超过 2万亿美元 的“蓄水池”已经见底。
这意味着,财政部每多发一笔债、每回笼一笔资金,都将直接以消耗银行准备金为代价。
更雪上加霜的是,美国政府的“关门”也在加剧这一紧张。当前,美国政府停摆已进入第36天,创历史纪录,市场普遍预测将会持续更久。虽然财政部仍在继续发行美债,但政府支出却被迫收缩——这造成了所谓的“只收钱不花钱”的状态。结果是财政部的 TGA账户余额 从关门前的 8000亿美元 飙升至 1万亿美元。
这相当于财政部把市场的钱吸走,暂时“锁进保险柜”,导致金融系统内的资金流动性被进一步抽走。
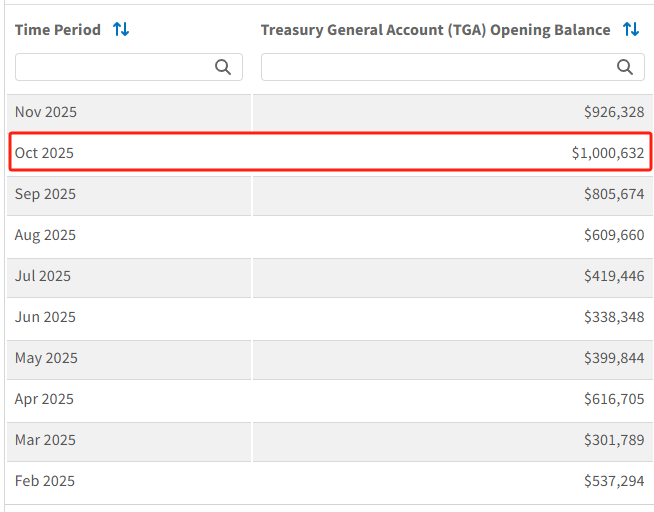
(美国财政部官网)因此,美联储降息≠流动性宽松。流动性收紧最先体现在资产价格上。鲍威尔释放“鹰派降息”信号,美元走强压制非生息资产(美股、黄金、数字货币),BT币已跌破10万关键技术与心理支撑位。股票方面,尽管AMD、英伟达等AI概念股业绩亮眼,但估值已高企;一旦预期无法持续超越,抛压立即显现。美股在强劲的企业盈利支撑下,仍然出现广度恶化、板块分化严重的迹象——少数科技巨头拉动指数,而多数板块早已疲弱。近期,美股盘中波动明显加大。大盘科技股盘前集体走低,Palantir、AMD 等年内翻倍的热门股出现回吐,而小盘股指数罗素2000则因流动性担忧大幅下跌。多家华尔街机构已开始提示短期调整风险:摩根士丹利与高盛均警告未来12–24个月内市场或回调超10%;美国银行称当前AI板块和消费板块估值“已被透支”;Piper Sandler认为,六个月的牛市之后,市场正在寻找一次“健康的修正”。总结来说,盈利没问题,但资金太紧。过去一周,比特币跌破10万美元关键支撑位,创下年内第二大单日跌幅;以太坊也同步重挫超过10%。黄金从高点跌落到4000美金/盎司,苦苦挣扎在整数位上。市场的“贪婪指数”迅速转为“极度恐惧”。
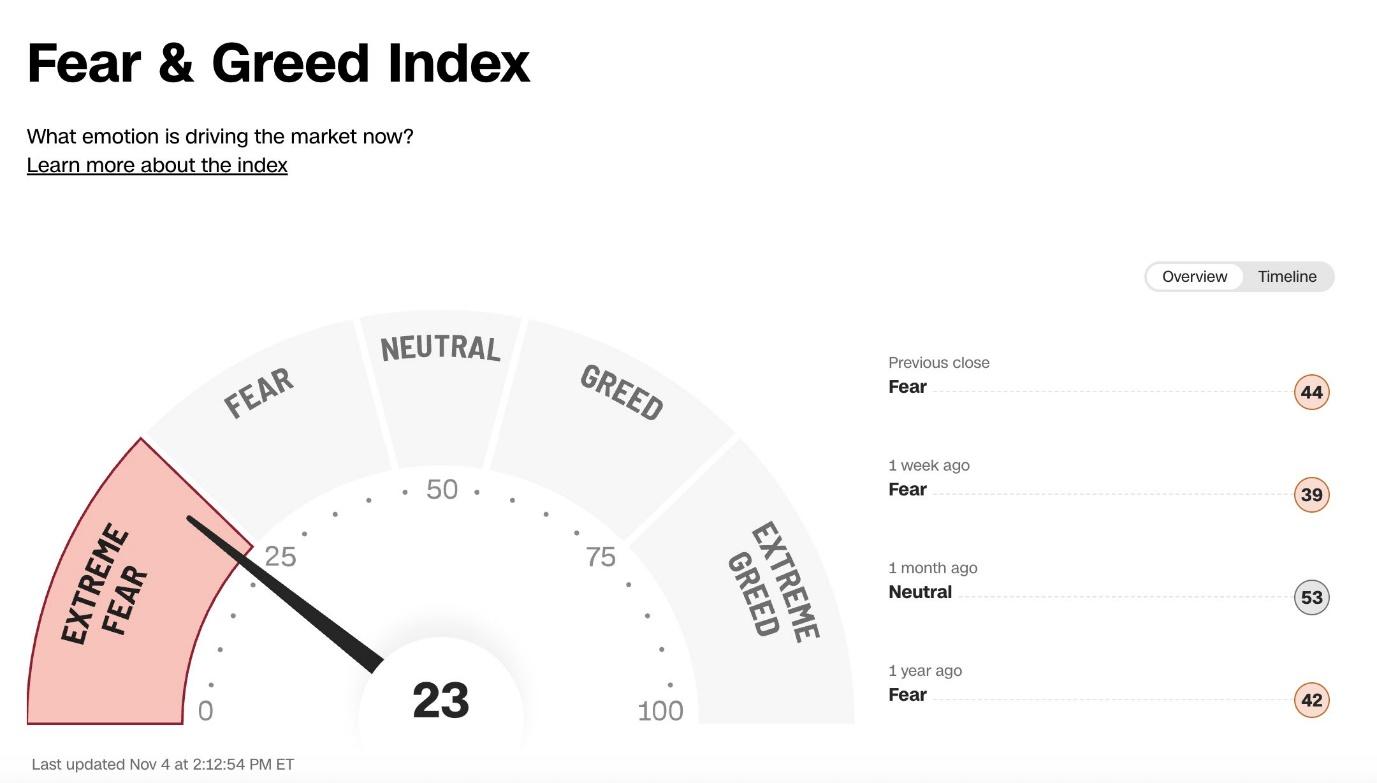
钱荒之下,现金为王。数字货币和黄金都是“无息资产”,当美元利率仍高、而流动性又紧时,这类资产当然最先被抛售。短期看,美元的“钱紧”确实是一个政策性扰动。一旦美国政府重新开门,财政支出回流,TGA账户下行,流动性将得到缓解。市场也在等待未来两周的经济数据,以重新定价12月的降息预期。另外,本周三还需关注美最高法院关于特朗普政府依据《国际紧急经济权利法》发起全球关税是否合法的审理——如果判定不合法,这将是对总统权限边界的重新划定,美债、美股反而可能双双下跌。在这样的阶段,建议分层思考:
- 长期投资者:若已具备股、债、黄金等多元化配置,无需恐慌。市场的短期波动反而创造了优质资产的加仓窗口。
- 短线交易者:在美国政府重新开门前,适当对冲股票头寸(如配置防御性板块、买入波动率或保护性期权),以应对政策真空期与流动性扰动。
- 资产配置层面:流动性紧缩往往是“转折期信号”。美联储一旦释放宽松信号,资产价格将快速反弹。保持现金、等待机会,或许比急于抄底更重要。
当财政扩张与货币紧张的矛盾同时存在,美国金融市场正经历一个微妙的临界点。短期的钱确实“紧”了,但正如历史无数次验证的那样:每一次“钱荒”,最终都以更猛烈的放水收场。
免责声明:GO Markets 分析师或外部发言人提供的信息基于其独立分析或个人经验。所表达的观点或交易风格仅代表其个人;并不代表 GO Markets 的观点或立场。
联系方式:
墨尔本 03 8658 0603
悉尼 02 9188 0418
中国地区(中文) 400 120 8537中国地区(英文) +248 4 671 903
作者:
Christine Li | GO Markets 墨尔本中文部

The information provided is of general nature only and does not take into account your personal objectives, financial situations or needs. Before acting on any information provided, you should consider whether the information is suitable for you and your personal circumstances and if necessary, seek appropriate professional advice. All opinions, conclusions, forecasts or recommendations are reasonably held at the time of compilation but are subject to change without notice. Past performance is not an indication of future performance. Go Markets Pty Ltd, ABN 85 081 864 039, AFSL 254963 is a CFD issuer, and trading carries significant risks and is not suitable for everyone. You do not own or have any interest in the rights to the underlying assets. You should consider the appropriateness by reviewing our TMD, FSG, PDS and other CFD legal documents to ensure you understand the risks before you invest in CFDs. 免责声明:文章来自 GO Markets 分析师和参与者,基于他们的独立分析或个人经验。表达的观点、意见或交易风格仅代表作者个人,不代表 GO Markets 立场。建议,(如有),具有“普遍”性,并非基于您的个人目标、财务状况或需求。在根据建议采取行动之前,请考虑该建议(如有)对您的目标、财务状况和需求的适用程度。如果建议与购买特定金融产品有关,您应该在做出任何决定之前了解并考虑该产品的产品披露声明 (PDS) 和金融服务指南 (FSG)。
.jpg)
.jpg)
.jpg)

.jpeg)
.jpeg)