热门话题三星的新旗舰手机S23来了,是不是能给我们一些惊喜呢?
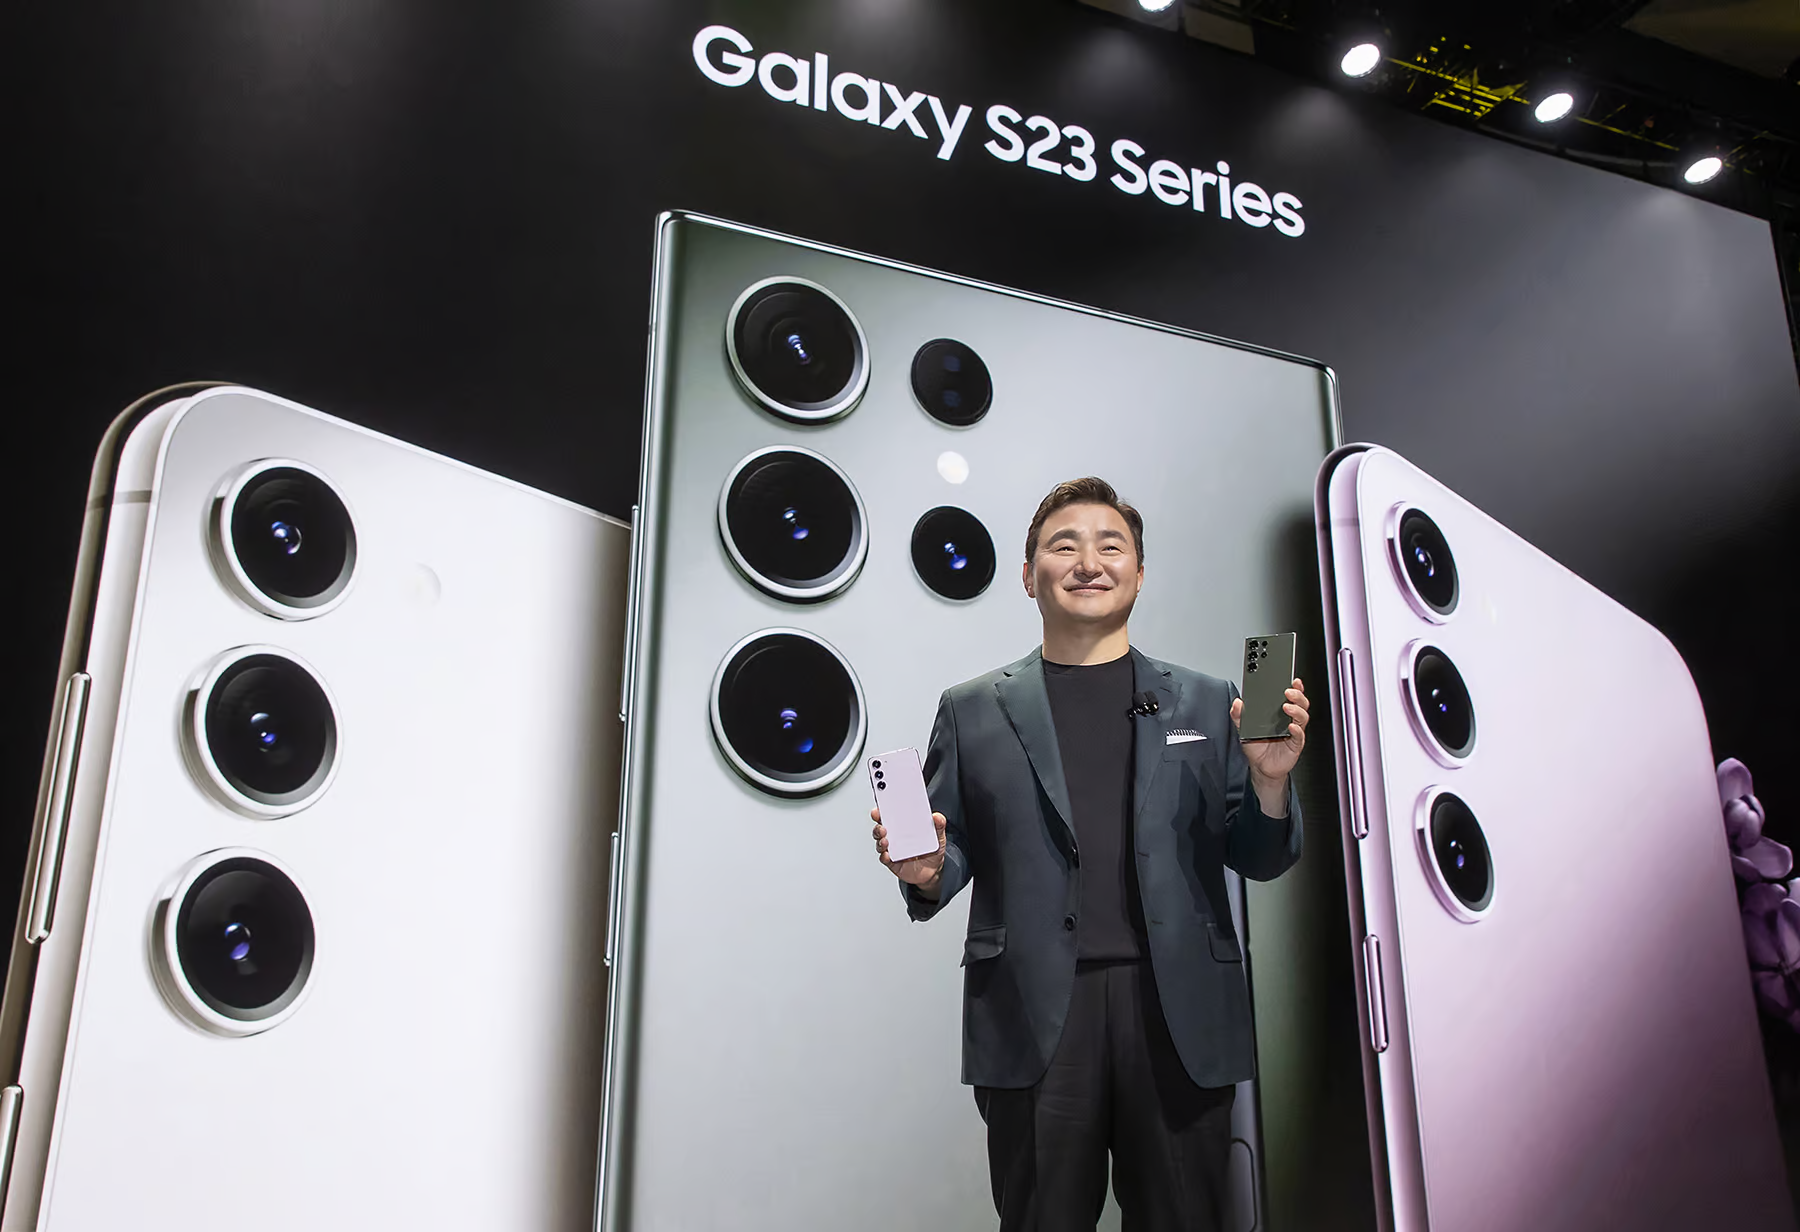
有一说一,近年来,我发现周围用三星手机的朋友可是越来越少了,其中不乏发生了很多负面的消息。其中包括:爆炸门事件:2016年,三星Galaxy Note 7智能手机因电池过热引发爆炸事件,引起全球关注。此次事件对三星的声誉造成了很大的损失,不仅造成了巨额的经济损失,还导致三星在智能手机市场上的竞争地位受损。市场份额下降:随着苹果、华为等品牌的崛起,三星的市场份额逐渐下降。尤其是在中国市场,三星的市场份额一度被华为、小米等本土品牌所超越。领导层危机:2017年,三星电子前副会长李在镕因受贿罪被判入狱,引起了公司领导层的危机。环境污染:2019年,三星被曝出在中国的生产工厂存在环境污染问题,引起了社会的广泛关注。三星随后表示将采取措施加强环境保护。这些负面消息不断的使得三星出现不好的声誉,再加上其生产的芯片的芯片一直以高发热和拉胯的功耗著称,也不断遭到了竞争对手台积电的打压,在2022年,大部分的大厂都选择使用台积电的工艺而放弃让三星代工,无疑也是对其有很大的影响。再者,三星的服务近年来也是被消费者诟病,维修售后也曾遭遇过集体诉讼。还有就是在近几年,手机竞争力不强的情况下,还都保持了很高的价格,性价比问题也是较为突出的问题。到了S23了,2023年了,三星这代,是不是会给我们一些惊喜呢?首先就是相机部分,近些年来大家手机相机都很卷啊,这次配置1200万像素超广角、两个1000万像素长焦镜头以及最重磅的2亿像素广角主摄的四摄组合。那么体现在在相片上也是表现不错的,对比Iphone 14 pro来说在相片水平是各有千秋,但是视屏方面,比起苹果阵营来说还是有不小的差距。然后通话质量其实也是一个亮点,在吵闹的环境中,仍然发挥了不俗的降噪功能,然而人声又不是非常的不真实,是我很喜欢的一个点。接下来就是重头戏了,芯片。这次三星S23搭载的定制的骁龙8gen2 for Galaxy,是用的台积电的4nm技术,哎?感觉这代的功耗稳了。其实不使用自家的生产的芯片也是有迹可循的,在今年四月,三星直接公开将要削减其NAND 和 DRAM 内存芯片的产量。这就对了嘛,以其花费时间资源不讨好,还不如直接用台积电技术来的快。那么骁龙8gen2 for Galaxy 定制版和原版有什么区别呢,之前笔者有文章写过,骁龙8 gen2 这个怪兽无限缩小了安卓和苹果在手机端处理器的差距。而这个定制版其实也就是有一些超频,实测下来其实跑分和测试差距和原版差距其实不大。用多一点点的功耗,换多一点点的性能。最后就是大家关注的散热问题,测试下来,虽然号称这次S23系列散热着巨大的改良(好吧对标以前的机型的确是散热进步不少),但是对标其他用了骁龙8gen2的机器来说,还是有些差距的,希望三星之后多多努力啦。虽然三星近年来被诟病问题不小,但是其财报显示销售额和净利润都在逐年上涨,近三年的净利润增长更是达到了21.32%,50.41%,39.46%。和国内百花齐放的情况不同,其中三星在波兰的市场渗透率已经接近了30%。
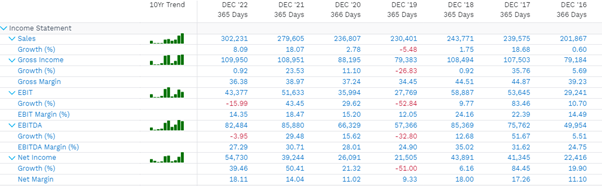
(Source:Factset)从手机市场份额图我们也可以看出,三星近年来基本上维持在20%左右,基本上还是稳居市场份额的前2,不容忽视。特别是欧洲地区,其实对于手机的选择,苹果和三星加起来占据了半壁江山。这也不难理解,三星虽然性价比不高,但是销售额和净利润还是在蹭蹭蹭的上涨。其次就是手机或者平板电脑只是占三星收入占比的20左右,其中还有半导体业务(包括DRAM和NAND闪存芯片),显示器和数字媒体业务,,消费电子业务(包括电视、家用电器、笔记本电脑等),IT和移动通信设备业务(包括笔记本电脑和网络设备),其他业务(包括金融、生命科学、化学等),因此,多路开花的情况下,也造就了三星“异常”漂亮的财报。
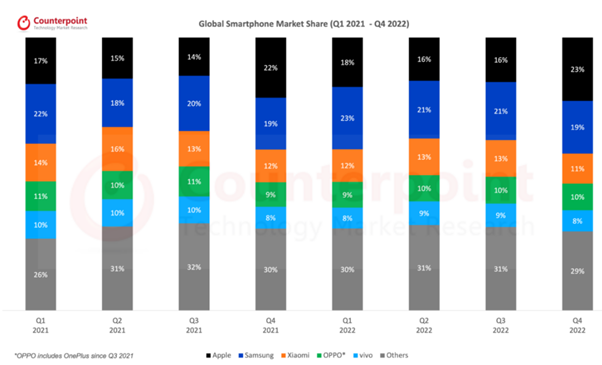
(Source:Counterpoint)从股价来看,目前三星的股价也是处于一个上升通道当中,目前处于上升通道的上沿,下方均线有明显的支撑力。入场的话,可以参考均线位置入场,整体表现强劲。
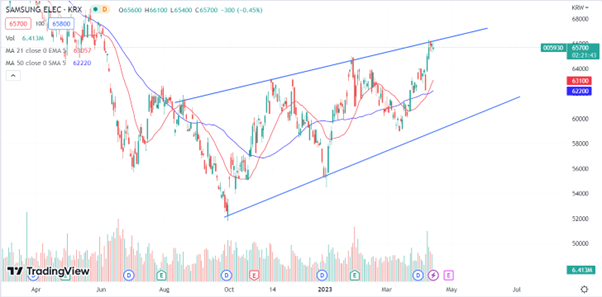
(Source:Tradingview)从财报和技术面来看,目前三星是属于一个很健康,很强劲的状态。评级的话,买入和持有评级也占据了大部分。多名分析师的平均目标价位估计在78247.4左右,是属于一个非常乐观的情绪。
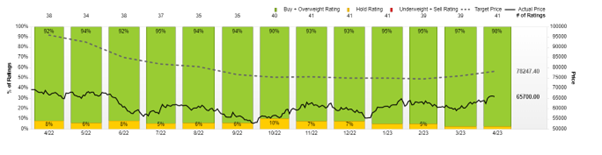
(Source:Factset)虽然在市面上三星的风评不是很好,但是从财报数据和股价上来说充满了机会,也希望三星在未来可以给客户提供更多高性价比的产品。如果您有其他想法,欢迎和我们进行沟通交流。免责声明:GO Markets分析师或外部发言人提供的信息基于其独立分析或个人经验。所表达的观点或交易风格仅代表其个人;并不代表GO Markets的观点或立场。联系方式:墨尔本 03 8658 0603悉尼 02 9188 0418中国地区(中文) 400 120 8537中国地区(英文) +248 4 671 903作者:Neo Yuan | GO Markets 分析师

The information provided is of general nature only and does not take into account your personal objectives, financial situations or needs. Before acting on any information provided, you should consider whether the information is suitable for you and your personal circumstances and if necessary, seek appropriate professional advice. All opinions, conclusions, forecasts or recommendations are reasonably held at the time of compilation but are subject to change without notice. Past performance is not an indication of future performance. Go Markets Pty Ltd, ABN 85 081 864 039, AFSL 254963 is a CFD issuer, and trading carries significant risks and is not suitable for everyone. You do not own or have any interest in the rights to the underlying assets. You should consider the appropriateness by reviewing our TMD, FSG, PDS and other CFD legal documents to ensure you understand the risks before you invest in CFDs. 免责声明:文章来自 GO Markets 分析师和参与者,基于他们的独立分析或个人经验。表达的观点、意见或交易风格仅代表作者个人,不代表 GO Markets 立场。建议,(如有),具有“普遍”性,并非基于您的个人目标、财务状况或需求。在根据建议采取行动之前,请考虑该建议(如有)对您的目标、财务状况和需求的适用程度。如果建议与购买特定金融产品有关,您应该在做出任何决定之前了解并考虑该产品的产品披露声明 (PDS) 和金融服务指南 (FSG)。