

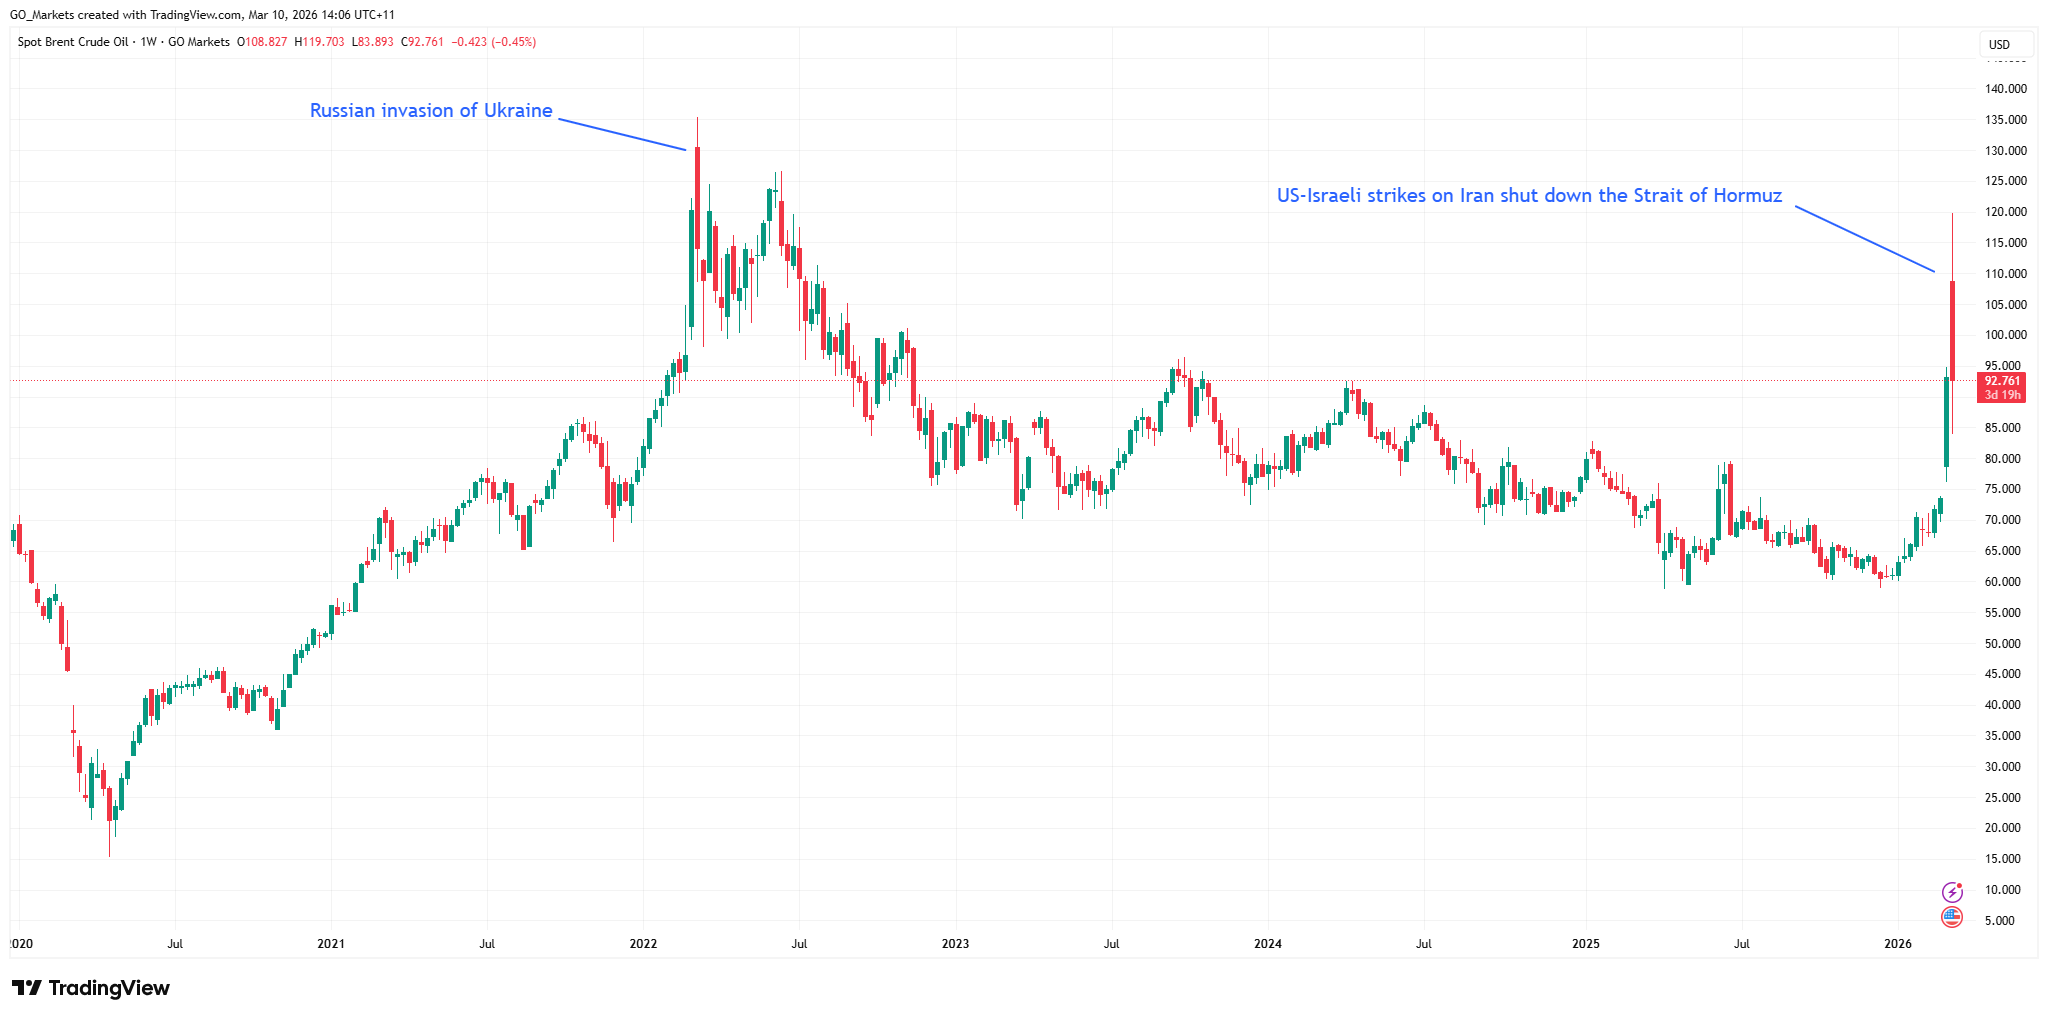
The US has entered the Israel-Iran war. However, despite an initial 4 per cent surge on the open, oil has settled where it has been since the conflict began in early June — around US$72 to US$75 a barrel.Trump claims the attacks from the US on Iranian nuclear facilities over the weekend are a very short, very tactical, one-off. This is something his base can get behind — some really big conservative players do not want a long-contracted war that sucks the US into external disputes.Whether this will be the case or not is up for debate, but there is a precedent from Trump's first presidency that we can look to. Iran had attacked several American bases in 2019, as well as attacking Saudi Arabia's most important oil refinery with Iranian drones. There wasn't a huge amount of damage; it was more a symbolic movement and display of capabilities by Iran.Initially, Trump didn't react — it took pressure from Gulf allies like the UAE and Israel for him to respond, which saw him order the assassination of the head of the Iranian Defence Force, Qasem Soleimani. This led to an Iranian response of ‘lots of noise’ and ‘cage rattling’, but minimal real action events, just a few drone attacks. Trump is betting on the same reaction now.If Iran follows the same patterns from the previous engagement, the geopolitical side of this is already at its peak.As of now, Iran is not going after or destroying major Gulf energy capabilities. Nor have there been any disruptions to the shipping traffic through the Strait of Hormuz. In fact, apart from a posturing vote to block the Strait, Iran has not made any indication that it is going to disrupt oil in any way that would lead to price surges.Additionally, despite the U.S. military equipment buildup in the region being its highest since the Iraq war, critical Iranian energy infrastructure is running largely unscathed.This all suggests that the geopolitics and the physical and futures oil markets remain disconnected. Oil will spike on news rumours, but the actual impacts in the physical realm to this point remain low. Of course, this could change in future. But, for now, the risk of seeing oil move to US$100 a barrel is still a minority case rather than the majority.

The information provided is of general nature only and does not take into account your personal objectives, financial situations or needs. Before acting on any information provided, you should consider whether the information is suitable for you and your personal circumstances and if necessary, seek appropriate professional advice. All opinions, conclusions, forecasts or recommendations are reasonably held at the time of compilation but are subject to change without notice. Past performance is not an indication of future performance. Go Markets Pty Ltd, ABN 85 081 864 039, AFSL 254963 is a CFD issuer, and trading carries significant risks and is not suitable for everyone. You do not own or have any interest in the rights to the underlying assets. You should consider the appropriateness by reviewing our TMD, FSG, PDS and other CFD legal documents to ensure you understand the risks before you invest in CFDs. These documents are available here.
免责声明:文章来自 GO Markets 分析师和参与者,基于他们的独立分析或个人经验。表达的观点、意见或交易风格仅代表作者个人,不代表 GO Markets 立场。建议,(如有),具有“普遍”性,并非基于您的个人目标、财务状况或需求。在根据建议采取行动之前,请考虑该建议(如有)对您的目标、财务状况和需求的适用程度。如果建议与购买特定金融产品有关,您应该在做出任何决定之前了解并考虑该产品的产品披露声明 (PDS) 和金融服务指南 (FSG)。


.jpg)


