

热门话题
新兴市场已经开始加息,土耳其,巴西,俄罗斯都开始加息了。挪威成为首个公布将要加息的发达国家。澳洲未来会不会跟随加息呢,如果加息,股票和房产价格是不是会下跌呢?挪威房地产价格在本月创出小幅新高,单月价格上涨1.3%。导致挪威央行在3月18日表态,会比预期更早的进行加息,加息时间提前至2021年下半年。给出的理由是,长期的低利率,使得房价迅速上涨,而过快的房价上涨,导致家庭债务进一步增长,使得低利率使其的国家金融风险增加。而通胀和油价表现都远超预期,因此会提前加息。俄罗斯加息0.25%,基准利率从4.25%上升到4.5%。俄罗斯央行表示,在未来某次会议还会加息,应对快速上涨的通胀压力。印度,韩国,马来西亚和泰国的央行也公开表示将会加息。我们目前需要关注的,依旧是美国加息预期。如果美国提前加息,澳洲房地产和股票市场都会出现回落。美联储至今未提及低利率时期房产价格迅速上涨的问题,只是在上周五提到,不再继续SLR政策,以此来缩减市场的信贷水平。如果银行不放贷款,自然房价就会有所回落。因此,在目前的背景下,美联储通过其他手段,包括SLR政策调整,控制房价快速上涨。相应的,澳洲银行业可能会跟随这一政策。但只要发达国家还没有加息的声音,在短期3-6个月的时间,我依旧维持对于股票市场的看好。对于房产,一般滞后性6-12个月,因此我认为房产价格将会持续上涨到明年3月份。
GO Markets团队从去年3月份以来,成功预测市场在各国央行的紧急救市的背景下,股票市场会持续上涨。并且在今年2月,提示了大家,随着美债收益率上涨,前期涨幅过大的科技股可能出现估值回调。所有的预测,都是有规律和逻辑可以遵循的。比如天气预报。云层厚了,就可能要下雨。如果晴空万里,下雨的概率就很低。所以我们要知道金融产品价格涨跌背后的逻辑。另外我们要知道,考虑哪几个因素能赚钱。那上周五美联储刚刚公布了关于SLR豁免到期的政策,对未来金融市场会有哪些影响呢?首先我们看逻辑。美联储不继续进行SLR,这个SLR,叫做补充杠杆率。在3月31日到期,不再续期。公布消息之后,上周五美股快速下跌,美债收益率迅速上跳到1.73%。SLR是什么呢?是一级资本除以风险资产。也就是银行,不能持有过多的风险资产。风险资产包括信贷,债券等。所以银行业将面临接近2万亿美元的资金缺口。这一消息,继续加速银行对于债券的抛售,债券价格将继续下跌。如果只要求银行增资,降低投资比例,但没有要求其降低杠杆比例,那么我们作为股票投资者就不需要担心市场。因为银行在缓解了短期资金不足情况下,将希望减少储蓄,这样能够降低总资产,因为赚钱能力下降了,缩减购债,缩减信贷,缩减资产表。这样市场利率将会短期冲高而后回落。更多的资金将流入货币基金和流动性较好的资产组合中,中期将利多美国股市,利空美国房市。

上周美联储7大表态中,释放了未来加息预期,将在2023年加息1次。并保留2022年加息的可能性。如果未来通胀来临,加息就会是必然。在2022年底如果开始进入加息周期,将对今年底到明年底高位进入楼市的投资者产生极大现金流压力。我们看到股票市场对于加息的敏感程度要比房地产市场早6-12个月。因此,今年下半年如果美国股市不再创出新高,也就意味着明年央行加息前的房价,可能是未来5年最高点。这一次疫情导致的央行救市,印钱的总量比2008年还要多,一旦失业率下降到5%以下,将是加息最直接的信号。因此,买房的朋友,需要关注两点,第一点是美国失业率水平是否降到5%。第二点,是澳洲的银行股股票价格是否出现回落。这两点都是房价到顶的信号。对于股票投资者来讲,不需要担心。因为市场灵活性足够,流动性很好,并且可以在加息周期到来的时候,舒舒服服的,开开心心的做空股市。也可以买入美元指数,或者做空非美货币对。为什么这次加息周期很长呢?有两点因素:1. 这次印钱太多,市场流动性如果泛滥到日常生活中的产品去,就会造成社会不稳定。所以需要更久的时间来消化此前的钞票。2. 要温水煮青蛙,循序渐进。市场信心刚刚恢复,所以加息的预期要提前一年给,加息的速度要分3-5年进行,给市场足够的准备时间。所以,这就是逻辑。是无法更改的趋势。就像红绿灯一样,央行和政府告诉你未来市场的走向,但是你硬要闯红灯,当然也可以,只是会更危险。所以我们做的就是帮助政府和央行,把他们的逻辑和对金融市场未来的设计,告诉大家,起到红绿灯的作用。那么哪几个因素能帮我们赚钱呢?其实搞金融投资和做生意都是一样的,要考虑两个核心问题:流量和存量。

流量是流动性。比如Jacky开了一家奶茶店,在City市中心的位置。那么每天络绎不绝的人流,都会是我潜在的客户。如果我开在了Dandenong山上,那么每天的流量可能只有个位数。金融的流量也是如此。全世界的投资产品,就是一个个奶茶店,我们这些投资者,就是喝奶茶的人。美国的股票市场,就是开在了市中心最核心的位置上,流量最大的地点,比如火车站出口。澳洲稍微差一点,开在了电车站出口。不管你是做生意,还是做网红,只要想赚钱,必须要有流量。所以流量是第一个要素。资本是逐利的,你看着钱流向了哪里,那个市场就会出现第二个买家,第三个,直到越来越多的人参与进来。我们只有找到社会财富最集中的行业,才能赚到大钱。全世界社会财富最多的是哪个国家?美国,所以美国享受了40年的牛市。去了美国,我们都可能是巴菲特。但巴菲特来了澳洲,那可能只是个放羊的。再看行业,股票市场,每年都有大家耳熟能详的10倍股,抓住一个,1万变10万,来年再抓住一个,就是100万。债券,黄金,楼市,有可能给你这样的机会么?所以总结来看,国家选好了,市场选好了,结论就是美国的股市机会更大。那么什么是存量呢?存量可以理解为是一种对于产品未来价值的定价反馈。比方说,GO Markets开了一家子公司,做什么业务呢?卖服装。如果GO Markets认为,疫情后期,大家开始消费了,那么我们就会多进一些衣服,多开发一些款式,多投入,这样未来可能卖的就多,赚的也多。所以,存量就变多了。就是公司的员工多了,贷款多了,设备多了,原材料多了,成品衣服也多了。这个叫做存量变多了。反之,我们认为疫情后期,大家更懂得存款和投资了,不愿意进行消费了,那么我们就裁员,减少库存数量,降价销售,这个叫做存量减少。所以,存量理解为对未来产品价值的定价反馈。
图形分析
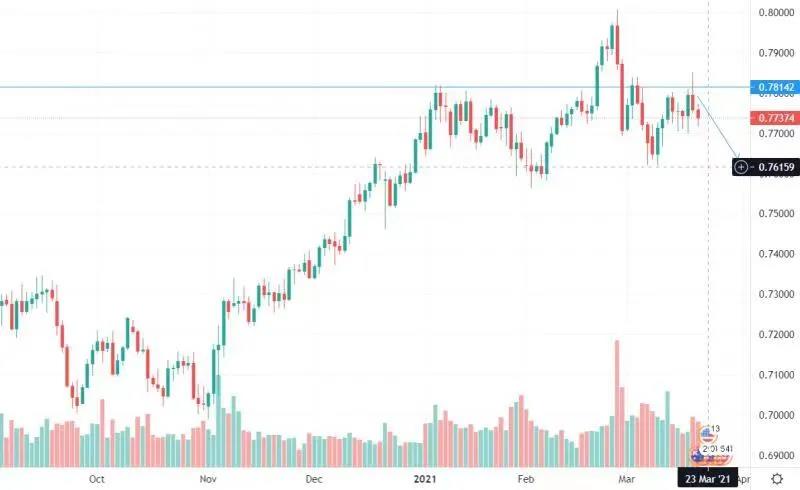
AUDUSD(澳元兑美元):澳元兑美元在突破0.8失败之后,形成了K线图形的头肩顶,右侧肩部逐步向下,目标价格0.7700下方。空单上方止损价格可以设置在0.78整数位附近。免责声明:GO Markets分析师或外部发言人提供的信息基于其独立分析或个人经验。所表达的观点或交易风格仅代表其个人;并不代表GO Markets的观点或立场。联系方式:墨尔本 03 8658 0603、悉尼 02 9188 0418。


The information provided is of general nature only and does not take into account your personal objectives, financial situations or needs. Before acting on any information provided, you should consider whether the information is suitable for you and your personal circumstances and if necessary, seek appropriate professional advice. All opinions, conclusions, forecasts or recommendations are reasonably held at the time of compilation but are subject to change without notice. Past performance is not an indication of future performance. Go Markets Pty Ltd, ABN 85 081 864 039, AFSL 254963 is a CFD issuer, and trading carries significant risks and is not suitable for everyone. You do not own or have any interest in the rights to the underlying assets. You should consider the appropriateness by reviewing our TMD, FSG, PDS and other CFD legal documents to ensure you understand the risks before you invest in CFDs. 免责声明:文章来自 GO Markets 分析师和参与者,基于他们的独立分析或个人经验。表达的观点、意见或交易风格仅代表作者个人,不代表 GO Markets 立场。建议,(如有),具有“普遍”性,并非基于您的个人目标、财务状况或需求。在根据建议采取行动之前,请考虑该建议(如有)对您的目标、财务状况和需求的适用程度。如果建议与购买特定金融产品有关,您应该在做出任何决定之前了解并考虑该产品的产品披露声明 (PDS) 和金融服务指南 (FSG)。


