
Market news & insights
Stay ahead of the markets with expert insights, news, and technical analysis to guide your trading decisions.

ASX defence stocks are back on more watchlists and according to the Stockholm International Peace Research Institute (SIPRI), global military spending reached approximately US$2.718 trillion in 2024, up 9.4% in real terms.
Australia’s current defence settings are set out in the 2024 National Defence Strategy and related investment planning documents, which outline long-term capability funding priorities. Furthermore, Canberra has pointed to A$330 billion of capability investment through 2034, including added funding for surface combatants, preparedness, long-range strike and autonomous systems.
Here is the part most people miss: not all ASX defence stocks are the same trade. Some sit close to naval shipbuilding. Some are counter-drone names and some are smaller, higher-risk operators where one contract may matter much more than the market assumes.

5 volatility questions Aussie traders are asking right now
These five names are not a buy list, rather they are a practical watchlist for investors trying to understand where procurement momentum may actually show up on the ASX.
1) Austal (ASX: ASB)
Austal is one of the ASX-listed companies most directly exposed to Australia’s naval shipbuilding pipeline, although contract execution, margins and delivery timing remain important variables.
They aren't just winning random contracts; they have signed a massive legal agreement (the Strategic Shipbuilding Agreement) that makes them the official partner for building Australia's next generation of mid-sized military ships in Western Australia.
In February 2026, the government gave Austal the green light on a $4 billion project. This isn't for just one ship, it’s for 8 "Landing Craft Heavy" vessels. These are huge transport ships (about 100 metres long) designed to carry heavy tanks and equipment directly onto a beach. But here is the part most people miss, shipbuilding is a marathon, not a sprint.
As you can see in the delivery timeline, while construction starts in 2026, the final ship won't be delivered until 2038. For an investor, this means Austal has a "guaranteed" stream of income for the next 12 years, but they have to be very good at managing their costs over that long period to actually make a profit.
2) DroneShield (ASX: DRO)
If you have seen footage of small drones disrupting modern battlefields, DroneShield is building part of the "off switch". Its focus is counter-drone technology, including systems that detect, disrupt or defeat drones using electronic warfare, sensors and software-led tools, rather than relying only on traditional munitions.
By early 2026, DroneShield had moved beyond the label of a promising start-up and into a much larger commercial phase. It reported FY2025 revenue of A$216.5 million, up 276% from FY2024, and said it started FY2026 with A$103.5 million in committed revenue.
One point the market may overlook is the software layer in the model. DroneShield reported A$11.6 million in Software as a Service (SaaS) revenue in FY2025 and said it is working towards SaaS making up 30% of revenue within five years. Its subscription model includes software updates for deployed systems, which adds a growing stream of recurring revenue alongside hardware sales.
Among ASX defence stocks, DroneShield is one of the most direct ways to follow the counter-UAS theme. It is also one of the names where sentiment can swing quickly, because growth stories can rerate both up and down when order timing changes.
The defence stocks to watch: The Iran War winners & losers
3) Electro Optic Systems (ASX: EOS)
EOS builds both the "brain" and the "muscle" for military platforms. It is best known for remote weapon systems, which allow operators to control armed turrets from inside protected vehicles, and for high-energy laser systems aimed at counter-drone defence. EOS has said its unconditional backlog reached about A$459.1 million in early 2026, following a series of contract wins through 2025. That points to a much larger base of secured work, although delivery timing and revenue conversion still matter.
EOS signed a €71.4 million, about A$125 million, contract with a European customer for a 100-kilowatt high-energy laser weapon system. EOS says the system is designed for a low cost per shot and can engage up to 20 drones a minute. The Australian Government has set aside A$1.3 billion over 10 years for counter-drone capability acquisition, and EOS has disclosed that it was part of a successful LAND 156 bid team. That does not guarantee future revenue, but it does support medium-term visibility in a market the company is already targeting.
EOS reads as a rebound story, but one that still depends on execution. The company has reoriented around remote weapon systems, counter-drone systems and lasers, all areas tied to stronger defence spending. The key question is whether it can keep converting backlog and pipeline into delivered revenue while maintaining balance-sheet discipline.
4) Codan (ASX: CDA)
Codan is sometimes left out of casual defence stock lists because it is more diversified. That may be an oversight. In its H1 FY26 results, Codan said its Communications business designs mission-critical communications for global military and public safety markets. Communications revenue rose 19% to A$221.8 million. The company also said DTC delivered strong growth from defence and unmanned systems demand, with unmanned systems revenue up 68% to A$73 million. Codan said about half of that unmanned revenue was linked to operational defence applications in conflict zones.
This is where the story becomes more nuanced. In a basket of ASX defence stocks, Codan may offer a different profile, with less pure headline sensitivity, broader operating diversification and meaningful exposure to military communications and unmanned systems without being a single-theme name. That diversification may also mean the stock does not always trade like a pure-play defence name.
What rising oil prices could mean for Exxon, Chevron and Woodside
5) HighCom (ASX: HCL)
HighCom sits at the speculative end of this list, and it should be labelled that way. The company says its two continuing businesses are HighCom Armor, which supplies ballistic protection, and HighCom Technology, which supplies and maintains small and medium uncrewed aerial systems, counter-uncrewed aerial systems, and related engineering, integration, maintenance and logistics support for the ADF and other aligned regional militaries.
In H1 FY26, revenue from continuing operations fell 59% to A$10.9 million, while EBITDA moved to a A$5.4 million loss from a A$1.9 million profit a year earlier. HighCom also disclosed A$5.1 million in HighCom Technology revenue, including A$3.5 million from small uncrewed aerial systems (SUAS) spare parts and A$1.6 million from sustainment services provided to the Australian Department of Defence.
So yes, HighCom is one of the more financially sensitive ASX defence stocks on the board. But it is also the kind of smaller name that can show how procurement filters down into support, sustainment and specialist protection gear.
Key market observations
- Track program milestones, not just political headlines. Contract awards, manufacturing starts, delivery schedules and sustainment work often matter more than a single announcement day.
- Separate pure-play exposure from diversified exposure. DroneShield and EOS are closer to concentrated defence technology themes, while Codan brings communications exposure within a broader business mix.
- Watch sovereign capability themes in Australia. Austal and EOS are tied to local manufacturing, integration and Australian supply chains, which supports the broader sovereign capability theme in this group.
- Pay attention to balance sheets and cash conversion. Procurement momentum can be real even when timing gets messy. HighCom's latest half is a reminder of that.
Global volatility and CFDs: how to trade after a geopolitics shock
Risks and constraints
Defence headlines can look immediate. Earnings usually are not. Austal's major naval work stretches into the next decade. EOS contracts are delivered over multiple years. DroneShield's order flow appears strong, but the company still separates committed revenue from broader pipeline opportunity. HighCom shows the other side of the coin. Exposure to procurement does not automatically translate into smooth financial execution.
References to ASX-listed defence stocks are general information only, not a recommendation to buy, sell or hold any security or CFD. These stocks can be highly volatile and are sensitive to contract timing, government policy, geopolitics, execution risk and market conditions. Backlog, pipeline and revenue expectations are not guarantees of future performance.
Ready to trade beyond the majors?
Open an account · Log in


Three central banks are deciding rates simultaneously, Brent crude is swinging wildly around US$100 a barrel, and a war in the Middle East is rewriting the inflation outlook in real time. Whatever happens this week could set the tone for markets for the rest of 2026.
Quick facts
- The Reserve Bank of Australia (RBA) announces its next cash rate decision on Tuesday, with markets now pricing a 66% chance of a second hike to 4.1%.
- Some analysts have warned the Iran war could push US inflation to 3.5% by year-end and delay Fed rate cuts until September, making this week's FOMC dot plot the most closely watched in years.
- Brent crude is flirting with US$100 a barrel after Iran launched what state media described as its "most intense operation since the beginning of the war."
RBA: Will Australia hike again?
The RBA raised the cash rate for the first time in two years to 3.85% at its February meeting after inflation picked up materially in the second half of 2025.
The question now is whether it moves again before even seeing the next quarterly CPI print, which isn't due until 29 April.
Deputy Governor Andrew Hauser acknowledged ahead of the meeting that policymakers face a genuinely divided decision, shaped by conflicting economic signals at home and growing instability abroad.
Financial markets currently assign around a 66% probability to another hike, with a May increase considered virtually certain regardless of what happens Monday.
Key dates
- RBA Cash Rate Decision: Tuesday 17 March, 2:30 pm AEDT
- Governor Bullock press conference: Tuesday 17 March, 3:30 pm AEDT
Monitor
- Any reference from Bullock to further hikes being likely in May
- AUD/USD immediate reaction.
- ASX banks and REITs.

FOMC: Hold likely, all eyes on the dot plot
The FOMC meets on March 17–18, with the policy statement scheduled for 2:00 pm ET on March 18 and Chair Jerome Powell's press conference at 2:30 pm. CME FedWatch shows a 99% probability that the Fed holds rates at 3.50% to 3.75%.
The real action is in the Summary of Economic Projections (SEP) and dot plot. The current median dot shows one 25-basis-point cut for 2026. If it shifts to two cuts, that is dovish and bullish for risk assets. If it shifts to zero cuts or adds a rate hike into the projection, markets could react in the other direction.
Further complicating matters, Powell's term as Federal Reserve Chair expires on May 23, 2026. Kevin Warsh is the leading candidate to replace him, viewed as more hawkish on monetary policy. Any comment from Powell on this transition could move markets independently of the rate decision itself.
Key Date
- FOMC Rate Decision + SEP/Dot Plot: Thursday 19 March, 4:00 am AEDT
- Powell press conference: Thursday 19 March, 4:30 am AEDT
Monitor
- Powell's language on oil and tariff inflation.
- 2-year Treasury yield reaction.
- CME FedWatch repricing for any shift in the September cut probability.

Bank of Japan: Further tightening could be brought forward
The BOJ meets on March 18–19, with the decision expected Thursday morning Tokyo time. The current policy rate sits at 0.75% (a 30-year high), and the January 2026 meeting produced a hold in an 8-1 vote.
Governor Ueda has categorised the March meeting as "live," noting the timeline for further tightening could be "brought forward" if Shunto spring wage negotiations yield stronger-than-expected results.
Those results are due to begin flowing in during the week, making them the critical input for the BOJ's decision. Nomura expects 2026 Shunto wage hikes to come in around 5.0%, including seniority, with base pay growth of approximately 3.4%. If results confirm that trajectory, the case for a March hike strengthens considerably.
The complication is the global backdrop. Japan imports roughly 90% of its energy needs, and oil around US$100 per barrel is pushing up import costs and threatening to add inflationary pressure. A BOJ hike into a global oil shock would be an unusually bold move.
Most market participants still lean toward a hold at this meeting, with April or July seen as the more likely timing for the next move.
Key Date
- BOJ Policy Rate Decision (currently 0.75%): Thursday 19 March, morning AEDT
Monitor
- Shunto wage results as the primary trigger for a March hike.
- Ueda press conference language and forward guidance on April and July.
- USD/JPY reaction.

Oil: Continued volatility
Brent crude briefly touched US$119.50 per barrel earlier in the week before dropping 17% to below US$80, then rebounding toward US$95 on mixed signals from Washington about the Strait of Hormuz.
As of Thursday, Brent was back over US$100 as Iran launched fresh attacks on commercial shipping and the IEA reserve release failed to bring meaningful relief.
In the scenario where a longer conflict inflicts damage to energy infrastructure, analysts estimate CPI could rise to 3.5% by the end of 2026, with gasoline prices approaching US$5 per gallon in the second quarter.
For this week, oil acts as a macro meta-variable. Every geopolitical headline, ceasefire signal, tanker attack, reserve release, and Trump comment could move equities, bonds and currencies in real time.
Monitor
- Any resumed Strait of Hormuz tanker flow.
- IEA emergency reserve release.
- Trump statements on Iran.
- Energy sector equities.
7 global commodity stocks to watch as the Iran war reshapes markets

US-Israeli strikes on Iran launched on 28 February sent Brent crude surging past US$119 a barrel, gold above US$5,200, and defence stocks to all-time highs.
Against that backdrop, investors are focusing on a small group of commodity-linked names that may remain sensitive to further moves in oil, LNG and gold. The key question is whether the shock proves sustained, or whether a ceasefire, shipping normalisation, or policy action removes part of the geopolitical risk premium.
1. ExxonMobil (NYSE: XOM)
ExxonMobil has been one of the clearest beneficiaries of the price surge. Shares hit a record high of US$159.60 in early March and are up approximately 28% year-to-date.
The company produces 4.7 million barrels of oil equivalent per day, has a Permian Basin breakeven of around US$35/barrel, and is committed to US$20 billion in buybacks for 2026.
Wells Fargo raised its price target to US$183 from US$156 following the escalation, while broader analyst consensus sits around US$140–$144. However, XOM is already trading above many consensus targets, and disruption to its LNG partner QatarEnergy poses a near-term operational headwind.
What to watch
- Whether Hormuz disruptions persist beyond 4–6 weeks.
- A G7 emergency stockpile release or a credible ceasefire could compress the war risk premium.
- Any adjustments to analyst consensus targets.
What rising oil prices mean for Exxon
2. Chevron (NYSE: CVX)
Chevron touched a new 52-week high of US$196.76 in early March and has risen approximately 24% year-to-date.
The company's Brent breakeven for dividends and capital expenditure sits around US$50/barrel. This means that at current Oil prices above US$90, it is generating significant free cash flow.
However, Chevron has temporarily halted operations at a gas field off Israel's coast following missile activity in the region, and the stock has since pulled back more than 1% as the conflict directly affects its operations.
What to watch
- Direct operational updates from Chevron's Middle East and Israeli assets.
- Any further halts that could weigh on near-term production.
- Crude holding above US$90, which keeps Chevron generating significant free cash flow.
3. Woodside Energy (ASX: WDS/NYSE: WDS)
With Qatar having halted output after Iranian drone strikes, buyers across Asia and Europe are scrambling for alternative supply. Woodside, as one of Australia's largest LNG producers and exporters, sits outside the conflict zone and is well-positioned to benefit from rerouted demand.
Analysts caution that actual substitution takes time due to shipping and contract constraints, meaning the price uplift may be more durable than a simple spot trade. European TTF benchmark gas prices surged over 50% in a week, amplifying the margin environment for non-Middle Eastern LNG producers.
What to watch
- The pace and timeline of any Qatar LNG production restart.
- If QatarEnergy remains offline for weeks, Woodside could begin re-contracting European buyers at elevated spot prices.
- An Australian dollar move higher could be a headwind worth tracking for USD-denominated earnings.
4. Cheniere Energy (NYSE: LNG)
Alongside Woodside, Cheniere is the most direct US beneficiary of the Qatar LNG disruption. As the largest LNG exporter in the United States, it saw intraday strength at the start of the conflict week.
US domestic energy production has buffered American consumers from the worst of the shock, but the export premium has widened as European and Asian buyers pay up for non-Gulf supply.
The trade is "geopolitically sensitive," and any resolution could reverse upside quickly. But for as long as Hormuz and Gulf gas infrastructure remain compromised, Cheniere is positioned to benefit structurally.
What to watch
- Any diplomatic breakthrough that reopens Gulf shipping lanes.
- Announcements of new long-term offtake contracts signed at current elevated prices.

5. Newmont Corporation (NYSE: NEM)
Gold surged 5.2% in a single session on 1 March, touching US$5,246/oz, as markets sought safe-haven assets. Newmont, the world's largest gold producer, has seen its reserves effectively revalued at these prices.
It is up alongside gold's 24% year-to-date gain, and its all-in sustaining costs remain largely fixed.
However, Gold miners sold off sharply on 4 March, and Newmont fell nearly 8% in a single session as broader risk-off deleveraging hit precious metals equities.
The stock has recovered since, but volatility remains high. For longer-duration investors, analysts note that "safe" mining jurisdictions such as Canada, Australia, and Nevada are commanding fresh premiums as Middle East instability raises the value of geopolitically secure supply.
What to watch
- Whether gold can hold above US$5,000/oz.
- A prolonged conflict could accelerate an M&A cycle in junior gold miners.
- A ceasefire or broad equity deleveraging event as the primary risk to monitor.

6. Lockheed Martin (NYSE: LMT)
Lockheed Martin reached a new all-time high of US$676.70 on 3 March, up over 4% for the day. Its F-35 fighters, precision-guided munitions, THAAD systems, and HIMARS rocket artillery are central to the ongoing air campaign.
The US Department of Defence is moving to replenish munitions stockpiles, and Trump's stated ambition to raise the US defence budget to US$1.5 trillion by 2027 adds a longer-term structural tailwind beyond the immediate conflict.
Defence stocks are rising amid classic geopolitical risk pricing, but investors should note that actual contract flow takes time to translate into earnings, and valuations already reflect considerable optimism.
What to watch
- The pace of US Department of Defence munitions replenishment orders.
- How quickly contract wins translate into backlog growth.
Top defence stocks to watch: Iran winners and losers
7. Barrick Gold (NYSE: GOLD)
Barrick is tracking gold's historic run alongside Newmont, with the stock up sharply year-to-date. It sits at a roughly US$78 billion market capitalisation and is reporting record free cash flow projections as its all-in sustaining costs remain well below current spot prices.
Like Newmont, it experienced a sharp single-session selloff of more than 8% during the broader 4 March deleveraging event, before partially recovering.
Royalty and streaming companies such as Wheaton Precious Metals (WPM) are being favoured by some investors as a more inflation-protected way to access gold upside, given their lower operational cost exposure. But Barrick remains one of the world’s largest listed gold miners, with earnings that are highly sensitive to changes in the gold price
What to watch
- Gold's ability to hold above US$5,000/oz.
- Any Barrick moves toward junior miner acquisitions.
- Energy cost inflation, as rising fuel prices could begin to squeeze miner operating margins.

Latin America recorded $730 billion in crypto volume in 2025. Across the region, 57.7 million people now own some form of digital currency rankingslatam, a base that is growing faster than anywhere else in the world
As institutional capital arrives and regulation matures, these are the publicly traded names investors are watching closest.
Why LATAM is a crypto powerhouse right now
Top LATAM crypto stocks to watch
1. Nu Holdings (NYSE: NU)
Digital banking · 127M users across Brazil, Mexico and Colombia
Nubank could be one of the most direct listed proxies for LATAM's fintech and crypto boom. The company integrated cryptocurrency trading directly into its Nu app and partnered with Lightspark to embed the Bitcoin Lightning Network for faster and more cost-effective Bitcoin transactions.
In Q3 2025, revenue jumped 42% year-on-year to $4.17 billion, customer deposits rose 37% to $38.8 billion, and gross profit was up 35% to $1.81 billion.
The stock has returned roughly 36% over the past year and tripled the S&P 500's returns over the last three years. The company dominates Brazil, with over 60% of the adult population using Nubank.
Nu Holdings also recently secured conditional approval to launch Nubank N.A., a US national digital bank. However, the announcement triggered a pullback, with investors cautious about capital deployment timelines and expansion costs.
UBS has lowered its price target to $17.20, citing some market caution despite positive operational shifts.
What to watch
- Credit quality trends in Brazil and Mexico.
- Pace of USDC adoption via Nubank rewards.
- US bank charter timeline and early cost disclosures.
2. MercadoLibre (NASDAQ: MELI)
E-Commerce/Fintech · 18 countries across Latin America
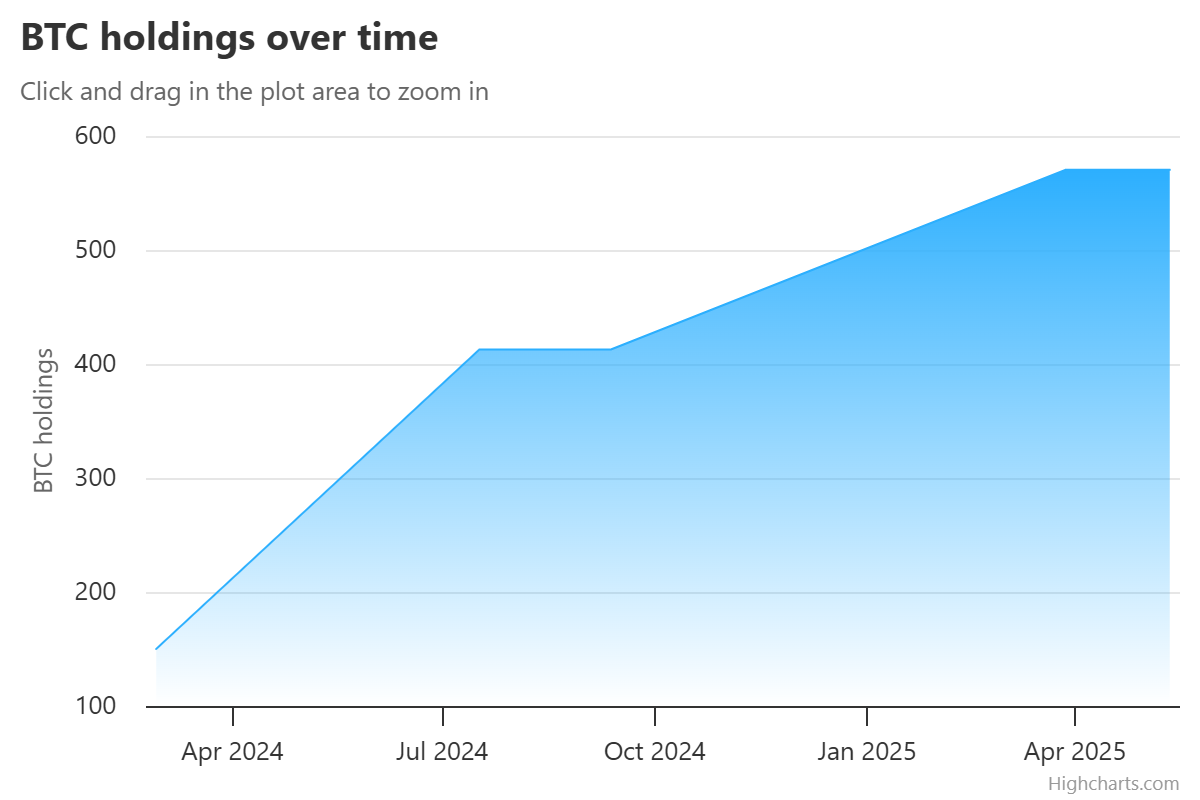
MercadoLibre is not a pure crypto play, but Mercado Pago (its fintech arm) has become one of the most important financial rails in LATAM. The company holds around 570 BTC on its balance sheet as a hedge against regional inflation, and has issued its own US dollar-pegged stablecoin, Meli Dólar.
Full year 2025 net revenue from Mercado Pago reached $12.6 billion, up 46% year-on-year, while total payment volume hit $278 billion, up 41%. Fintech monthly active users have grown close to 30% for ten consecutive quarters, and the credit portfolio nearly doubled to $12.5 billion year-on-year.
The catch for MercadoLibre is profitability. Overall margin compression of 5–6% is attributed to persistent investments in free shipping, credit card expansion, first-party commerce, and cross-border trade.
The stock has declined around 14.5% over the past six months, with the market repricing the stock around what management has framed as a deliberate investment phase heading into 2026.
The longer-term case remains compelling. Mercado Pago has introduced crypto-asset management and insurance products across its core markets, positioning it less as an e-commerce company and more as a full-scale digital bank with crypto infrastructure built in.
What to watch
- Mercado Pago loan loss trends and credit portfolio quality.
- Stablecoin integration and crypto volume through its payment network.
- Whether the Argentina credit card launch can reach profitability.
3. Méliuz (B3: CASH3.SA)
Fintech/Bitcoin treasury · Brazil's first listed Bitcoin treasury company
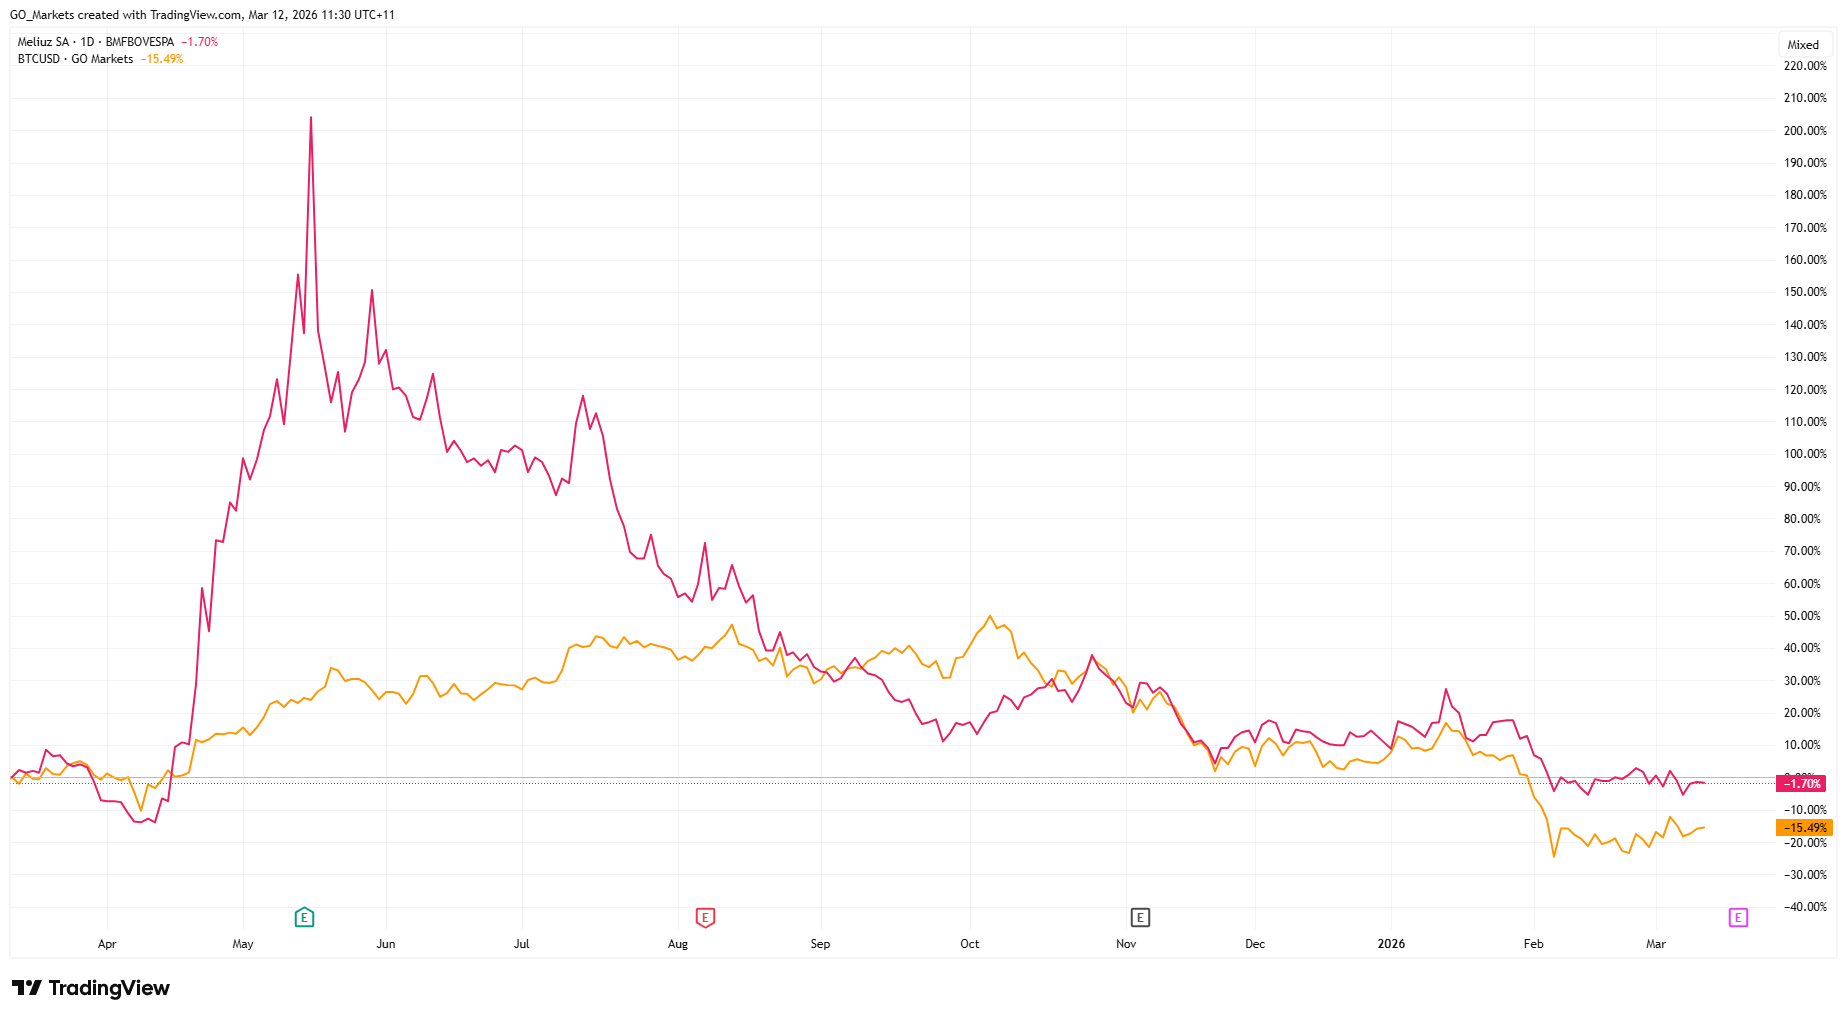
Méliuz is the most direct equity expression of the corporate Bitcoin treasury trend in LATAM. In early 2025, Méliuz became the first publicly traded company in Latin America to formally adopt a Bitcoin treasury strategy, receiving shareholder approval to allocate cash reserves toward Bitcoin accumulation.
Rather than issuing cheap dollar-denominated debt to buy BTC, Méliuz uses share issuance and operational cash flow. The company also sells cash-secured put options on Bitcoin to generate yield, a playbook borrowed from Japanese Bitcoin treasury firm Metaplanet, keeping 80% of BTC holdings in cold storage
CASH3 essentially acts as a leveraged vehicle for BTC exposure, capturing upside intensely in bull cycles, but generating greater volatility on the way down, especially where debt is involved.
The stock surged approximately 170% in May 2025 following the announcement of the Bitcoin strategy. However, it has since pulled back to its April 2025 levels, broadly tracking Bitcoin's price action and highlighting the stock's volatility.
What to watch
- Bitcoin price direction.
- BTC per share metric.
- Expansion of yield-generation strategies
- Any moves to list shares internationally.
4. OranjeBTC (B3: OBTC3.SA)
Pure-play Bitcoin treasury · LATAM's largest corporate Bitcoin holder
Where Méliuz is a fintech business that also holds Bitcoin, OranjeBTC is the opposite: a company whose entire purpose is Bitcoin accumulation.
The company listed on B3 in October 2025 through a reverse merger with education firm Intergraus, marking Brazil's first public debut of a firm whose business model centres entirely on Bitcoin accumulation.
OranjeBTC currently holds over 3,650 BTC and raised nearly $385 million in Bitcoin, with backing from notable investors including the Winklevoss brothers, Adam Back, FalconX, and Ricardo Salinas.
Its $210 million financing round was led by Itaú BBA, the investment arm of Brazil's largest bank, in a significant vote of institutional confidence.
In 2026, OBTC3 has fallen around 32% year-to-date, making it the hardest-hit of the two Brazilian Bitcoin treasury stocks. The stock hit an all-time high of 29.00 BRL on its listing day (October 7, 2025) and an all-time low of 6.06 BRL in February 2026.
It currently trades around 7.06 BRL, a steep discount to its debut, but one that closely mirrors Bitcoin's own pullback from peak levels.
OranjeBTC is the most volatile name on this list and should be treated as a high-beta Bitcoin vehicle. Liquidity is thinner than established names.
What to watch
- Bitcoin per share trajectory.
- Any capital raises or new BTC purchases.
- Potential international listing ambitions.
- How the market-value net asset value (mNAV) discount/premium evolves relative to Bitcoin's price.
5. Hashdex — HASH11 (B3: HASH11)
Crypto Asset Management · Brazil's leading crypto ETF issuer
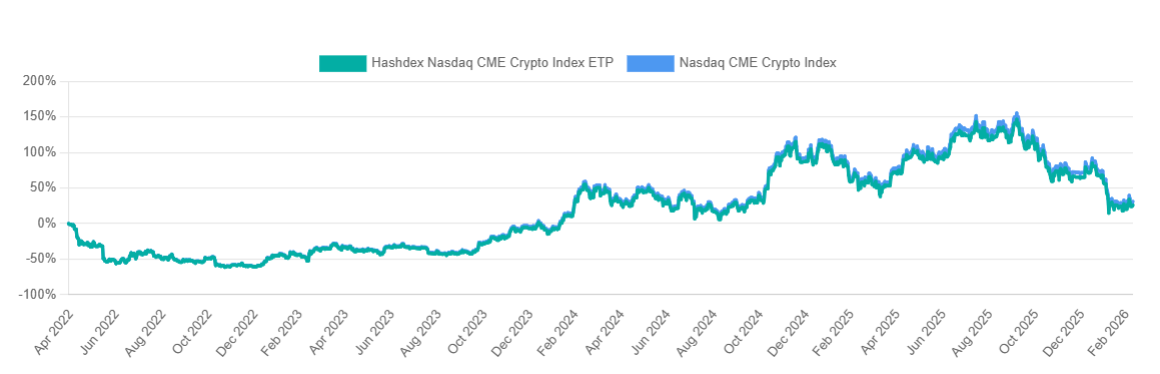
Hashdex offers a different kind of exposure to crypto. Rather than a single company's balance sheet or business strategy, HASH11 is a diversified basket of crypto assets wrapped in the familiarity of a regulated Brazilian ETF structure.
Brazil hosts 22 ETFs offering full or partial exposure to crypto assets, with Hashdex funds attracting 180,000 investors and daily transaction volumes averaging R$50 million.
Hashdex launched the world's first spot XRP ETF (XRPH11) on Brazil's B3 in April 2025, tracking the Nasdaq XRP Reference Price Index and allocating at least 95% of net assets to XRP.
The company also operates single-asset ETFs for Bitcoin (BITH11), Ethereum (ETHE11) and Solana (SOLH11), alongside its flagship HASH11 multi-asset index fund.
In mid-2025, Hashdex launched a hybrid Bitcoin/Gold ETF (GBTC11) that dynamically adjusts allocations between the two assets.
For investors who want diversified crypto market exposure rather than single-asset risk, HASH11 is the most accessible on-ramp through Brazil's regulated equity infrastructure.
However, as a multi-asset crypto index, HASH11 is still subject to the broad performance of digital asset markets. And unlike the equity names on this list, there is no operating business creating independent value.
What to watch
- Crypto market sentiment broadly.
- Potential expansion of Hashdex products into the US market.
- AUM growth as institutional adoption accelerates in Brazil.
- Relative performance of HASH11 vs single-asset alternatives.
What to watch next
Institutional infrastructure is still in early innings — Deutsche Börse's Crypto Finance Group entered LATAM in early 2026, and local exchanges have opened over 200 BRL-denominated trading pairs since 2024. The pace of that buildout will set the tone for all five names.
Regulatory progress in Brazil, Mexico, and Chile is the key enabler for the next wave of capital. Any setbacks would hit the higher-beta names like OBTC3 and CASH3 hardest.
Stablecoin volume is the region's most reliable real-time signal. Despite a global slowdown in early 2025, LATAM still recorded $16.2 billion in trading volume between January and May, up 42% year-on-year. Watch whether that momentum holds — a reacceleration lifts all five; a reversal pressures them equally.

From AI infrastructure to pet care, semiconductors, and gold exploration, here are the five top candidates most likely to list on the ASX in 2026.
What is an Initial public offering (IPO)?
1. Firmus Technologies
Firmus Technologies is building AI-powered data centre infrastructure in Tasmania, and it may be one of the most strategically positioned tech companies in Australia right now.
Firmus is an Nvidia Cloud Partner and has joined the GPU maker's Lepton marketplace. The company has designed its modular, liquid-everywhere AI Factory platform to evolve with Nvidia's latest architectures, including Nvidia Spectrum-X Ethernet networking.
A September 2025 raise of A$330m closed at a post-money valuation of A$1.85 billion for the company. By November 2025, after a further A$500m raise, that valuation had trebled to approximately A$6 billion.
A subsequent A$100m investment from Maas Group in early 2026 confirmed the November valuation. Firmus is reported to be contemplating an ASX IPO within the next 12 months and, given the A$6 billion private valuation, any public raise is expected to be well above A$1 billion.
With Australia's growing demand for sovereign AI compute capacity and Tasmania's cool climate and renewable energy advantage for large-scale data centre operations, Firmus stands as one of the largest-scale ASX IPO candidates in 2026.
However, although market interest in Firmus appears to be growing, timing is everything when it comes to IPOs. Watch for confirmation of exact IPO timing, AI data centres sentiment, and whether Nvidia signals deepening its involvement as a strategic anchor investor post-listing.
2. Rokt
Sydney-founded Rokt has quietly become one of Australia's most valuable private tech companies. The e-commerce adtech platform aimed at helping brands monetise the “transaction moment” is now valued at ~US$7.9 billion.
A term sheet prepared by MA Financial projected an exit share price of US$72 under base-case scenarios, when shares are freed from escrow in November 2027.
Rokt is expected to potentially dual-list in the US and on the ASX in 2026, possibly as soon as the first half of the year. IG The most widely discussed structure is a primary Nasdaq listing with an ASX CDI (CHESS Depositary Interest) structure for Australian investors, rather than a full dual listing.
Rokt’s revenue for the year ending August 2025 is projected at US$743m (up 48% year-over-year), with EBITDA forecast at US$100m and a gross profit margin of approximately 43%. It is currently projected to cross the $US1 billion annual revenue milestone by August 2026.
Amazon, Live Nation, and Uber are all reported to be Rokt customers, and the company has expanded rapidly across North America and Europe.
Whether Rokt opts for a primary Nasdaq listing with an ASX CDI structure, or a full dual listing, could significantly affect liquidity and local investor access.
3. Greencross
Greencross, the business behind Petbarn, City Farmers, and Greencross Vets, is preparing to relist on the ASX after being taken private by US private equity firm TPG in 2019.
TPG currently owns 55% of Greencross, while AustralianSuper and the Healthcare of Ontario Pension Plan (HOOPP) hold the remaining 45%.
The company reported revenue of A$2 billion for the 2025 financial year, a modest increase from A$1.95 billion in 2024. TPG paid A$675 million in equity value for the business in 2019; it sold a 45% stake in 2022 at a valuation of more than A$3.5 billion. The proposed IPO implies a valuation of more than A$4 billion.
TPG is targeting an initial public offering of at least A$700 million. The IPO will mark Greencross's return to the ASX after an eight-year absence. TPG's relatively small raise size suggests the firm is banking on strong aftermarket performance before fully exiting.
TPG's exit timeline announcement is still a watch for whether a 2026 IPO is on the cards. And whether the company pursues a traditional IPO or a trade sale, which remains an alternative path.
4. Morse Micro
Morse Micro is a Sydney-based semiconductor company developing Wi-Fi HaLow chips designed for IoT applications across agriculture, logistics, smart cities, and industrial monitoring.
Morse Micro held a Series C round in September 2025, raising US$88 million, followed in November 2025 by a US$32 million pre-IPO raise, taking total funding to over A$300 million.
It is targeting an ASX listing in the next 12–18 months. The Series C was led by Japanese chip giant MegaChips and the National Reconstruction Fund Corporation.
Global IoT device connections forecast to exceed 30 billion by 2030, and Morse Micro would be a rare ASX-listed pure-play semiconductor company, which could attract significant interest from tech-focused fund managers.

Morse Micro’s Revenue traction with tier-one hardware partners ahead of listing is a watch, and whether the company seeks a concurrent US listing given the depth of US semiconductor investor appetite.
5. Bison Resources
Bison Resources is a newly incorporated US-focused gold and precious metals explorer currently in the middle of its ASX IPO.
The offer closes on 20 March 2026, with an ASX listing targeted for mid-April 2026. At an indicative market capitalisation of A$13.25 million on full subscription, Bison is the most speculative name on this list by a significant margin.
The company holds four exploration projects in north-east Nevada, within the Carlin Trend (one of the world's most prolific gold-producing belts), responsible for approximately 75% of US gold output.
The IPO seeks to raise A$4.5 to A$5.5 million (22.5 to 27.5 million shares at A$0.20 per share). The team has prior experience at Sun Silver (ASX: SS1) and Black Bear Minerals, giving it a track record in ASX junior mining listings out of Nevada.
Global IPOs: What are the biggest IPOs happening globally in 2026?
Bottom line
Australia's 2026 IPO calendar spans the full risk spectrum. A Nvidia-backed AI infrastructure play, a billion-dollar e-commerce platform, and a junior gold explorer with its IPO already underway.
Each candidate reflects a different stage of maturity and a different investor profile. Together, they suggest the ASX could see a meaningful injection of new listings across sectors that have been largely absent from the local market in recent years.

Oil prices tend to rise when demand is strong, supply is constrained or geopolitical events disrupt normal trade flows. In this case, the US and Israel appeared to act pre-emptively in what they saw as a defensive move. The broader market impact has been felt more widely.
When oil prices move, they rarely move in isolation. Higher crude prices can affect inflation, central bank expectations, shipping costs and corporate margins across the global economy.
What is happening
There are three broad ways companies can benefit from higher oil prices:
1. Producing oil and gas, by selling the commodity at a higher price
2. Providing services and equipment to producers
3. Transporting oil around the world
Each of the stocks below represents one of those exposure types, with a different risk profile when crude climbs.
1. Exxon Mobil (NYSE: XOM)
Exxon Mobil is one of the world’s largest integrated oil companies, involved in everything from exploring for and producing oil to refining it into fuel and producing chemicals. When oil prices rise, its upstream business may benefit from wider margins, while its size and diversification can help cushion weaker spots in the cycle.
Exxon has major positions in growth regions such as the US Permian Basin and large offshore projects, which are designed to deliver relatively low-cost barrels over many years. When prices are high, low-cost production may support free cash flow and the company’s capacity for dividends, buybacks or further investment.
Exxon Mobil (XOM) vs. Brent Crude 6-month performance

Consensus: Buy
According to TradingView, analyst sentiment towards Exxon is broadly positive, with a consensus Buy rating. Of the 31 analysts tracked, 15 rate the stock as Strong Buy or Buy, while 13 rate it Hold.
The positive view is linked to Exxon’s balance sheet strength and higher-margin production, with the most optimistic analysts projecting a 1-year price target as high as US$183.00. However, a small minority of 3 analysts has issued a Sell or Strong Sell rating, contributing to an average price target of US$145.00, which sits about 3.6% below the current trading price.

2. Chevron (NYSE: CVX)
Chevron is another global integrated major that has benefited from the recent move higher in crude, with its shares trading near 52-week highs. Like Exxon, Chevron operates across the value chain, including upstream production, refining and marketing. Chevron’s completed acquisition of Hess adds Guyana and other upstream assets, which some analysts see as supportive over time, although the earnings impact remains subject to integration, project execution and commodity-price risks.
In an environment where oil and gas prices can be volatile, that diversification may help smooth earnings while still providing leverage to stronger energy prices.
Exxon Mobil vs Chevron performance, 6-month chart

Consensus: Buy
Chevron is viewed similarly to Exxon, with broker sentiment remaining broadly constructive. Recent TradingView aggregates show 30 analysts covering the stock over the past three months, with 17 rating it Strong Buy or Buy, 11 at Hold, 1 at Sell and 1 at Strong Sell. Analysts have highlighted its diversified portfolio and the potential contribution from Hess, although commodity-price volatility and execution risks may keep some more cautious.

3. SLB (NYSE: SLB)
Higher oil prices do not only affect producers. In this case, SLB (formerly Schlumberger) is one of the world’s largest oilfield services companies, providing technology, equipment and services that help producers find and extract hydrocarbons more efficiently. When crude trends higher, producers may increase drilling and completion activity, which can lift demand for SLB’s services and software. Recent commentary has also pointed to the company’s growing digital business and global exposure, which may support earnings growth if the upcycle continues.

Consensus: Buy
According to TradingView, analyst consensus on SLB is Buy, indicating broadly positive sentiment. Of the 33 analysts tracked, 27 rate the stock Strong Buy or Buy, while 4 rate it Hold and 2 rate it Sell or Strong Sell.
Analyst sentiment appears to reflect expectations around SLB’s position as a broader technology partner. The average price target of US$55.71 implies 15.8% upside from current levels, while the highest target stands at US$74.00. These forecasts appear to be linked to expectations of increased international drilling activity and a recovery in offshore deepwater markets.

4. Baker Hughes (NYSE: BKR)
Baker Hughes is another major oilfield services and equipment provider, with additional exposure to industrial segments such as LNG and power infrastructure. Even when oil prices are not at extreme highs, advances in drilling technology and lower break-even costs have helped keep many shale plays profitable, supporting demand for its services.
The company has been described as well positioned because of its balance sheet and its exposure to ongoing exploration and production activity. In a period of higher, or even stable-to-firm, oil prices, that mix of services and energy technology may create several revenue drivers.
Consensus: Strong Buy
Broker sentiment towards Baker Hughes is broadly positive, similar to SLB. More than 75% of covering analysts rate the stock as a Buy or Strong Buy, with the remainder generally at Hold. Analysts have pointed to its exposure to both traditional oilfield services and energy and industrial technology, including LNG infrastructure.
[CHART]
Transport and shipping exposure
5. Global oil tanker operators
Oil tanker companies can benefit when higher prices, OPEC+ policy shifts and geopolitical tensions increase long-distance shipments and disrupt usual routes.
Recent reports have pointed to stronger freight rates and high volumes of oil in transit, as increased production from the Middle East and supply growth from the US, Brazil, Guyana and Canada flow towards Asian markets. That ‘tonne-mile’ demand may support tanker day rates and profitability even when the broader energy market is volatile.
Consensus: N/A
This is a broader industry category rather than a single publicly traded stock, so there is no single broker consensus for it. Analyst views would need to be assessed at the company level, such as Frontline plc (FRO), Euronav (EURN) or Scorpio Tankers (STNG). More broadly, the sector is often viewed as cyclical, although current conditions may support freight rates when geopolitical disruptions lengthen shipping routes.
6. Woodside Energy (ASX: WDS)
Woodside adds an Australia-based name with global LNG and oil exposure. Its 2024 full-year results showed underlying profit down 13%, primarily because of lower realised oil and gas prices, according to the company’s full-year results announcement. That highlights how sensitive earnings can be to commodity price realisation.
If crude and related energy prices strengthen, Woodside’s earnings outlook may improve, although the extent of that change will still depend on company-specific factors and realised pricing.
Consensus: Hold
In contrast to the larger US majors, broker sentiment towards this Australian-based producer is more cautious, with consensus generally at Hold. Most analysts favour maintaining existing positions rather than increasing exposure. That more measured view is often linked to its LNG pricing exposure, softer realised commodity prices and longer-term regulatory and decarbonisation pressures.
[CHART]

Risks and constraints
Higher oil prices are not a free ride for these stocks.
- If prices spike too far, too fast, they may trigger demand destruction and policy responses that weigh on future profits.
- Political decisions from OPEC+ or major producers mau reverse a rally by increasing supply.
- Services and tanker companies are highly cyclical. When the cycle turns, pricing power can fade quickly.
In other words, these names may benefit from higher oil prices, but they also carry sector-specific, geopolitical and company-level risks that deserve close attention.
Key market observations
- Higher oil prices often support integrated majors such as Exxon and Chevron through stronger upstream margins and diversified cash flows.
- Oilfield services stocks such as SLB and Baker Hughes may see stronger demand when producers increase drilling and completion activity.
- Tanker operators may benefit from higher freight rates when geopolitics and supply shifts increase long-haul shipments.
- These stocks can be volatile, so diversification and time horizon remain important during commodity upcycles.
References in this article to Exxon Mobil, Chevron, SLB, Baker Hughes, Woodside, tanker operators, analyst consensus ratings and price targets are included for general market commentary only and do not constitute a recommendation or offer in relation to any financial product or security. Third-party data, including consensus ratings and target prices, may change without notice and should not be relied on in isolation. Energy and shipping exposures are cyclical and can be materially affected by commodity price volatility, realised pricing, production changes, project execution, geopolitical disruptions, freight market conditions, regulatory developments and shifts in investor sentiment. Any views about potential beneficiaries of higher oil prices are subject to significant uncertainty.

Oil smashed US$100 a barrel as US-Israeli strikes on Iran shut down the Strait of Hormuz, triggering the biggest single-day crude spike since the Russian invasion of Ukraine.
Quick facts
- Brent Crude intraday peak: US$119.50/bbl (up ~50% in 10 days)
- Reported vessel traffic through the Strait of Hormuz fell to <20% of average
- Analysts estimate up to ~20% of global seaborne oil flows could be affected if disruption persists (largest since the 1956 Suez Crisis)
Why have oil prices spiked?
Oil markets woke up on 9 March 2026 to joint U.S.-Israeli strikes on Iranian oil depots that sent Brent crude to an intraday peak of US$119.50 a barrel (its highest level since the start of the Russia-Ukraine war) before settling back near US$90.
Iran's Revolutionary Guard has threatened to target any tanker transiting the Strait of Hormuz, collapsing vessel traffic to near-zero.
The strait carries roughly 20% of the world's daily seaborne oil supply, and analysts are describing the disruption as the largest since the Suez Crisis of 1956–57. Crude had already risen around 16% in the week before the strikes as markets priced in escalating tensions.
Middle East escalation: oil, VIX and volatility scenarios
ExxonMobil's chief economist, Tyler Goodspeed, has said the distribution of probable outcomes skews heavily toward the Strait remaining effectively closed for longer than markets currently expect.
Meanwhile, Donald Trump has played down the need to release strategic petroleum reserves, calling any short-term price pain a small cost for global safety. The G7 is discussing a coordinated SPR release, which briefly pulled prices back toward US$110 before late-session trading moved them lower on fresh Trump commentary about a potentially “swift end” to the conflict.
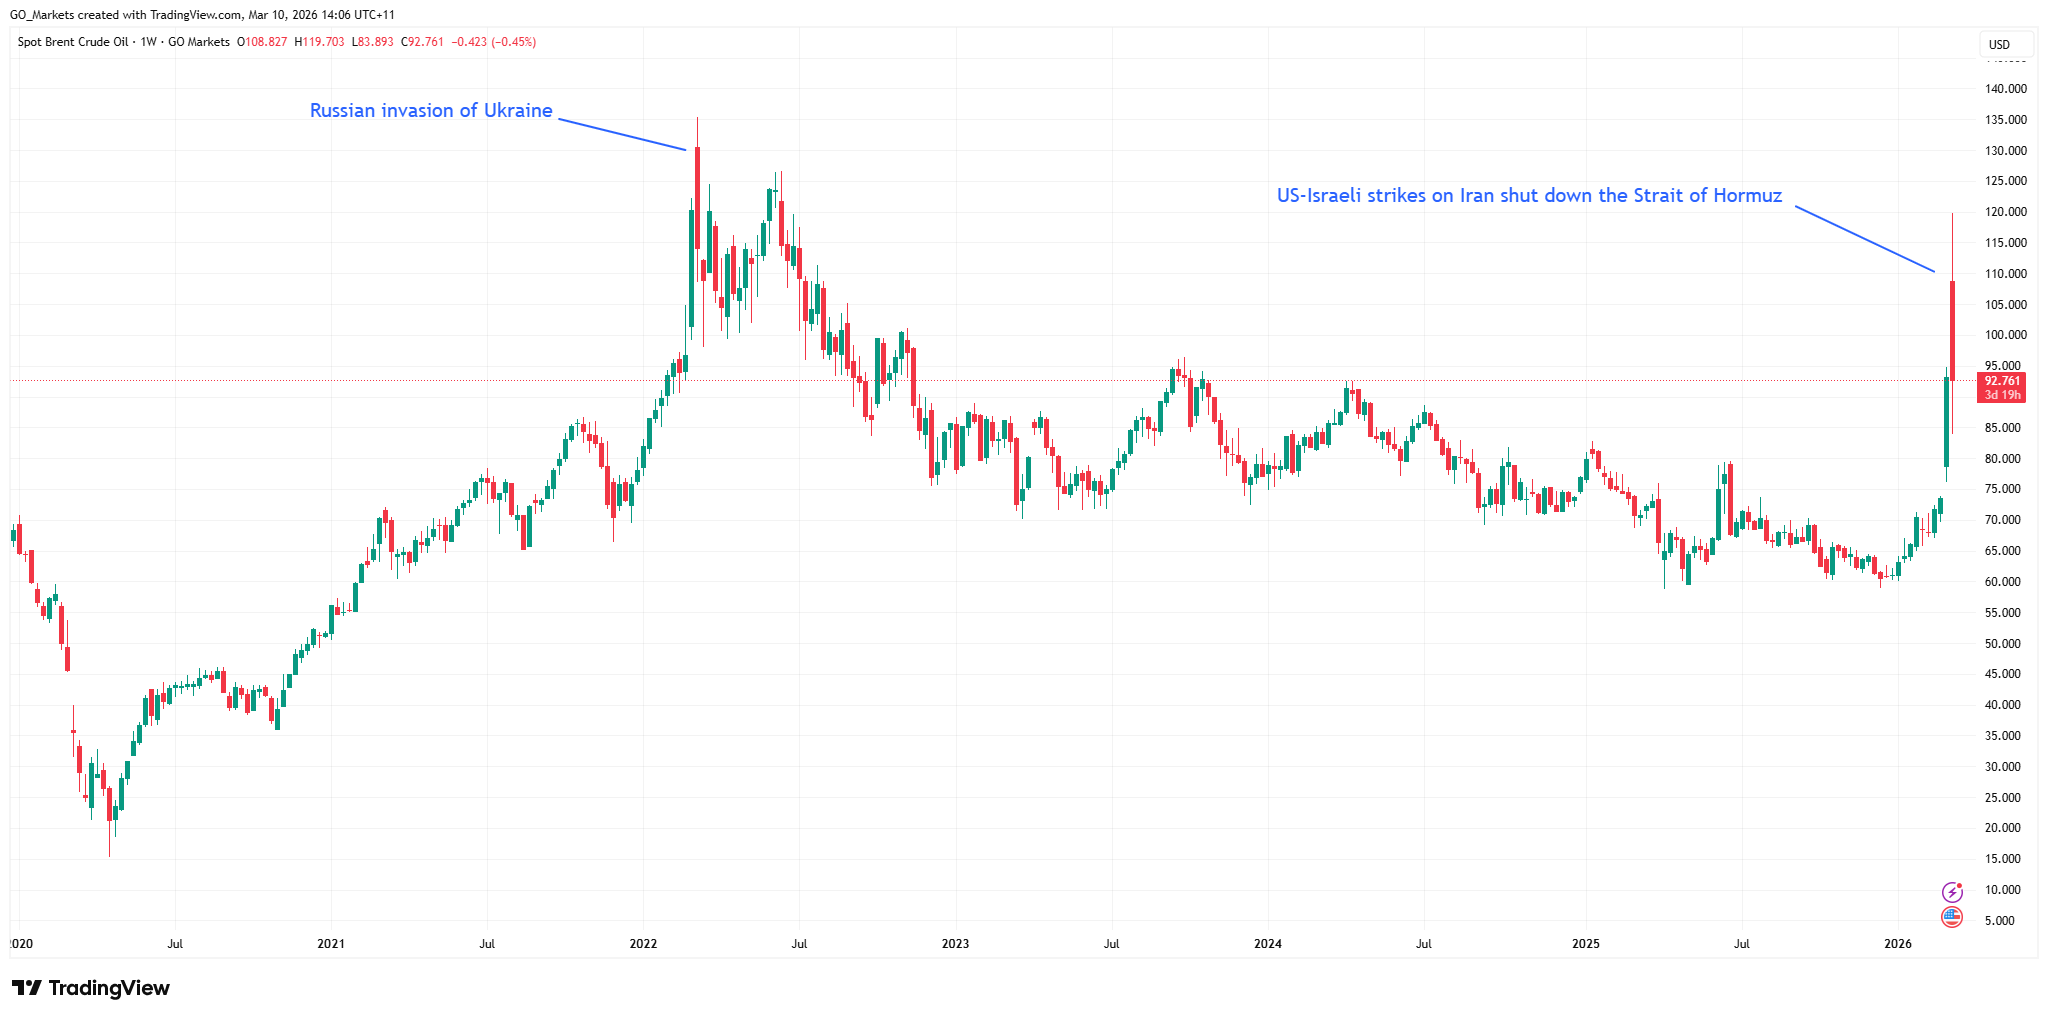
Biggest single day crude oil spike since 2022 | TradingView
Market Reaction
The ASX response has been sharply split. The broader ASX 200 fell as investors priced in inflation and potential demand destruction, with materials stocks like BHP sinking close to 6%. Energy was the only sector in the green. The IMF estimates that every sustained 10% rise in oil prices adds 0.4% to global inflation and reduces global growth by 0.15%.
If oil holds above US$100 for an extended period, recession risk in major importing economies could rise materially. ASX energy investors are navigating a world where the same tailwind for producers could become a headwind for global demand.
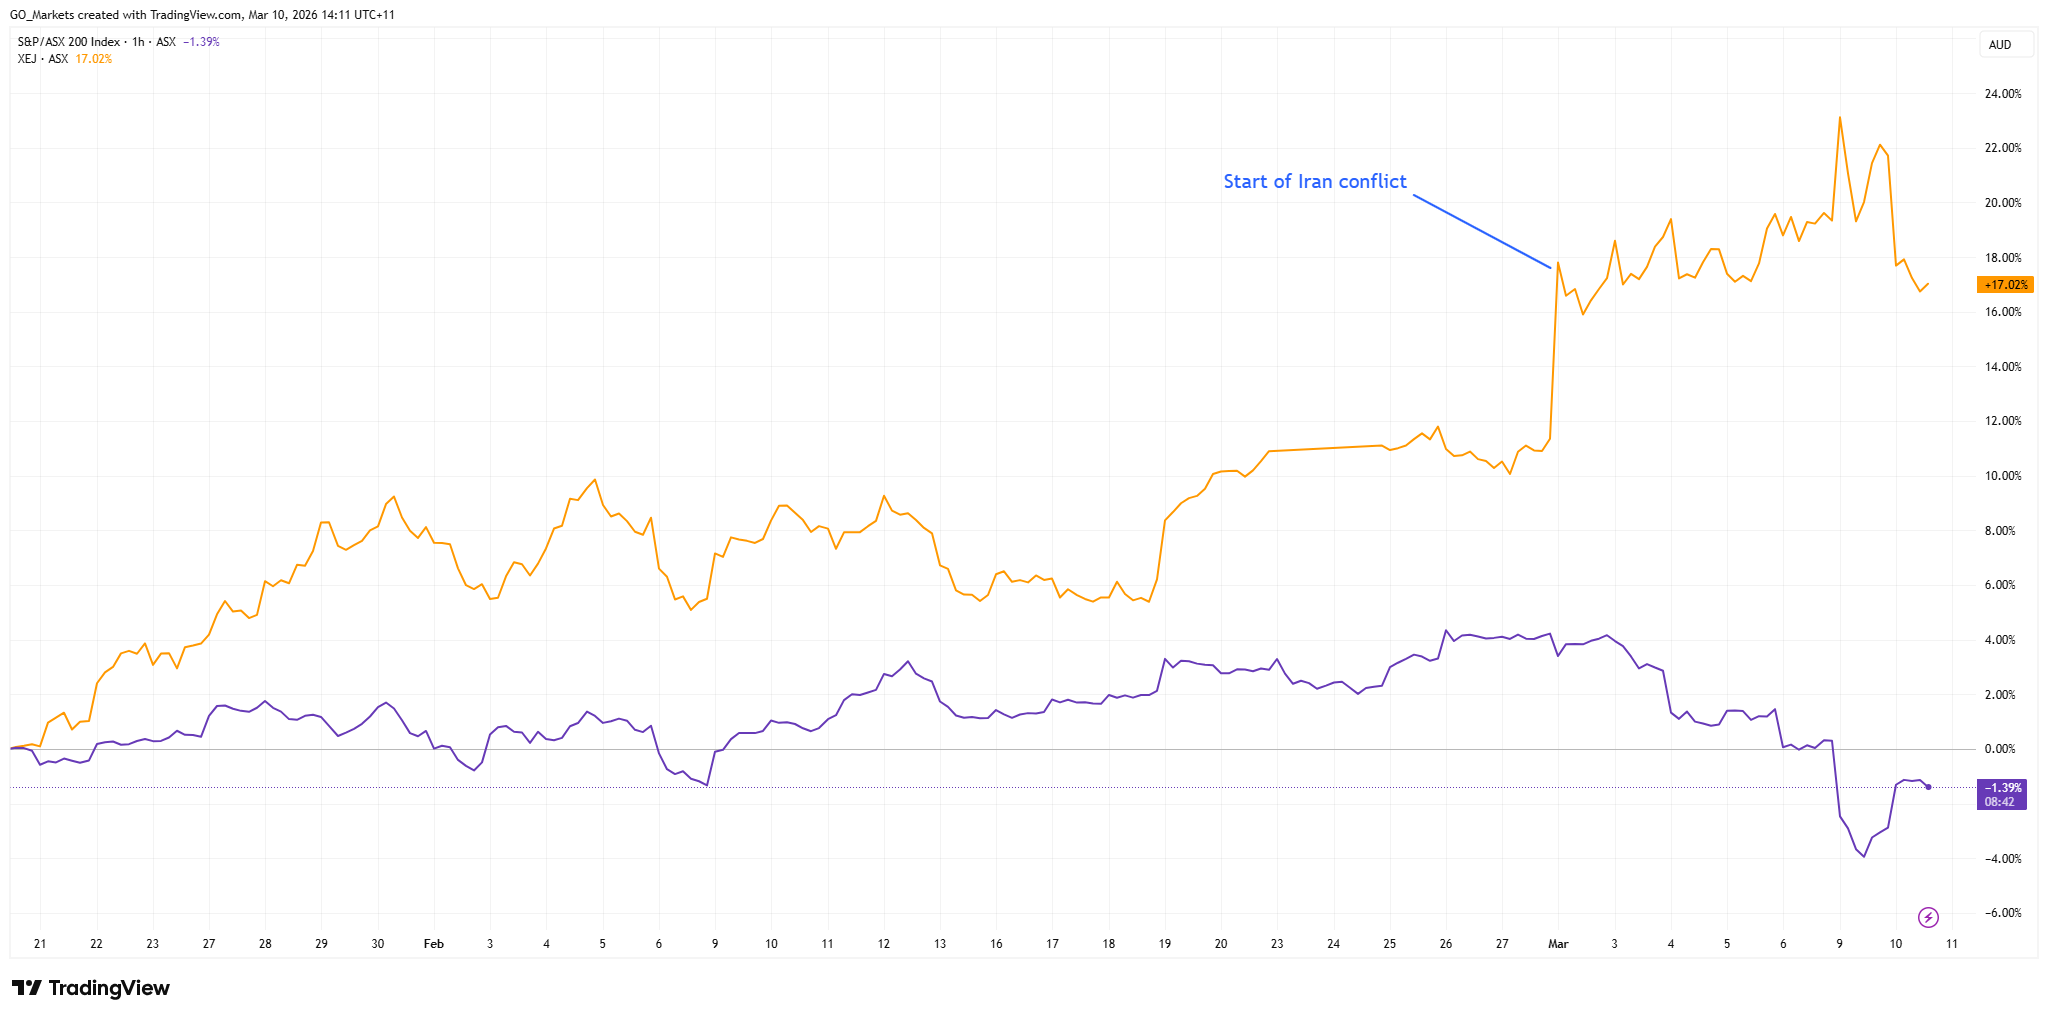
S&P/ASX 200 vs S&P/ASX 200 Energy Index | TradingView
Top 5 ASX energy stocks to watch
1. Woodside Energy Group (ASX: WDS)
Woodside is Australia’s largest listed oil and gas producer and is often closely watched when energy prices rise. Woodside operates Pluto LNG in the Pilbara with a 90% stake, the North West Shelf LNG project, and a growing international portfolio. Shares hit a fresh 52-week high and have risen 33% since January.
Fully franked dividends add yield support; the company recently paid an 83.4-cent-per-share final dividend. For cautious investors, Woodside is a potential entry point in the sector right now.
2. Santos Ltd (ASX: STO)
Santos is the ASX's second-largest oil and gas producer with a market cap of nearly A$23 billion, and it offers a compelling production growth story on top of the price tailwind.
The Barossa gas project shipped its first LNG cargo in January 2026, and production is expected to grow around 30% by 2027 as Barossa and the Pikka project in Alaska ramp up together.
CEO Kevin Gallagher sold A$5.6 million in stock in late February to cover personal tax obligations, which some investors have flagged as a caution signal, but the growth fundamentals remain intact.
3. Karoon Energy (ASX: KAR)
A mid-cap pure-play oil producer with 100% interests in the Bauna and Patola offshore oil fields in Brazil's Santos Basin, plus the Who Dat assets in the Gulf of Mexico, it was the biggest mover on the entire ASX 200 in recent sessions.
With a market cap near A$1.25 billion and a Price to Earnings (P/E) ratio of 7, the stock is extraordinarily sensitive to oil price movements. Karoon generated a free cash flow margin of approximately 45% against a base case of US$65 per barrel. At current prices, the cash flow profile could improve dramatically.
A new dividend of A$0.031 per share has been declared alongside 2026 production guidance. The risk is symmetrical: if the war premium fades and oil drifts back toward the mid-US$60s, the pullback could be as sharp as the rally.
4. Ampol Ltd (ASX: ALD)
Ampol is Australia's largest integrated fuel company, operating the Lytton oil refinery in Brisbane alongside a national fuel retail and distribution network and Z Energy in New Zealand.
Higher oil prices are a double-edged sword for Ampol. They improve crude inventory value and refining margins, but can compress consumer demand over time.
A planned A$1.1 billion acquisition of EG Australia's fuel and convenience network adds a structural growth catalyst independent of the oil price. A 100%-franked trailing yield of 3.2% could also provide income support.
5. Beach Energy (ASX: BPT)
Beach Energy has underperformed the broader ASX energy sector over the past year, weighed down by reserve replacement challenges and a difficult recent earnings period.
However, the company beat half-year FY2026 estimates by 13.5%, and management maintained full-year production guidance of 19.7–22.0 million barrels of oil equivalent.
Beach's asset base spans the Cooper and Eromanga Basins, the Otway Basin, the Perth Basin's Waitsia LNG export project, and New Zealand.
A 6.1% dividend yield with a payment due in March 2026, and the stock's low beta of 0.20 means it could offer materially less volatility than peers.
CEO Brett Woods has flagged M&A interest in East Coast gas assets and a target of 35% emissions intensity reduction by 2030. A sustained high-oil environment could arrest Beach's production decline trend.
What to watch next
Energy markets are moving on fear and geopolitics rather than fundamentals, which means the trade can reverse as fast as it started. The key question is whether this is a brief war premium or the start of a sustained structural disruption.
A prolonged Hormuz closure could push Brent even higher and keep ASX energy stocks elevated. A swift diplomatic resolution or coordinated G7 SPR release could snap oil back downwards and reverse much of the recent move.
Sitting over both scenarios is the question of recession: if oil holds above US$100 for six to eight weeks, markets may begin pricing in central bank responses and demand destruction, which could ultimately weigh on the Energy sector that is outperforming today.