
.jpg)
Bitcoin has now outlasted the peak of all its previous four-year cycles.
For over a decade, every Bitcoin cycle has followed the same sequence: consolidation, breakout, mania, crash. Rinse and repeat.
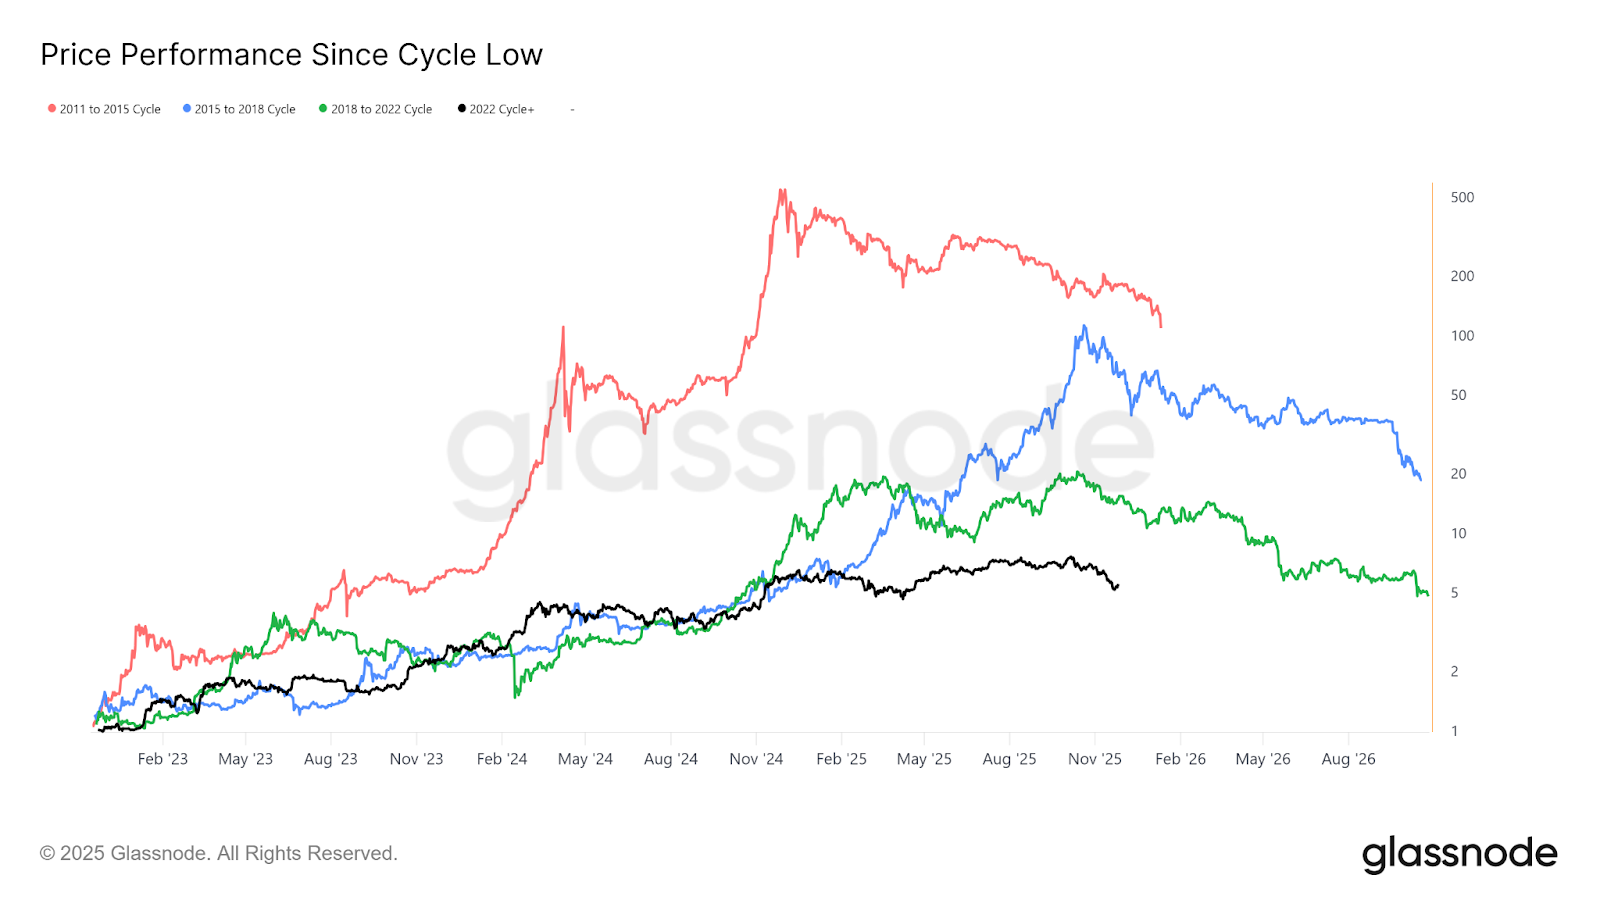
Timeline-wise, we should be at the post-mania inflection point, waiting for the seemingly inevitable crash.
Yet unlike previous runs, this cycle never saw its “mania phase.” Instead, Bitcoin has spent the past year grinding sideways, touching new all-time highs without a euphoric blow-off top that defined previous cycles.
The fact that this euphoria period never materialised brings into question whether this cycle still has room to run, or has the market simply matured past the point of mania-driven peaks?
The Historical Four-Year Pattern
The traditional Bitcoin cycle was simple. Every four years, a halving event would reduce the block reward (amount of new Bitcoin being created) by half, creating a supply shock that triggered major bull markets.
The 2013 cycle, the 2017 cycle, and the 2021 cycle all followed this script. Each halving was followed by a 3-to 9-month growth period, then a full-on mania period, before topping out 12 to 18 months after the event.
Following the most recent halving in April 2024, Bitcoin experienced five months of sideways consolidation, then hinted at making its anticipated breakout into mania after the US election… but quickly returned to sideways consolidation for the next year.
We have seen new ATHs and the price has made some notable gains during the period, but the overall momentum has been much weaker.
This failure to repeat the frenzies of the past three cycles has brought into question how much influence the Bitcoin halving truly has on the market anymore.
No Longer a Supply Shock
In previous cycles, the halving created a situation where prices had to rise to clear the same dollar amount of miner expenses (who were now earning half the Bitcoin).
Bitcoin miners would simply not sell until the price reached a certain level, creating a supply shock that would drive prices higher.

Miners still do this today; however, the market’s maturation and the institutional adoption of Bitcoin have dampened the impact.
Selling off Bitcoin is no longer a balancing act where miners hold influence over price. The market has deep liquidity that can handle significant flows in either direction.
Institutional ETFs routinely purchase more Bitcoin in a single day than miners produce in a month.
The supply reduction that once drove dramatic price movements is now easily absorbed by a market with institutional buyers providing constant demand.
If the Halving Isn't Driving Cycles, What Is?
The overriding narrative is that the Bitcoin cycle is now tied to the global liquidity cycle.
If you plot the Global M2 Money Supply versus Bitcoin on a year-on-year basis, you can see that every Bitcoin top has correlated with the peaks of Global M2 liquidity growth.
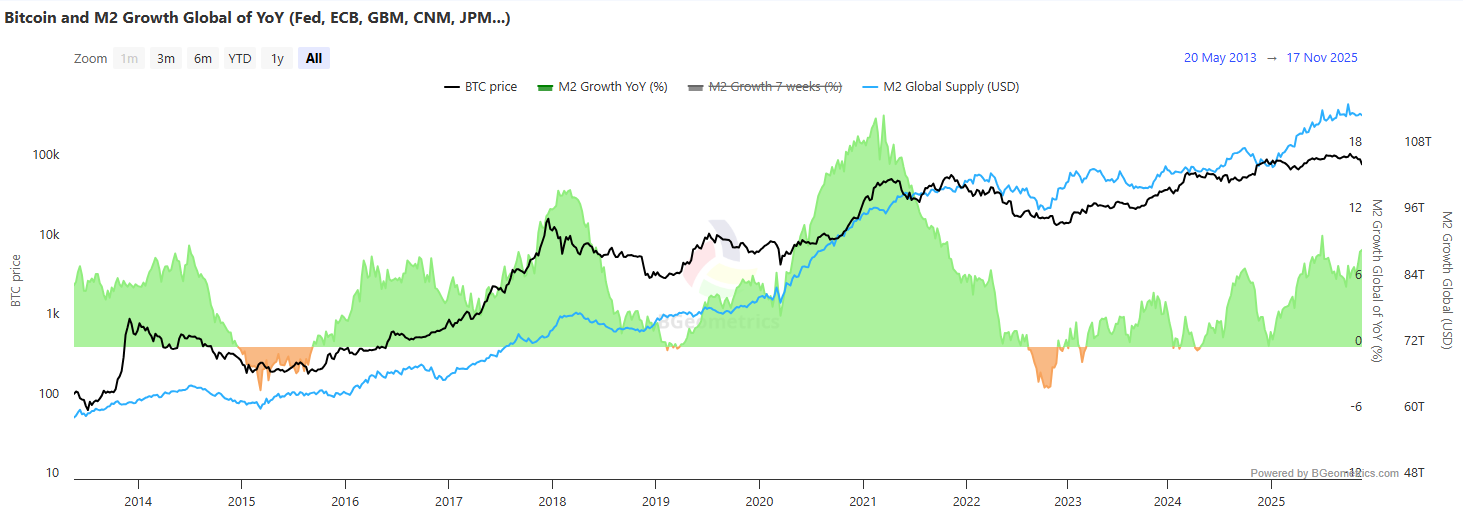
This isn't unique to Bitcoin. The Gold price has closely mirrored the rate of Global M2 expansion for decades.
When central banks flood the system with liquidity, capital tends to move into stores of value or high-risk assets. When they drain liquidity, those same assets tend to retreat.
However, this is a correlation; these relationships may change and should not be relied upon as indicators of future performance.
Is the Dollar Just Getting Weaker?
The U.S. Dollar Strength Index tells the other side of this liquidity story. Bitcoin versus the dollar year-on-year has been almost perfectly inversely correlated.
Simply put, as fiat currencies lose purchasing power, “hard” assets like Bitcoin and Gold start to appreciate. Not because of improved fundamentals, but because the currencies they are paired against are simply worth less.

The Self-Fulfilling Prophecy
Beyond the charts and patterns, there is also the psychological notion that the four-year cycle persists precisely because people believe it will.
People have been conditioned by three complete cycles to expect Bitcoin to peak somewhere between 400 and 600 days after a halving.
This collective belief shapes behaviour: traders take profits, investors take fewer risks, and retail enthusiasm wanes. The prophecy fulfils itself.
When everyone believes Bitcoin should peak 18 months after a halving, the combined selling pressure can create exactly that outcome — regardless of whether the underlying driver still exists.
The current market weakness, with Bitcoin dropping over 20% from its October record high, occurred almost precisely at this 18-month mark.
Is This Cycle Built Different?
Despite this on-cue sell-off, this cycle still has the potential to break away from the historical four-year pattern.
Increased ETF adoption by institutional investors has brought in higher quality and consistent ownership of Bitcoin.
Unlike retail traders, who often panic-sell during corrections, institutional holders tend to maintain their positions through volatility.
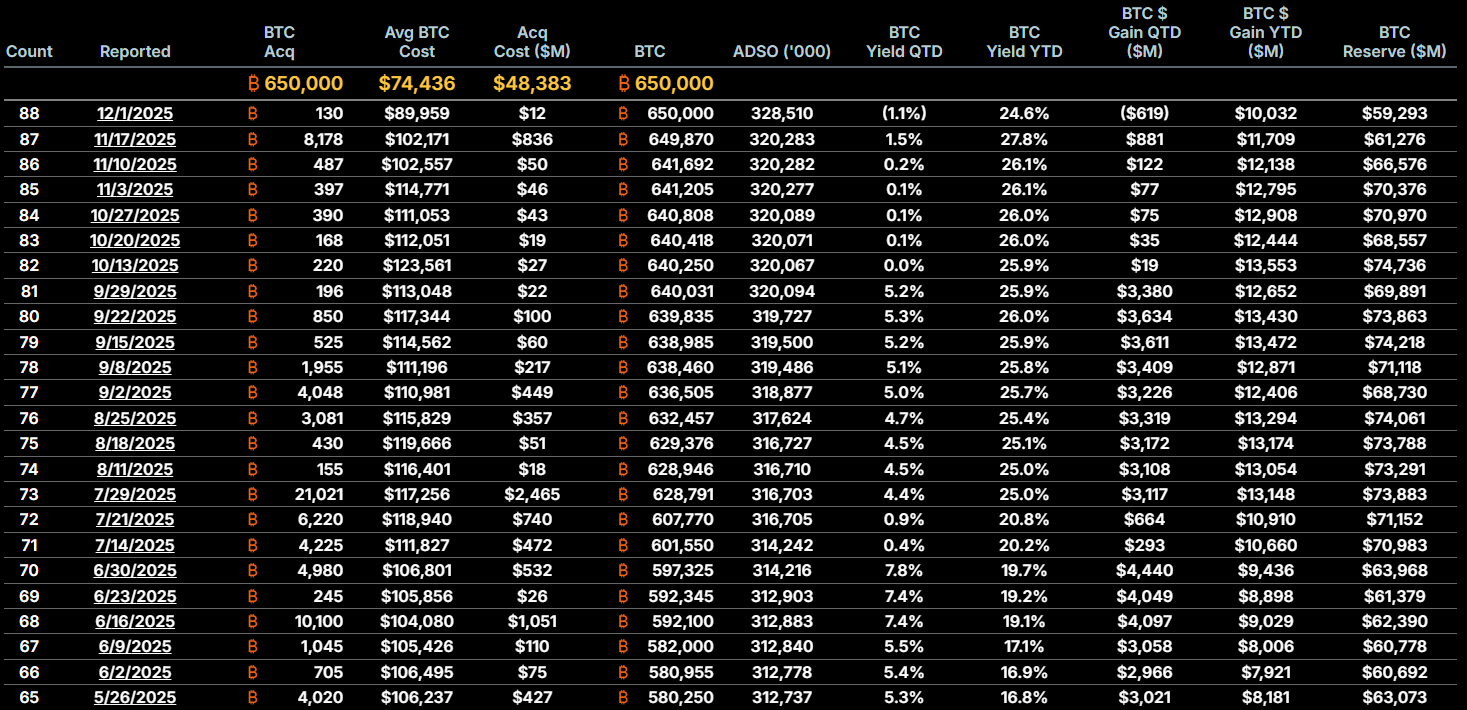
For example, Michael Saylor’s high-profile MicroStrategy fund has continued to purchase Bitcoin through market weakness. Recently reporting a purchase of 8,178 BTC at an average price of $102,171.
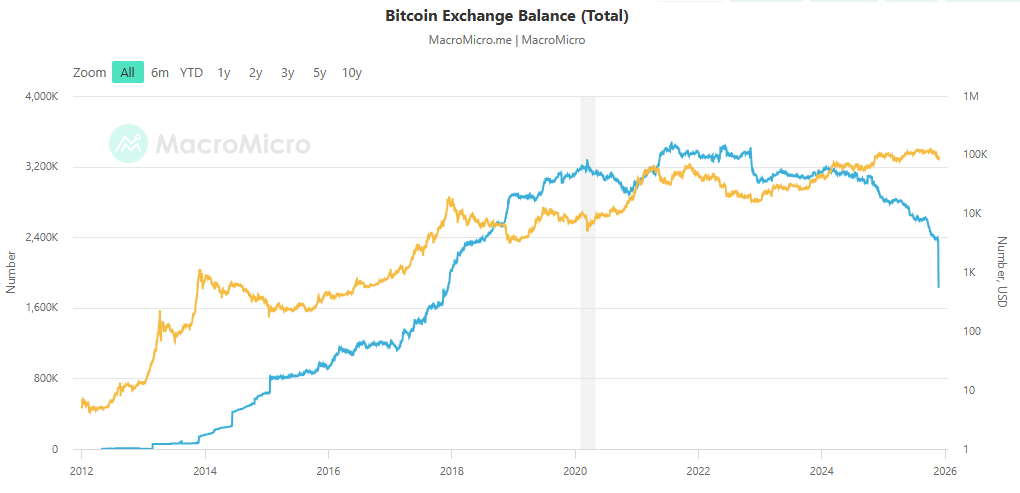
Another hard indicator that diverges from previous cycle peaks is the amount of Bitcoin being held on centralised exchanges.
The current amount of BTC on CEXs is unusually low. This pattern is generally seen closer to cycle lows, rather than peaks.
Other factors supporting the break of the four-year mould are coming out of the Whitehouse.
A comprehensive regulatory framework through the CLARITY Act represents structural changes and boundaries for regulatory bodies that didn't exist in previous cycles.
And the move to establish a Strategic Bitcoin Reserve will see all government-held forfeited Bitcoin (approximately $30 billion worth) transferred into a government reserve, signalling Bitcoin as a strategic asset like Gold and oil.

Bitcoin Has Finally Grown Up
The four-year cycle has been a useful heuristic, but heuristics break down when conditions change. Institutional buyers, regulatory clarity, and strategic reserves represent genuinely new conditions historical patterns don’t account for.
At the same time, dismissing the cycle entirely would be premature. The self-fulfilling aspect means it retains predictive power even if the original cause has weakened.
Market participants act on the pattern they've learned, and their actions create the pattern they expect.
Perhaps the real insight is that the Bitcoin market cycles never had just one cause. They were always the result of multiple overlapping forces — programmed scarcity, liquidity conditions, sentiment, self-reinforcing expectations.
The cycle shifts character as some forces strengthen and others weaken. But whether the forces have shifted enough to break the four-year trend is yet to be determined.
The fundamental indicators show this cycle may have some life, but the psychological power of the four-year pattern could push it to another, predictable end.
You can trade BTC and other popular Crypto CFD pairs on GO Markets with $0 swaps until 31 December 2025.

Reportingdates and release times are based on company investor relations calendars whereconfirmed. Where dates or times are not marked confirmed, they are GO Marketsestimates. Consensus EPS, revenue and analyst-range data are sourced fromBloomberg and Earnings Whispers, as at 09 July 2026 (AEST). Company guidance,backlog and operating metrics are sourced from the latest company filings orresults presentations, unless stated otherwise. Any scenario analysis reflectsGO Markets analysis. Figures and schedules may change without notice.
The information provided is of general nature only and does not take into account your personal objectives, financial situations or needs. Before acting on any information provided, you should consider whether the information is suitable for you and your personal circumstances and if necessary, seek appropriate professional advice. All opinions, conclusions, forecasts or recommendations are reasonably held at the time of compilation but are subject to change without notice. Past performance is not an indication of future performance. Go Markets Pty Ltd, ABN 85 081 864 039, AFSL 254963 is a CFD issuer, and trading carries significant risks and is not suitable for everyone. You do not own or have any interest in the rights to the underlying assets. You should consider the appropriateness by reviewing our TMD, FSG, PDS and other CFD legal documents to ensure you understand the risks before you invest in CFDs. These documents are available here.
Any references to Australian or international shares, sectors, indices, ETFs, crypto-related stocks or other instruments are provided for market commentary and watchlist purposes only and do not constitute a recommendation, offer or solicitation to buy, sell or hold any financial product or adopt any investment strategy. International markets may involve additional risks, including currency fluctuations, regulatory differences, market structure differences, reduced liquidity and higher volatility. Company-specific, sector-specific and macroeconomic risks may also affect performance.
Commentary on geopolitical developments, economic data, central bank decisions, earnings, policy changes and other global or financial market events is based on information available at the time of publication and may change without notice. Such events can lead to sudden market moves, price gaps, reduced liquidity, wider spreads and increased volatility, particularly in leveraged products such as CFDs. Forward-looking statements, expectations and scenario analysis are inherently uncertain and should not be relied on as guarantees of future market behaviour or outcomes.


.jpeg)


