What is an initial public offering (IPO)? How listings work and why they matter for traders
GO Markets
19/2/2026
•
0 min read
Share this post
Copy URL
From tech disruptors to defence contractors, some of the market's most talked-about companies start their public journey through an initial public offering (IPO). For traders, these initial public listings can represent a unique trading environment, but also a period of heightened uncertainty.
Quick facts
An IPO is when a private company lists its shares on a public stock exchange for the first time.
IPOs can offer traders early access to high-growth companies, but come with elevated volatility and limited price history.
Once listed, traders can gain exposure to IPO stocks through direct share purchases or derivatives such as contracts for difference (CFDs).
What is an initial public offering (IPO)?
An IPO is when a company offers its shares to the public for the first time.
Before performing an IPO, shares in the company are typically only held by founders, early employees, and private investors. Going public makes the shares available to be purchased by anyone.
Depending on the size of the company, it will usually list its public shares on the local stock exchange (for example, the ASX in Australia). However, some large-valuation companies choose to only list on a global stock exchange, like the Nasdaq, no matter where their main headquarters is located.
For traders, IPOs are generally the first opportunity to gain exposure to a company’s stock. They can create a unique environment with increased volatility and liquidity, but also carry heightened risk, given the limited price history and sensitivity to sentiment swings.
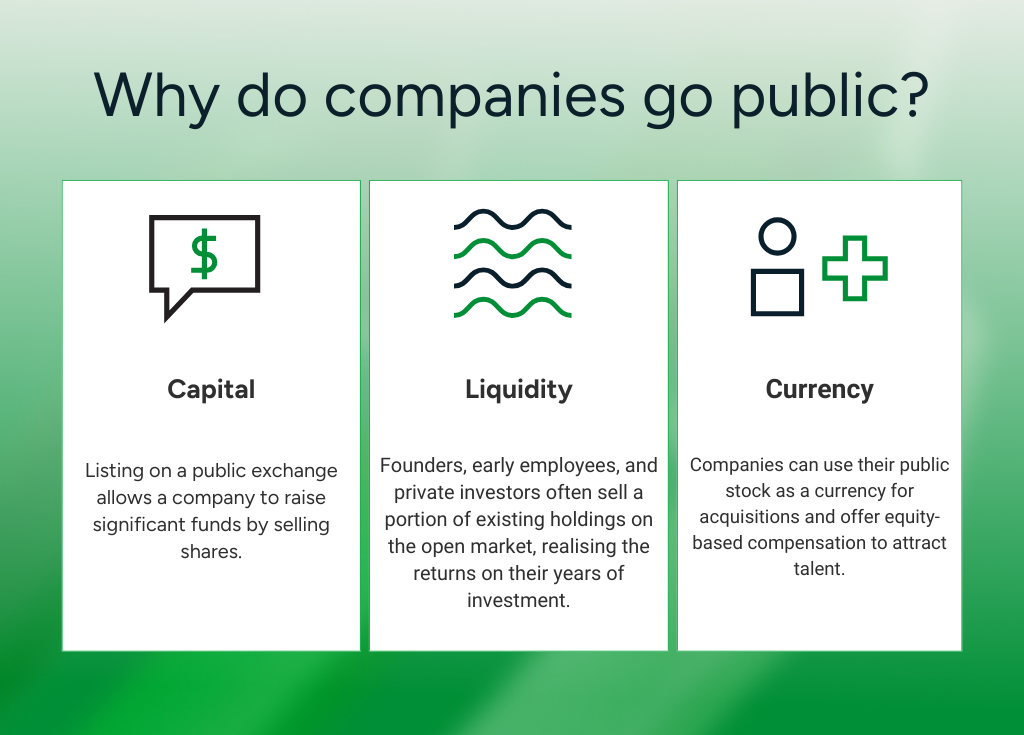
Why do companies go public?
The biggest driver to perform an IPO is to access more capital. Listing on a public exchange means the company can raise significant funds by selling shares.
It also provides liquidity for existing shareholders. Founders, early employees, and private investors often sell a portion of their existing holdings on the open market, realising the returns on their years of support.
Beyond the monetary benefits, going public means companies can use their stock as currency for acquisitions and offer equity-based compensation to attract talent. And a public valuation provides a transparent benchmark, which is useful for strategic positioning and future fundraising.
However, it does come with trade-offs. Public companies must comply with ongoing disclosure and reporting obligations, and pressure from public shareholders can become a barrier to long-term progress if many are focused on short-term performance.
While the specifics vary by jurisdiction, going from a private company to a public listing generally involves the following stages:
1. Preparation
The company first selects the underwriter (typically an investment bank) to manage the offering. Together, they assess the company's financials, corporate structure, and market positioning to determine the best approach for going public. It is the heavy planning stage to make sure the company is actually ready to go public.
2. Registration
Once everything is prepared, the underwriters conduct a thorough due diligence check and then lodge the required disclosure documents with the relevant regulator. These documents give a detailed disclosure to the regulator about the company, its management, and its proposed offering. In Australia, this is typically a prospectus lodged with ASIC; in the US, a registration statement filed with the SEC.
3. Roadshow
Executives at the company and underwriters will then present the investment case to institutional investors and market analysts in a “roadshow”. This showcase is designed to gauge demand for the stock and help generate interest. Institutional investors can register their interest and valuation of the IPO, which helps inform the initial pricing.
4. Pricing
Based on feedback from the roadshow and current market conditions, the underwriters set the final share price and determine the number of shares to be issued. Shares are allocated on the ‘primary market’ to investors participating in the offer (before the stock is listed publicly on the secondary market). This process sets the pre-market price, which effectively determines the company’s initial public valuation.
5. Listing
On listing day, the company’s shares begin trading on the chosen stock exchange, officially opening the secondary market. For most traders, this is the first point at which they can trade the stock, either directly or through derivatives such as Share CFDs.
6. Post-IPO
Once listed, the company becomes subject to strict reporting and disclosure requirements. It must communicate regularly with shareholders, publish its financial results, and comply with the governance standards of the exchange on which it is listed.
IPO risks and benefits for traders
How do traders participate in IPOs?
For most traders, participating in an IPO comes once shares have listed and begun trading on the secondary market.
Once shares are live on the exchange, investors can buy the physical shares directly through a broker or online exchange, or they can use derivatives such as Share CFDs to take a position on the price without owning the underlying asset.
The first few days of IPO trading tend to be highly volatile. Traders should ensure they have taken appropriate risk management measures to help safeguard against potential sharp price swings.
The bottom line
IPOs mark when a company becomes investable to the public. They can offer early access to high-growth companies and create a unique trading environment driven by elevated volatility and market interest.
For traders, understanding how the process works, what drives pricing and post-IPO performance, and how to weigh potential rewards against the risks of trading newly listed shares is essential before taking a position.
By
GO Markets
The information provided is of general nature only and does not take into account your personal objectives, financial situations or needs. Before acting on any information provided, you should consider whether the information is suitable for you and your personal circumstances and if necessary, seek appropriate professional advice. All opinions, conclusions, forecasts or recommendations are reasonably held at the time of compilation but are subject to change without notice. Past performance is not an indication of future performance. Go Markets Pty Ltd, ABN 85 081 864 039, AFSL 254963 is a CFD issuer, and trading carries significant risks and is not suitable for everyone. You do not own or have any interest in the rights to the underlying assets. You should consider the appropriateness by reviewing our TMD, FSG, PDS and other CFD legal documents to ensure you understand the risks before you invest in CFDs. These documents are available here. Any references to Australian or international shares, sectors, indices, ETFs, crypto-related stocks or other instruments are provided for market commentary and watchlist purposes only and do not constitute a recommendation, offer or solicitation to buy, sell or hold any financial product or adopt any investment strategy. International markets may involve additional risks, including currency fluctuations, regulatory differences, market structure differences, reduced liquidity and higher volatility. Company-specific, sector-specific and macroeconomic risks may also affect performance.
With the Iran conflict reshaping energy markets, central banks turning hawkish, and gold in freefall despite the chaos, the safe haven playbook in 2026 is more complicated than ever.
Quick facts
Gold has fallen more than 20% from its all-time high, despite an active war in the Middle East
The Singapore dollar is near its strongest level against the USD since October 2014
The Reserve Bank of Australia (RBA) hiked rates to 4.10% in March 2026 as Iran-driven oil prices push Australian inflation higher
1. Gold (XAU/USD)
Gold remains the most widely traded safe haven globally. It benefits from geopolitical stress, US dollar weakness, and negative real interest rate environments. However, its short-term behaviour in 2026 demands explanation.
Despite an active war in the Middle East, gold has sold off sharply. The likely cause is the Fed trimming its 2026 rate cut projections, citing hotter-than-expected producer inflation and Strait of Hormuz-driven oil prices creating inflation persistence.
Ultimately, gold's bull case rests on falling real yields and a weaker dollar, and right now neither condition is in place. Traders should be aware that during an inflationary supply shock like the one the Iran conflict has delivered, gold does not always behave as expected.
However, if you zoom out, the longer-term picture reinforces gold’s safe-haven status, ending 2025 as one of its strongest years on record.
Key variables to watch: US Federal Reserve guidance, real yields, and USD direction.
2. Japanese Yen (JPY)
The yen has long functioned as a safe-haven currency thanks to Japan's status as the world's largest net creditor nation. In times of stress, Japanese investors tend to repatriate capital, driving the yen higher.
However, that dynamic seems to have shifted in 2026 so far. The yen is down 6.63% YoY, near its weakest level since July 2024, and surging oil import costs are weighing on the currency.
The yen's safe-haven role has not disappeared, though. It tends to reassert itself during sharp equity selloffs and liquidity events. But in an oil-driven inflation shock, it faces structural headwinds.
Key variables to watch: BOJ rate decisions, US-Japan yield differentials, and any intervention signals from Japanese authorities.
3. Swiss Franc (CHF)
Switzerland's political neutrality, account surplus, and strong institutional framework make the franc a reflexive safe-haven currency. Unlike the yen, the CHF is holding up in the current environment, with the franc gaining against the dollar in 2026, and EUR/CHF remaining stable.
For traders across Europe and the Middle East, CHF is often the first port of call during stress events.
Key variables to watch: Swiss National Bank intervention language, European geopolitical developments, and global risk indices.
4. US Treasury Bonds (US10Y)
Under normal conditions, US government bonds are some of the deepest, most liquid safe-haven instruments in the world. But 2026 is not normal conditions…
Yields have been rising, not falling, meaning bond prices are moving in the wrong direction for anyone seeking safety.
When yields rise during a risk-off event, it signals the market is treating bonds as an inflation risk rather than a safety asset.
However, short-duration Treasuries like bills and 2-year notes are a different story. They may offer higher income with less duration risk than longer-dated bonds, which is why some investors use them more defensively in volatile periods.
Key variables to watch: Fed communication, CPI and PCE data, and whether the 10Y yield breaks above 4.50% or pulls back below 4.00%.
5. Australian Dollar vs. US Dollar (AUD/USD): inverse play
The Australian dollar is widely considered a risk-on currency, tied closely to global commodity demand and Chinese growth.
In risk-off environments, AUD/USD typically falls. A falling AUD/USD can serve as a leading indicator of broader global stress, which can be useful context for traders with regional exposure.
The RBA hiking cycle (two hikes since the start of 2026) is providing some floor under the AUD, but in a sustained global risk-off move, that support has limits.
Key variables to watch: RBA forward guidance, Chinese PMI data, iron ore prices, and oil's impact on Australian inflation expectations.
6. US Dollar Index (DXY)
The US dollar acts as the world's reserve currency and a reflexive safe haven during acute stress. When liquidity dries up, global demand for USD tends to spike regardless of the underlying trend.
Over the past 12 months, the dollar has lost ground as global confidence in US fiscal trajectory has wavered. But over the past month, it has firmed, supported by a hawkish Fed and elevated geopolitical risk.
In risk-off environments, the USD continues to attract safe-haven flows. However, rising oil prices can increase inflation risks, complicating Federal Reserve policy expectations.
Key variables to watch: Fed rate path, US inflation data, and global liquidity conditions.
7. Singapore Dollar (SGD)
Less discussed globally but highly relevant across Southeast Asia, the SGD is one of the most quietly resilient currencies in the current environment.
The Singapore dollar has advanced to near its highest level since October 2014, supported by safe haven flows and investors drawn to Singapore's AAA-rated bonds, a dividend-heavy stock market, and predictable government policies.
The MAS manages the SGD through a nominal effective exchange rate band rather than an interest rate, giving it a different character from other safe-haven currencies.
For traders with exposure to Indonesia, Malaysia, Thailand, Vietnam, and the broader ASEAN region, USD/SGD can act as a practical benchmark for regional risk appetite.
Key variables to watch: MAS policy band adjustments, regional trade flows, and USD/Asia dynamics more broadly.
8. Cash and Short-Duration Fixed Income
Sometimes, the most effective safe haven can be to simply reduce exposure. With central bank rates still elevated across major economies, cash and short-duration government bonds can offer a meaningful yield while sitting outside market risk.
The RBA raised the cash rate to 4.10% at its March meeting. The Bank of England held at 3.75%, while the ECB kept its deposit facility rate at 2.00% and main refinancing rate at 2.15%.Across all major economies, short-duration government paper is offering a real return for the first time in years.
In a volatile environment, capital preservation can sometimes matter more than return maximisation.
Key variables to watch: Central bank meeting calendars across all major economies, and any shifts in forward guidance on the rate path.
What to Watch Next
Fed inflation data. Core PCE is the single most important data point for gold, bonds, and the dollar right now. Any surprise in either direction could move all three simultaneously.
Yen intervention risk. The yen is near levels that have previously triggered action from Japanese authorities. Traders with Asia-Pacific exposure should monitor closely.
RBA's next move. With Australia now at 4.10% and inflation still above target, the question is whether the hiking cycle has further to run. The next RBA meeting is on 5 May.
Geopolitical trajectory. Any move toward de-escalation in the Middle East would quickly reduce safe haven demand and rotate capital back into risk assets. The reverse is equally true.
China's growth signal. A stronger-than-expected Chinese recovery could lift commodity currencies and reduce defensive positioning across Asia-Pacific.
The Longer-Term Lens
The 2026 environment is exposing that the effectiveness of safe haven assets depends on the type of shock, not just its severity.
An inflationary supply shock like the Iran conflict has delivered is one of the most difficult environments for traditional safe havens.
Gold falls as real yields rise. Bonds sell off as inflation expectations climb. Even the yen can weaken as Japan's import costs surge.
What has held up are assets with institutional credibility, managed frameworks, and deep liquidity regardless of macro conditions. The Swiss franc, Singapore dollar, and short-duration cash instruments fit that description better than gold or long bonds do right now.
In 2026, the question for traders is not "which safe haven?" It is "a safe haven from what?"
If you've spent any time looking at a trading terminal, you've seen it. A news headline breaks, a chart line snaps, and suddenly everyone is rushing for the same exit or the same entrance. It looks like chaos. In practice, it is often a chain of mechanical responses.
This matters for a couple of reasons. Many readers assume the story is the trade. It is not. The story, whether it is an interest rate decision, a supply shock or an earnings miss, is the fuel and the playbook is the engine.
Below are seven core strategies often used in contracts for difference (CFDs) trading. With CFDs, you are not buying the underlying asset. You are speculating on the change in value. That means a trader can take a long position if the price rises, or a short position if it falls.
Seven strategies to understand first
1. Trend following (the establishment play)
Trend following works on the idea that a market already in motion can remain in motion until it meets a clear structural obstacle. Some market participants view it as a chart-based approach because it focuses on the prevailing direction rather than trying to call an exact turning point.
The rationale: The aim is to identify a clear directional bias, such as higher highs and higher lows, and follow that momentum rather than position against it.
What traders look for: Exponential moving averages (EMAs), such as the 50-day or 200-day EMA, are commonly used to interpret trend strength, though indicators can produce false signals and are not reliable on their own.
Source: GO Markets | Educational example only.
How it works: The 50-period EMA can act as a dynamic support level that rises as price rises. In an uptrend, some traders watch for the market to make a new higher high (HH), then pull back towards the EMA before moving higher again. Each higher low (HL) may suggest buyers are still in control.
When price touches or comes close to the 50-period EMA during that pullback, some traders treat that area as a potential decision zone rather than assuming the trend will resume automatically.
What to watch: The sequence of HHs and HLs is part of the structural evidence of a trend. If that sequence breaks, for example if price falls below the previous HL, the trend may be weakening and the setup may no longer hold.
2. Range trading (the ping-pong play)
Markets can spend long stretches moving sideways. That creates a range, where buyers and sellers are in temporary balance. Range trading is built around this behaviour, focusing on moves near the bottom and top of an established range.
The rationale: Price moves between a floor, known as support, and a ceiling, known as resistance. Moves near those boundaries can help define the width of the range.
What traders look for: Some traders use oscillators such as the Relative Strength Index (RSI) to help judge whether the asset looks overbought or oversold near each boundary.
Source: GO Markets | Educational example only.
How it works: The support level is a price zone where buying interest has historically been strong enough to stop the market from falling further. The resistance level is where selling pressure has historically prevented further gains.
When price approaches support, some traders look for signs of a potential rebound. When it approaches resistance, they look for signs that momentum may be fading. RSI readings below 35 can suggest the market is oversold near support, while readings above 65 can suggest it is overbought near resistance.
What to watch: The main risk in range trading is a breakout, when price pushes decisively through either level with strong momentum. This may signal the start of a new trend and using a stop-loss just outside the range on each trade may help manage that risk.
3. Breakouts (the coiled spring play)
Eventually, every range comes under pressure. A breakout happens when the balance shifts and price pushes through support or resistance. Markets alternate between periods of low volatility, where price moves sideways in a tight range, and high-volatility bursts where price can make a larger directional move.
The rationale: Quiet consolidation can sometimes be followed by a broader expansion in volatility. The tighter the compression, the more energy may be stored for the next move.
What traders look for: Bollinger Bands are often used to interpret changes in volatility. When the bands tighten, a squeeze is forming. Some market participants view a move outside the bands as a sign that conditions may be changing.
Source: GO Markets | Educational example only.
How it works: Bollinger Bands consist of a middle line, the 20-period moving average, and 2 outer bands that expand or contract based on recent price volatility. When the bands narrow and come close together, the squeeze, the market has been unusually calm.
This is often described as a coiled spring. Energy may be building, and a sharper move can follow. Some traders treat the first move through an outer band as an early clue on direction, rather than a definitive signal on its own.
What to watch: Not every squeeze leads to a powerful breakout. A false breakout occurs when price briefly moves outside a band, then quickly reverses back inside. Waiting for the candle to close outside the band, rather than entering mid-candle, can reduce the risk of being caught in a false move.
4. News trading (the deviation play)
This is event-driven trading. The focus is on the gap between what the market expected and what the data or headline actually delivered. Economic data releases, such as inflation figures (CPI), employment reports and central bank decisions, can cause sharp, fast moves in financial markets.
The rationale: High-impact releases, such as inflation data or central bank decisions, can force a fast repricing of assets. The bigger the surprise relative to expectations, the larger the move may be.
What traders look for: Traders often use an economic calendar to track timing. Some focus on how the market behaves after the initial reaction, rather than treating the first move as definitive.
Source: GO Markets | Educational example only.
How it works: Before the news, price may move in a calm, tight range as traders wait. When the data is released, if the actual reading differs significantly from the consensus expectation, repricing can happen fast.
Gold, for example, may spike sharply on a CPI reading that comes in above expectations. However, the candle can also print a very long upper wick, meaning price reached the spike high but was then rejected strongly. Sellers may step in quickly, and price may retrace. This spike-and-retrace pattern is one of the more recognisable setups in news trading.
What to watch: The direction and size of the initial spike do not always tell the full story. Wick length can offer an important clue. A long wick may suggest the initial move was rejected, while shorter wicks after a data release may indicate a more sustained directional move.
5. Mean reversion (the rubber-band play)
Prices can sometimes move too far, too fast. Mean reversion is built on the idea that an overextended move may drift back towards its historical average, like a rubber band pulled too tight, then snapping back.
The rationale: This is a contrarian approach. It looks for stretches of optimism or pessimism that may not be sustainable, and positions for a return to equilibrium.
What traders look for: A common example is price moving well away from a 20-day moving average (MA) while RSI also reaches an extreme reading. In that setup, traders watch for a move back towards the mean rather than a continuation away from it.
Source: GO Markets | Educational example only.
How it works: The 20-period MA represents the market's recent average price. When price moves into an extreme zone, such as more than 3 standard deviations above or below that average, it has moved a long way from its recent trend.
An RSI above 70 can suggest the market is stretched to the upside, while below 30 can suggest the same to the downside. Some mean reversion traders use these combined signals as a sign that a pullback towards the 20-period MA may be possible, rather than assuming the move will continue to extend.
What to watch: Mean reversion strategies can carry significant risk in strongly trending markets. A market can remain extended for longer than expected, and a position entered against the short-term trend can generate large drawdowns. Position sizing and clear stop-losses are critical.
6. Psychological levels (the big figure play)
Markets are driven by people, and people tend to focus on round numbers. US$100, US$2,000 or parity at 1.000 on a currency pair can act as magnets. In financial markets, certain price levels can attract a disproportionate amount of buying and selling activity, not because of technical analysis alone, but because of human psychology.
The rationale: Large orders, stop-losses and take-profit levels can cluster around these big figures, which may reinforce support or resistance. This self-reinforcing behaviour is one reason these rejections can become meaningful for traders.
What traders look for: Traders often watch how price behaves as it approaches a round number. The market may hesitate, reject the level or break through it with momentum. Multiple wick rejections at the same level may carry more weight than a single one.
Source: GO Markets | Educational example only.
How it works: When price approaches a round number from below, some traders watch for long upper wicks, the thin vertical line above the candle body. A long upper wick means price reached that level, but sellers stepped in aggressively and pushed it back down before the candle closed.
One wick rejection may be notable. Three in a cluster may be more significant. Some traders use this accumulated rejection as part of the case for a short (sell) setup at that level.
What to watch: Psychological levels can also act as magnets in the opposite direction. If price breaks through with conviction, the level may then act as support. A decisive close above the level, rather than just a wick break, can be an early sign that the rejection setup is no longer holding.
7. Sector rotation (the economic season play)
This is a macro strategy. As the economic backdrop changes, capital may move from higher-growth sectors into more defensive ones, and back again. Not all parts of the sharemarket move in the same direction at the same time.
The rationale: In a slowing economy, discretionary spending may weaken while demand for essential services can remain more stable. Investors may rotate capital between sectors accordingly.
What traders look for: With CFDs, some traders express this view through relative strength, taking exposure to a stronger sector while reducing or offsetting exposure to a weaker one.
Source: GO Markets | Educational example only.
How it works: During a growth phase, when the economy is expanding, investors tend to prefer growth-oriented sectors like technology. As the economic environment shifts, perhaps due to rising interest rates, slowing earnings or increasing recession risk, a rotation point may emerge.
In the slowdown phase, the pattern can reverse. Technology may weaken while utilities may strengthen, as investors move capital into defensive, income-generating sectors. Early signals can include relative underperformance in growth sectors combined with unusual strength in defensives.
What to watch: Sector rotation is not usually an overnight event. It typically unfolds over weeks to months. Tracking the ratio between two sectors, often shown in a relative strength chart, can make this shift visible before it becomes obvious in absolute price terms.
Why risk management is the engine of survival
The headline move is one thing. The market implication for your account is another. If you do not manage the mechanics, the strategy does not matter.
Because CFDs are traded on margin, a small market move may have an outsized impact on the account. If leverage is too high, even a minor wobble may trigger a margin call or automatic position closure, depending on the provider's terms. This is not a theoretical risk. It is a common reason new traders lose more than they expected on a trade that was directionally correct.
The market does not always move in a straight line. Sometimes, price gaps from one level to another, especially after a weekend or major news event and in those conditions, a stop-loss may not be filled at the exact requested price. That is known as slippage. It is one reason large positions may carry additional risk into major announcements.
Bottom line
The vehicle is powerful, but the playbook is what helps keep you on the road.
The obvious trade is often already priced in. What matters more is understanding which market condition is in front of you. Is it trending, ranging, breaking out or simply reacting to a headline?
Readers assessing leveraged products often focus on position sizing, risk limits and product disclosure before deciding whether the product is appropriate for them. The headlines will keep changing. The maths of risk management does not.
Disclaimer: This article is general information only and is intended for educational purposes. It explains common trading concepts and market behaviours and does not constitute financial product advice, a recommendation, or a trading signal. Any examples are illustrative only and do not take into account your objectives, financial situation or needs. CFDs are complex, leveraged products that carry a high level of risk. Before acting, consider the PDS and TMD and whether trading CFDs is appropriate for you. Seek independent advice if needed. Past performance is not a reliable indicator of future results.
If you have been following the tech story for the last decade, you have been trained to look at a very specific, very small patch of real estate in Northern California. But as we sit here in early 2026, the "connect-the-dots" moment for investors is this: the AI trade has stopped being about shiny software demos in Palo Alto and has started being about the physical industrialisation of compute.
We have entered the "Year of Proof". The world’s largest companies, the hyperscalers, are projected to spend a staggering US$650 billion on capital expenditures this year. But here’s the part most people miss: that money is not staying in Silicon Valley. It’s flowing to the "picks and shovels" players in Idaho, Washington, Colorado and even overseas.
If you want to understand where the actual return on investment (ROI) may be landing this earnings season, you have to look outside the 650 area code. The shift from AI hype to AI industrialisation is changing the map.
The full AI stack: from capex to consulting — GO Markets
Five companies · AI infrastructure play · 2026
The full AI stack: from capex to consulting
Infrastructure builders compared to the implementation bridge across the AI value chain
Note: Hyperscalers shown as 2026 CapEx spend. Accenture shown as cumulative advanced AI bookings ($11.5B through Q1 FY2026), reflecting its role as the adoption layer rather than the infrastructure layer.
Infrastructure (2026 CapEx projected)Implementation bridge (cumulative AI bookings)
Hyperscaler CapEx: Early 2026 analyst estimates, midpoint of ranges. Amazon approx. 100% YoY, Alphabet approx. 100%, Meta approx. 87%, Microsoft approx. 50%.
Accenture: Cumulative advanced AI bookings $11.5B through Q1 FY2026. Q1 AI bookings $2.2B (up 76% YoY), AI revenue $1.1B (up 120% YoY) across 1,300+ clients.
Five companies shaping the next phase of AI
Micron Technology (MU), Boise, Idaho
Micron is the "memory backbone" of the current cycle. While everyone was watching the chip designers, many overlooked the fact that AI chips are far less useful without high-bandwidth memory (HBM). Micron is currently viewed by some analysts as a strong buy because its capacity is reportedly sold out through the end of 2026. Analysts are also eyeing a 457% jump in earnings per share (EPS) as the memory cycle reaches what some describe as a robust peak.
Microsoft (MSFT), Redmond, Washington
Microsoft is the enterprise backbone of this transition. It has moved beyond simple chatbots and is now building what analysts call "Intelligence Factories". While the stock has faced pressure recently over capacity constraints, underlying demand for Azure AI is reportedly still running ahead of capacity. The broader bull case is that Microsoft is moving into "Agentic AI", systems that do not just talk to users but may also execute multi-step business workflows.
Amazon is playing a long-term game of vertical integration. To reduce its reliance on expensive third-party hardware, it’s building its own AI chips in-house. Amazon Web Services (AWS) remains the primary driver of profitability, and the company is using its retail data to train specialised models that many Silicon Valley start-ups may struggle to replicate.
Palantir Technologies (PLTR), Denver, Colorado
If Micron provides the memory and Microsoft the platform, Palantir provides the "operating system" for the modern AI factory. The company has posted strong momentum, with US commercial sales recently growing 93% year over year. It’s often framed as a bridge between raw data and corporate profitability, which remains a key focus for investors in 2026.
Accenture (ACN), Dublin, Ireland
You cannot just "plug in" AI. Businesses often need to redesign processes around it, and that’s where Accenture comes in.
The company is viewed as an implementation bridge, with one analyst arguing that "GenAI needs Accenture" to move from pilot programs to production though the cautionary angle is that the AI story has not fully excited investors here yet because consulting revenue can take longer to show up than chip sales.
What could happen next?
The chart maps the three time horizons likely to shape the next phase of the AI industrialisation trade.
In the near term, markets are still reacting to chipmaker earnings, guidance, and any signs of capacity strain. Over the next month, attention shifts to the real-world inputs behind AI growth, especially power, financing, and infrastructure. By the 60-day window, the key question is whether AI spending is broadening into a wider market re-rating or running ahead of near-term returns.
Across all three periods, the focus is the same: proof. Investors are looking for signs that AI capital expenditure is translating into real demand for energy, land, and industrial capacity. That is why updates from companies tied to power and data centre buildout matter more than ever.
What could happen next — GO Markets
Scenario planning · March 2026
What could happen next
Three time horizons, three scenarios to watch across the AI industrialisation cycle
Next 2 weeks
Chipmaker reports
Possible
Market volatility continues as traders digest the latest reports from chipmakers like Micron
Upside scenario
"Bulletproof" guidance from remaining infrastructure names triggers a sector-wide relief rally
Watch for
Any mention of "capacity constraints" or "supply bottlenecks" in earnings calls
Next 30 days
Energy and rates
Possible
Focus shifts to "real economy" energy players like NextEra that power the data centres
Downside scenario
Rising oil prices from Middle East conflict act as a tax on tech margins, rotating into defensives
Action point
Monitor Fed language on rates. Higher for longer makes $650B capex bills far more expensive to finance
Next 60 days
The great dispersion
Possible
Market rewards companies with real AI revenue and punishes those still stuck in experimentation
Upside scenario
NextEra Energy (NEE) data centre announcements in late April/May trigger a utility renaissance rally
Downside scenario
An "air pocket" in profits occurs where debt-funded investment outpaces revenue gains
Watch
May reports from Texas Pacific Land (TPL) — is data centre land demand still "red hot"?
Action point
Review your portfolio for geographic diversity. The AI story is now a global power race
The psychological trap
The emotional trap many traders fall into right now is recency bias. You have seen NVIDIA and the "Magnificent 7" win for so long that it feels like they are the only way to play this. But the "obvious" trade is often the one that has already been priced in. Before acting, ask yourself: "Am I buying this stock because I understand its role in the physical AI supply chain, or because I’m afraid of missing the next leg of a rally that started two years ago?"
Disclaimer: This content is general information only and should not be relied on as personal financial advice or a recommendation to buy, sell, or hold any financial product. References to companies or themes, including AI-related stocks, are illustrative only. Share and derivative markets can move sharply, and concentrated sectors such as AI and technology may experience elevated volatility, valuation risk, and liquidity risk. If you trade derivatives such as CFDs, leverage can magnify both gains and losses. Past performance is not a reliable indicator of future performance.
If you have been watching markets over the past year, you will have noticed that the "growth at any cost" era has effectively hit a wall. The April 2026 earnings cycle arrives at a moment when the market's focus has undergone a structural reorientation. It is not just about profit and loss statements anymore. It is about the signals sitting behind them.
With interest rate uncertainty lingering and geopolitical shocks pushing oil above US$100, the playbook has shifted from AI hype toward institutional resilience and the industrialisation of compute. For traders in Australia, Asia and Latin America, these results may act as a mood ring for global risk appetite and the emerging security supercycle.
Important - Dates, Times and Figures
All earnings dates marked as confirmed or estimated should be verified against current company investor relations calendars before you act on them. Reporting schedules can change without notice due to corporate decisions, regulatory requirements or exchange timetable adjustments.
The mechanics: How the timing works across time zones
The US earnings season does not arrive as a smooth drip. It arrives in waves. For non-US traders, the primary challenge is the overnight gap: major results land while you are away from your desk and can move index CFDs before your local market opens. Before market open (BMO) and after market close (AMC) matter just as much as the numbers themselves. The timing changes how quickly markets react, when liquidity is available and whether the first move has already happened before your session begins.
Why BMO and AMC matter
A BMO result hits before the US cash market opens, so price discovery happens in pre-market trading where liquidity is thinner and moves can be exaggerated. An AMC result hits after close, meaning the reaction is compressed into a short pre-market window the following morning. Understanding which window your company reports in is as important as understanding what it reports.
Institutional Grade Performance
Master the Markets with MetaTrader 5
Trade hundreds of instruments with superior speed and advanced technical analysis. Harness full EA functionality to execute your strategy.
For this cycle, the market is no longer rewarding AI mentions alone. It is looking for return on investment (ROI) proof. The four thematic snapshots below help explain where attention is likely to sit as results come through. Each theme has its own section with company cards that can be updated each quarter.
T1
Theme 1 — Institutional anchors
Defence against volatility
These companies are often watched as relative defensives during energy shocks and inflation spikes, although they remain exposed to normal share-price risk. When macro uncertainty rises, money has historically rotated toward businesses with contracted revenue, government-linked demand or pricing power that is not dependent on the consumer cycle — but past rotation patterns do not guarantee future performance.
JPM
JPMorgan Chase
Tuesday, 14 AprilConfirmed
Watch For
Net interest margin (NIM) under higher for longer rates, and whether AI spending remains cost neutral.
LMT
Lockheed Martin
Wednesday, 22 AprilEstimated
Watch For
F-35 delivery schedules and the company's ability to absorb tariff related costs on supply chain inputs.
NOC
Northrop Grumman
Monday, 27 AprilConfirmed
Watch For
B-21 Raider production progress and the conversion of its reported US$95.7 billion backlog into recognised revenue.
T2
Theme 2 — Tangible capital
EVs and energy
As parts of tech slow, investors have been rotating toward tangible, capital-intensive businesses. The energy transition and the infrastructure required to support AI data centre power demand have put utilities and energy companies in an unusual position: they are now growth stocks with defensive characteristics — though all remain subject to ordinary equity and sector risk.
TSLA
Tesla
Thursday, 23 AprilConfirmed
Watch For
The strategic shift from EV margins toward robotaxi and energy storage as the new growth narrative.
NEE
NextEra Energy
Friday, 24 AprilEstimated
Watch For
Data centre power demand and progress on its reported 30 GW contracted backlog as utilities face new infrastructure pressure.
XOM
Exxon Mobil
Wednesday, 29 AprilEstimated
Watch For
Permian and Guyana volume growth, and cash flow resilience during the Hormuz supply disruption.
T3
Theme 3 — The hardware invoice phase
AI infrastructure
This is the engine room of the S&P 500 and the part of the market most tied to whether AI capital expenditure is generating measurable returns. The question the market is now asking is not whether these companies are spending on AI. It is whether the spending is translating into capacity utilisation and revenue that justifies the multiple.
MSFT / GOOGL
Microsoft and Alphabet
Monday, 27 AprilEstimated
Watch For
Azure and Cloud capacity constraints against heavy AI capital expenditure. The gap between spending and utilisation is the market's primary concern.
NVDA
NVIDIA
Wednesday, 27 MayEstimated
Watch For
Blackwell GPU demand and gross margin sustainability as the product cycle matures and competition intensifies.
T4
Theme 4 — K-shaped recovery
Consumer platforms and devices
This theme tests the K-shaped consumer recovery: higher-income cohorts remain more resilient while lower-income cohorts face continued pressure from elevated borrowing costs and energy prices. Ad revenue and device upgrade cycles are the clearest indicators of where on the K-curve the consumer sits.
META / AMZN
Meta and Amazon
28 to 29 AprilEstimated
Watch For
AI-driven ad click improvements against Reality Labs spending and retail logistics costs as the profitability test for non-core investment.
AAPL
Apple
Thursday, 30 AprilEstimated
Watch For
iPhone upgrade cycle momentum and the Apple Intelligence rollout in China as the first real-world test of AI-driven hardware demand.
Analysis checklist: how to read each result
Use this structure for every company on your watchlist. A headline beat is common. The bigger market move often comes from how the market translates the details sitting behind the number.
1
Projected consensus
This is the bar for earnings per share (EPS) and revenue. Small beats may already be priced in. The market often sets a whisper number above the published consensus, so a technically positive result can still disappoint.
2
The call focus
Identify the single variable analysts are most focused on this cycle: capital expenditure versus margins, inventory turnover, customer growth rate, or contract backlog conversion.
3
The translation
A beat, meet or miss each carries a different market dynamic.
Beat
Matters most when forward guidance is credible. Without it, the initial move may reverse.
Meet
Often shifts focus to the tone of the call, particularly language around capacity or outlook.
Miss
Can be treated as the start of a trend and trigger a sharp repricing of valuation multiples.
The recency bias problem
The emotional trap many traders fall into is recency bias. Because the Magnificent 7 have led markets for so long, it can feel as though they are still the only trade that matters. That assumption deserves to be tested.
It's worth asking: Is the obvious trade already priced for perfection?
2026 is shaping up as a year of proof. Companies that spent heavily on AI over the past two years are now being asked to show the return. The market is no longer rewarding the announcement of AI investment. It is rewarding the evidence of AI-driven revenue outcomes.
A better framing question for each result is this: are you reacting to a headline, or are you assessing the company's role in the physical AI supply chain or as a potential volatility hedge? Those are very different analytical tasks, and they tend to produce very different positioning decisions.
What to watch next
Three time horizons, three distinct signals. Update these each cycle with the most relevant near-term catalyst, the sector rotation to watch, and the longer-horizon dispersion theme.
Next Two Weeks
Consumer health barometer
Watch the 31 March Nike report as a lead indicator for consumer discretionary health. Footwear and apparel demand signals tend to front-run broader retail sentiment.
Next 30 Days
Bank lending and industrial demand
Focus shifts to the major banks. If loan demand tied to industrial and infrastructure projects remains firm, the earnings cycle may have support beyond the tech sector.
Next 60 Days
Wider dispersion between winners and losers
Watch for dispersion to widen. The companies converting heavy capital expenditure into measurable revenue outcomes may separate clearly from those that cannot.
Client & Education Portal
Follow the US Reporting Season
Stay ahead of major beats, misses, and market surprises. Log in to your terminal, open a new account, or explore our dedicated earnings academy.
Start with what actually happened to FX markets in the lead-up to April: there was a geopolitical shock and oil supply out of the Middle East came under pressure. The immediate reaction across currency markets was the one traders have seen before: money moved toward safety, toward yield, and away from anything that looked exposed to the disruption.
Safe-haven flows meet yield divergence
The US dollar benefited from both of those forces at once. It is a safe haven and it also carries a yield advantage that most of its peers cannot match right now. The Swiss franc picked up some of the overflow from European risk aversion. The yen, which used to attract safe-haven flows almost automatically, is stuck in a different situation altogether where the yield gap against the dollar is now so wide that safe-haven logic has been overridden by carry logic.
The currencies that had the toughest month were the ones caught in the middle: risk-sensitive, commodity-linked, or running policy rates that simply cannot compete. The New Zealand dollar is the clearest example while the Australian dollar is a messier story. Sitting underneath all of it is a repricing of 2026 rate cut expectations that central banks in multiple countries are now reassessing.
DXY context
Regained 100 on geopolitical risk
Strongest currency
USD — safe haven plus yield
Weakest currency
NZD — yield gap plus energy
Main central bank theme
Repricing of 2026 rate cut paths
Main catalyst ahead
Fed and BOJ policy meetings
Monthly leaderboard — biggest movers
01USD
Rose sharply on safe-haven demand and higher for longer yield expectations.
Strong
02CHF
Advanced strongly as the preferred European refuge from Middle East risk.
Up
03JPY
Highly volatile; fell to 20-month lows before intervention commentary.
Volatile
04AUD
Mixed; caught between domestic energy inflation and a hawkish RBA.
Mixed
05NZD
Fell sharply; pressured by energy exposure and capital outflows.
Weak
Strongest mover: US dollar (USD)
The US dollar spent most of 2025 gradually losing ground as the Fed cut rates and the rest of the world played catch-up. That story stalled hard in late March. The Iran conflict changed the calculus, and the dollar reasserted itself in a way that reflects something real about its structural position in global markets.
The US exports oil and when energy prices rise, that is a terms-of-trade improvement, not a terms-of-trade shock. Most of the dollar's major peers sit on the other side of that equation. Add a policy rate range of 3.50% to 3.75% that now looks locked in for longer, and the dollar's advantage is both cyclical and structural at the same time. The US Dollar Index (DXY) has regained the 100 level but tThe question heading into April is whether it holds there or pushes further.
Key drivers
Safe-haven demand:
The Iran conflict directed flows into US assets across equities, Treasuries, and the dollar itself.
Yield advantage:
The federal funds rate at 3.50% to 3.75% provides a meaningful return floor relative to most peers, helping to sustain capital inflows.
Energy insulation:
The US position as an oil exporter creates a structural terms-of-trade benefit when oil prices rise sharply.
Rate cut repricing:
Market expectations for 2026 Fed cuts have been scaled back significantly, removing a key source of dollar headwinds.
What markets are watching next
The DXY's ability to hold above 100 is the near-term reference point. The 10 April CPI print is the most direct test. A reading above expectations may add further support, while a soft print could give traders reason to take some dollar positions off the table.
The main risks to the upside case are a sudden diplomatic resolution in the Middle East, which could reduce safe-haven demand quickly, or a labour market print on 3 April that is weak enough to revive recession concerns and push rate cut expectations higher again.
Weakest mover: New Zealand dollar (NZD)
If you wanted to design a currency that would struggle in the current environment, the NZD fits the brief almost perfectly. It is risk-sensitive. It is commodity-linked. It runs a policy rate of 2.25%, which sits below the Fed and now below the RBA as well. New Zealand is also an energy importer, so rising oil prices hit the trade balance and the domestic inflation outlook at the same time.
None of those things are new but the combination of all of them hitting at once, against a backdrop of a surging dollar and broad risk-off sentiment, has compressed the NZD in a way that is hard to ignore. The carry trade that once made NZD attractive has reversed as capital has been moving out, not in.
Key drivers
Energy import exposure:
Rising Brent crude hits New Zealand's trade balance directly and adds upside pressure to domestic inflation.
Yield gap:
The 2.25% Reserve Bank of New Zealand (RBNZ) policy rate sits below the Fed and the RBA, sustaining negative carry against both the USD and AUD.
Risk-off positioning:
As a commodity and risk currency, the NZD tends to underperform when global sentiment deteriorates.
Trade uncertainty:
Ongoing tariff related uncertainty continues to weigh on export sector confidence.
Risks and constraints
Any unexpected hawkish commentary from the RBNZ or a sharp decline in oil prices could provide some relief. A broader improvement in global risk appetite would also tend to benefit the NZD, given its sensitivity to sentiment shifts.
But the structural yield disadvantage is not going away quickly, and that may continue to limit the pair's recovery potential.
USD/JPY
USD/JPY is the pair that most clearly illustrates what happens when a currency's safe-haven status gets overridden by carry logic. The yen used to be the first port of call for traders looking for protection during geopolitical stress. That dynamic has been suppressed, and the reason is straightforward: you give up too much yield to hold yen right now.
The Bank of Japan (BOJ) policy rate sits at 0.75% while the Fed's sits at 3.50% to 3.75% and that gap does not encourage safe-haven flows. It encourages borrowing in yen and deploying elsewhere. So while the dollar rose on geopolitical risk, the yen fell on the same event. That is not how it is supposed to work, but it is how the maths works out when yield differentials are this wide.
USD/JPY is sitting near 159, which leaves it not far from the 160 level that Japan's Ministry of Finance has consistently flagged as a line requiring attention. The BOJ meeting on 27 and 28 April is now a genuinely live event.
Key events to watch
Tokyo CPI, 30 March (AEDT):
March inflation data. A strong read may build the case for BOJ action at the April meeting.
BOJ meeting, 27 and 28 April (AEST):
Markets are treating this as a live event. The quarterly outlook report may include updated inflation forecasts that shift rate hike timing expectations.
Intervention watch:
Japan's Ministry of Finance has been explicit about the 160 level. Actual intervention, or a credible threat of it, could trigger a sharp and fast reversal.
What could shift the outlook
A hawkish BOJ, actual FX intervention, or a softer US CPI print that reduces dollar support could all push USD/JPY lower from current levels. On the other side, a dovish hold from the BOJ combined with continued dollar strength could see the pair test 160 and potentially beyond, which would likely intensify the intervention conversation in Tokyo.
For traders watching AUD/JPY and other yen crosses, the BOJ meeting on 27 and 28 April carries similar weight. A hawkish shift tends to compress yen crosses broadly, not just USD/JPY.
Data to watch next
Four events stand out as the clearest potential FX catalysts in the weeks ahead. Each has a direct transmission channel into rate expectations, and rate expectations are driving much of the move in FX right now.
Key dates and FX sensitivity
30
Mar
Tokyo CPI
JPY pairs, USD/JPY · AEDT
A strong read may strengthen the case for a more hawkish BOJ at the April meeting.
3
Apr
US labour market (NFP)
USD pairs, AUD/USD, NZD/USD · 10:30 pm AEDT
A weak result could revive recession concerns and alter Fed pricing.
10
Apr
US CPI - March
USD/JPY, EUR/USD, gold · 10:30 pm AEST
The most direct test of whether inflation is easing fast enough to reopen the rate cut conversation.
27-28
Apr
BOJ meeting and quarterly outlook report
JPY crosses, AUD/JPY · AEST
The key policy event for yen crosses. Updated inflation forecasts may shift rate hike timing expectations.
Key levels and signals
These are the reference points that traders and policymakers are watching most closely. Each one represents a potential trigger for a shift in positioning or an official response.
◆
DXY 100.00
A psychologically and technically significant support level. Holding above it may sustain the dollar's current run across major pairs. A break below it would likely signal a broader sentiment shift.
◆
USD/JPY 160.00
Japan's Ministry of Finance has consistently referenced this level as a threshold requiring attention. Actual intervention, or a credible threat of it, has historically been capable of producing sharp and fast reversals in the pair.
◆
Brent crude US$120
A move to this level would likely intensify risk off behaviour across FX markets, putting further pressure on energy importing currencies including the NZD, EUR, and JPY.
◆
AUD/USD 0.7000
This level has historically attracted buying interest and may act as a near term directional reference for positioning in the pair.
Bottom line
The FX moves heading into April were shaped by a combination of geopolitical shock, yield divergence, and a repricing of central bank expectations that few had positioned for at the start of the quarter. The dollar's dual role as a high yielding and safe haven currency has put it in an unusually strong position, but that position is not unconditional.
One soft CPI print, one diplomatic breakthrough, or one labour market miss could change the tone quickly. Currency moves may remain highly data dependent and sensitive to overnight news flow from the Middle East, where developments can gap markets before the next session opens.
Access a broader FX universe and stay flexible as conditions change. Open an account · Log in
Here is the situation as April begins. A war is affecting one of the world's most important oil chokepoints. Brent crude is trading above US$100. And the Federal Reserve (Fed), which spent much of 2025 engineering a soft landing, is now facing an inflation threat driven less by wages, services or the domestic economy, and more by energy. It is watching an oil shock.
The Fed funds rate sits at 3.50% to 3.75%. The next Federal Open Market Committee (FOMC) meeting is on 28 and 29 April and the key question for markets is not whether the Fed will cut, it is whether the Fed can cut, or whether the energy shock may have shut that door for much of 2026.
A heavy run of major data releases lands in April. The March consumer price index (CPI), non-farm payrolls (NFP) and the advance estimate of Q1 gross domestic product (GDP) are the three that matter most. But the FOMC statement on 29 April may be the release that sets the tone for the rest of the year.
Fed Funds Rate
3.50%–3.75%
Next FOMC
28–29 April 2026
Brent crude
Above US$100
Key data events
12 major releases
Growth: Business activity and demand
Think about what the US economy looked like coming into this year: AI-driven capital expenditure (capex) was a major part of the growth narrative, corporate investment intentions looked firm and the One, Big, Beautiful Bill Act was already in the mix. On paper, the growth story looked solid.
Then the Strait of Hormuz situation changed the calculus. Not because the US is a net energy importer, it is not, and that structural insulation matters. But what is good for US energy producers can still squeeze margins elsewhere and weigh on global demand. The 30 April advance Q1 gross domestic product (GDP) estimate is now likely to be read through two lenses: how strong was the economy before the shock, and what it may signal about the quarters ahead.
Key dates (AEST)
2
Apr
US international trade in goods and services (February)
Bureau of Economic Analysis · 10:30 pm AEDT
Medium
30
Apr
Q1 GDP — advance estimate
Bureau of Economic Analysis · 10:30 pm AEST
High
What markets look for
Resilience in Q1 GDP despite the elevated interest rate environment and early energy cost pressures
Trade balance movements linked to shifting global tariff frameworks
Business investment intentions following passage of the "One Big Beautiful Bill Act"
Early signs of capacity constraints emerging in technology-heavy sectors
How this data may move markets
Scenario
Treasuries
USD
Equities
Stronger than expected growth
↑ Yields rise
↑ Firmer
Mixed - depends on inflation read
Softer growth/GDP miss
↓ Yields fall
↓ Softer
Risk off if stagflation narrative builds
Labour: Payrolls and employment
February's jobs report was, depending on how you read it, either a blip or a warning sign. Non-farm payrolls (NFP) fell by 92,000, unemployment edged up to 4.4% and the official line was that weather played a role. That may be true but here is what also happened. The labour market suddenly looked a little less convincing as the main argument for keeping rates elevated.
The 3 April employment report for March is now genuinely consequential. A bounce back to positive payroll growth would probably steady nerves and a second consecutive soft print, particularly against a backdrop of higher energy prices, would start to build a very uncomfortable narrative for the Fed. It would be looking at slower jobs growth and an inflation threat at the same time. That is not a comfortable place to be.
Key dates (AEST)
3
Apr
March employment situation (NFP and unemployment rate)
Bureau of Labor Statistics · 10:30 pm AEDT
High
30
Apr
Q1 employment cost index
Bureau of Labor Statistics · 10:30 pm AEST
Medium
What markets look for
A return to positive payroll growth, or confirmation that February's softness was the start of a trend
Stabilisation or further movement in the unemployment rate from 4.4%
Average hourly earnings growth relative to core inflation — the wage-price dynamic the Fed watches closely
Weekly initial jobless claims as a real-time signal of whether layoff activity is rising
Inflation: CPI, PPI and PCE
Here is the uncomfortable truth about where inflation sits right now. Core personal consumption expenditures (PCE), the Fed's preferred gauge, was already running at 3.1% year on year in January, before any oil shock had fed through. The Fed had not fully solved its inflation problem, rather, it had slowed it down. That is a different thing.
And now, on top of a not-quite-solved inflation problem, oil prices have moved sharply higher. Energy prices can feed into the consumer price index (CPI) relatively quickly, through petrol, transport and logistics costs that can eventually show up in the price of nearly everything. The 10 April CPI print for March is probably the most important single data release of the month, it is the one that may tell us whether the energy shock is already showing up in the numbers the Fed watches.
Key dates (AEST)
10
Apr
Consumer price index (CPI) — March
Bureau of Labor Statistics · 10:30 pm AEST
High
14
Apr
Producer price index (PPI) — March
Bureau of Labor Statistics · 10:30 pm AEST
Medium
30
Apr
Personal income and outlays incl. PCE price index — March
Bureau of Economic Analysis · 10:30 pm AEST
High
What markets look for
Monthly CPI acceleration driven by energy and shelter components — the two stickiest inputs
PPI as a forward-looking signal: producer cost pressure tends to feed into consumer prices with a lag
PCE trends relative to the Fed's 2% target, particularly the core reading that strips out food and energy
Any sign that AI-related pricing power is feeding into corporate margins in ways that sustain elevated core readings
How this data may move markets
Scenario
Treasuries
USD
Gold
Cooling core inflation
↓ Yields fall
↓ Softer
↑ Supportive
Sticky or rising inflation
↑ Yields rise
↑ Firmer
↓ Headwind
Policy, trade and earnings
April is also the start of US earnings season, and this quarter's results carry an unusual amount of weight. Investors have been pouring capital into AI infrastructure on the basis that returns are coming. The question is when. With geopolitical volatility driving a rotation away from growth-oriented technology and towards energy and defence, JPMorgan Chase's 14 April earnings will be read as much for what management says about the macro environment as for the numbers themselves.
Then there is the FOMC meeting on 28 and 29 April. After the early-April run of data, including NFP, CPI and producer price index (PPI), the Fed will have more than enough information to update its language. Whether it signals that rate cuts could remain on hold through 2026, or whether it leaves the door slightly ajar, may be the most consequential communication of the quarter.
Geopolitical volatility has already pushed investors to reassess growth-heavy positioning. The estimated US$650 billion AI infrastructure buildout is also coming under heavier scrutiny on return on investment. If earnings season disappoints on that front, and if the FOMC signals a prolonged hold, the combination could test risk appetite heading into May.
Monitor this month (AEST)
◆
14 April - JPMorgan Chase Q1 earnings
The first major bank to report. Management commentary on credit conditions, consumer spending, and the macro outlook will set the tone for financial sector earnings and broader market sentiment.
◆
15 April - Bank of America Q1 earnings
A read on consumer credit conditions and household financial health, particularly relevant given rising energy costs and the 4.4% unemployment rate.
◆
28-29 April - FOMC meeting and policy statement
The month's most consequential event. The statement and any updated forward guidance may effectively confirm whether rate cuts remain a possibility for 2026.
◆
Ongoing - Strait of Hormuz tanker traffic
A live indicator of energy supply risk. Any escalation or resolution carries immediate implications for oil prices, inflation expectations, and the Fed's options.
◆
Ongoing - Sovereign AI export restrictions
Developing policy around technology export curbs may affect capital expenditure plans for US technology firms, with knock-on implications for growth and employment in the sector.
The Bigger Picture
Geopolitical volatility has forced a rotation into energy and defence at the expense of growth oriented technology positions. The estimated US$650 billion AI infrastructure buildout is increasingly being scrutinised for returns on investment. If earnings season disappoints on that front, and if the FOMC signals a prolonged hold, the combination could test risk appetite heading into May.