While recent data has shown core inflation moderating, core PCE is on track to average below target at just 1.6% annualised over the past three months.Federal Reserve Chair Jerome Powell made clear that concerns about future inflation, especially from tariffs, remain top of mind.“If you just look backwards at the data, that’s what you would say… but we have to be forward-looking,” Powell said. “We expect a meaningful amount of inflation to arrive in the coming months, and we have to take that into account.”While the economy remains strong enough to buy time, policymakers are closely monitoring how tariff-related costs evolve before shifting policy. Powell also stated that without these forward-looking risks, rates would likely already be closer to the neutral rate, which is a full 100 basis points from current levels.
2. The Unemployment Rate anchor
Powell repeatedly cited the 4.2% unemployment rate during the press conference, mentioning it six times as the primary reason for keeping rates in restrictive territory. At this level, employment is ahead of the neutral rate.“The U.S. economy is in solid shape… job creation is at a healthy level,” Powell added that real wages are rising and participation remains relatively strong. He did, however, acknowledge that uncertainty around tariffs remains a constraint on future employment intentions.If not for a decline in labour force participation in May, the unemployment rate would already be closer to 4.6%. Couple this with the continuing jobless claims ticking up and hiring rates subdued, risks are building around labour market softening.
3. Autumn Meetings are Live
While avoiding firm forward guidance, Powell hinted at a timeline:“It could come quickly. It could not come quickly… We feel like the right thing to do is to be where we are… and just learn more.”This suggests the Fed will remain on hold through the July meeting, using the summer to assess incoming data, particularly whether tariffs meaningfully push inflation higher. If those effects prove limited and unemployment begins to rise, the stage could be set for a rate cut in September.
By
Evan Lucas
The information provided is of general nature only and does not take into account your personal objectives, financial situations or needs. Before acting on any information provided, you should consider whether the information is suitable for you and your personal circumstances and if necessary, seek appropriate professional advice. All opinions, conclusions, forecasts or recommendations are reasonably held at the time of compilation but are subject to change without notice. Past performance is not an indication of future performance. Go Markets Pty Ltd, ABN 85 081 864 039, AFSL 254963 is a CFD issuer, and trading carries significant risks and is not suitable for everyone. You do not own or have any interest in the rights to the underlying assets. You should consider the appropriateness by reviewing our TMD, FSG, PDS and other CFD legal documents to ensure you understand the risks before you invest in CFDs.
Durante más de 110 años, la Reserva Federal (la Fed) ha operado a una distancia deliberada de la Casa Blanca y el Congreso.
Es la única agencia federal que no rinde informes a ninguna rama de gobierno en la forma en que lo hacen la mayoría de las agencias, y puede implementar políticas sin esperar la aprobación política.
Estas políticas incluyen las decisiones sobre tasas de interés, el ajuste de la oferta monetaria, los préstamos de emergencia a los bancos, los requisitos de reserva de capital para los bancos y la determinación de qué instituciones financieras requieren una mayor supervisión.
La Fed puede actuar de manera independiente en todas estas decisiones económicas críticas y más.
Pero, ¿por qué el gobierno de Estados Unidos permite esto? ¿Y por qué es que casi todas las grandes economías han adoptado un modelo similar para su banco central?
La fundación de la independencia de la Fed: el pánico de 1907
La Fed se estableció en 1913 tras el Pánico de 1907, una importante crisis financiera. Vio el colapso de los principales bancos, el mercado de valores caer casi 50% y los mercados crediticios se congelaron en todo el país.
En ese momento, Estados Unidos no tenía autoridad central para inyectar liquidez en el sistema bancario durante emergencias o para evitar que las quiezas bancarias en cascada derribaran a toda la economía.
J.P. Morgan orquestó personalmente un rescate utilizando su propia fortuna, destacando lo frágil que se había vuelto el sistema financiero estadounidense.
El debate que siguió reveló que si bien Estados Unidos claramente necesitaba un banco central, los políticos eran vistos objetivamente como mal posicionados para manejarlo.
Los intentos anteriores de la banca central habían fracasado en parte debido a la interferencia política. Los presidentes y el Congreso habían utilizado la política monetaria para servir a objetivos políticos a corto plazo en lugar de la estabilidad económica a largo plazo.
Por lo que se decidió que se crearía un organismo independiente responsable de tomar todas las decisiones económicas importantes. Esencialmente, la Fed se creó porque no se podía confiar en que los políticos, que enfrentan elecciones y presión pública, tomaran decisiones impopulares cuando fuera necesario para la economía a largo plazo.
Si bien la Fed está diseñada para ser un organismo autónomo, separado de la influencia política, todavía tiene rendición de cuentas al gobierno de Estados Unidos (y por lo tanto a los votantes estadounidenses).
El Presidente es responsable de nombrar a la Presidencia de la Fed y a los siete Gobernadores de la Junta de la Reserva Federal, sujeto a confirmación por parte del Senado.
Cada Gobernador sirve un mandato de 14 años, y el Presidente sirve un mandato de cuatro años. Los términos de los Gobernadores están escalonados para evitar que una sola administración pueda cambiar toda la junta de la noche a la mañana.
Más allá de esta junta “principal”, existen doce Bancos regionales de la Reserva Federal que operan en todo el país. Sus presidentes son designados por juntas del sector privado y aprobados por los siete gobernadores de la Fed. Cinco de estos presidentes votan las tasas de interés en un momento dado, junto a los siete Gobernadores.
Esto crea una estructura descentralizada donde ninguna persona o partido político puede dictar la política monetaria. Cambiar la dirección de la Fed requiere consenso entre múltiples personas designadas de diferentes administraciones.
El caso de la independencia de la Fed: Nixon, Burns y la resaca inflacionaria
El argumento más fuerte para mantener a la Fed independiente proviene de la época de Nixon como presidente en la década de 1970.
Nixon presionó al presidente de la Fed, Arthur Burns, para que mantuviera bajas las tasas de interés en el período previo a las elecciones de 1972. Burns cumplió, y Nixon ganó de manera arrollada. Durante la siguiente década, tanto el desempleo como la inflación subieron simultáneamente (comúnmente conocida ahora como “estanflación”).
A finales de la década de 1970, la inflación superaba el 13 por ciento, Nixon estaba fuera del cargo y era hora de nombrar un nuevo presidente de la Fed.
Ese nuevo presidente de la Fed fue Paul Volcker. Y a pesar de la presión pública y política para bajar las tasas de interés y reducir el desempleo, empujó la tasa hasta más del 19 por ciento para tratar de romper la inflación.
La decisión desencadenó una recesión brutal, con un desempleo que alcanzó casi el 11 por ciento.
Pero a mediados de la década de 1980, la inflación había vuelto a caer a los bajos de un solo dígito.
Inflación anterior a la era Volcker vs inflación de la era Volcker | FRED
Volcker se mantuvo firme donde los políticos no independientes habrían retrocedido ante el desploma de los números de las encuestas.
La “era Volcker” ahora se enseña como una clase magistral de por qué los bancos centrales necesitan independencia. El doloroso medicamento funcionó porque la Fed podría soportar una reacción política que habría roto a una institución menos autónoma.
¿Los demás bancos centrales son independientes?
Casi todas las principales economías desarrolladas tienen un banco central independiente. El Banco Central Europeo, el Banco de Japón, el Banco de Inglaterra, el Banco de Canadá y el Banco de la Reserva de Australia operan con una autonomía similar de sus gobiernos como la Fed.
No obstante, hay ejemplos de naciones desarrolladas que se han alejado de los bancos centrales independientes.
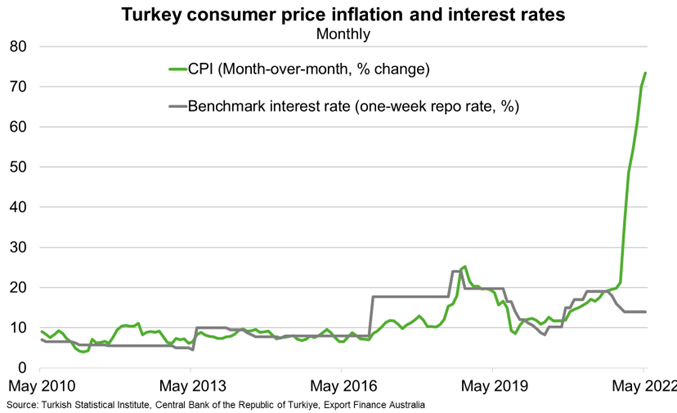
En Turquía, el presidente obligó a su banco central a mantener tasas bajas incluso cuando la inflación se disparó más allá del 85 por ciento. La decisión sirvió a objetivos políticos a corto plazo mientras devastaba el poder adquisitivo de la gente común.
Las recurrentes crisis económicas de Argentina se han visto exacerbadas por la política monetaria subordinada a las necesidades políticas. La hiperinflación de Venezuela se aceleró luego de que el gobierno aseverara un mayor control sobre su banco central.
El patrón tiende a mostrar que cuanto más control tiene el gobierno sobre la política monetaria, más se inclina la economía hacia la inestabilidad y una mayor inflación.
Los bancos centrales independientes pueden no ser perfectos, pero históricamente han superado a la alternativa.
Las tasas de interés de Turquía cayeron en 2022 a pesar de que la inflación se disparó
¿Por qué los mercados se preocupan por la independencia de la Fed?
Los mercados generalmente prefieren la previsibilidad, y los bancos centrales independientes toman decisiones más predecibles.
Los funcionarios de la Fed a menudo describen cómo planean ajustar la política y cuáles son sus puntos de datos preferidos.
Actualmente, el Índice de Precios al Consumidor (IPC), el índice de Gastos de Consumo Personal (PCE), los informes mensuales de empleos de la Oficina de Estadísticas Laborales (BLS) y las liberaciones trimestrales del PIB forman expectativas sobre la trayectoria futura de las tasas de interés.
Esta transparencia y previsibilidad ayudan a las empresas a mapear inversiones, a los bancos a establecer tasas de préstamo y a la gente común a planificar decisiones financieras importantes.
Cuando la influencia política se infiltra en estas decisiones, introduce incertidumbre. En lugar de seguir patrones predecibles basados en datos publicados públicamente, las tasas de interés pueden cambiar en función de consideraciones electorales o preferencias políticas, lo que dificulta la planificación a largo plazo.
Los mercados reaccionan a esta incertidumbre a través de la volatilidad de los precios de las acciones, las posibles subidas del rendimiento de los bonos y la fluctuación de los valores de las divisas.
La lógica perdurable
La independencia de la Reserva Federal se trata de reconocer que el dinero estable y el crecimiento sustentable requieren instituciones capaces de tomar decisiones impopulares cuando los fundamentos económicos las exigen.
Las elecciones siempre crearán presión para condiciones monetarias más fáciles. La inflación siempre tentará a los formuladores de políticas a retrasar ajustes dolorosos. Y el calendario político nunca se alineará perfectamente con los ciclos económicos.
La independencia de la Fed existe para navegar estas tensiones eternas, no perfectamente, pero mejor de lo que el control político ha logrado a lo largo de la historia.
Es por ello que este principio, forjado en pánicos financieros y refinado a través de sucesivas crisis, sigue siendo fundamental para el funcionamiento de las economías modernas. Y es por eso que los debates sobre la independencia de los bancos centrales, siempre que surgen, tocan algo fundamental sobre cómo las democracias pueden mantener la prosperidad a largo plazo.
The ASX 200 closed out the 2025 financial year on a high, reaching a new intra-month peak of 8,592 in June and within touching distance of the all-time record. The index delivered a 1.4% total return for the month, rounding off a strong final quarter with a 9.5% return and locking in a full-year gain of 13.8% — its best performance since 2021.This strong finish all came down to the postponement of the Liberation Day tariffs. From the April 7 lows through to the end of the financial year, the ASX followed the rest of the world. Mid-cap stocks were the standout performers, beating both large and small caps as investors sought growth opportunities away from the extremes of the market. Among the sectors, Industrials outperformed Resources, benefiting from more stable earnings and supportive macroeconomic trends tied to infrastructure and logistics.But the clear winner was Financials, which contributed an incredible 921 basis points to the overall index return. CBA was clearly the leader here, dominating everything with 457 basis points on its own. Westpac, NAB, and others also played a role, but nothing even remotely close to CBA. The Industrials and Consumer Discretionary sectors made meaningful contributions, adding 176 and 153 basis points, respectively. While Materials, Healthcare, and Energy all lagged, each detracting around 45 to 49 basis points. Looking at the final quarter of the financial year, Financials were by far the biggest player again, adding 524 basis points — more than half the quarter’s total return of 9.5%. Apart from a slight drag from the Materials sector, all other parts of the market made positive contributions. Real Estate, Technology, and Consumer Discretionary followed behind as key drivers. Once again, CBA was the largest individual contributor, adding 243 basis points in the quarter, while NAB, WBC, and Macquarie Group added a combined 384 basis points. On the other side of the ledger, key underperformers included BHP, CSL, Rio Tinto, Treasury Wine Estates, and IDP Education, which all weighed on quarterly performance.One of the most defining features of the 2025 financial year was the dominance of price momentum as a market driver — something we as traders must be aware of. Momentum strategies far outpaced more traditional, fundamental-based approaches such as Growth, Value, and Quality. The most effective signal was a nine-month momentum measure (less the most recent month), which delivered a 31.2% long-short return. The more commonly used 12-month price momentum factor was also highly effective, returning 23.6%. By contrast, short-term reversals buying last month’s losers and selling last month’s winners was the worst-performing approach, with a negative 16.4% return. Compared to the rest of the world, the Australian market was one of the strongest trades for momentum globally, well ahead of both the US and Europe, despite its relatively slow overall performance.Note: these strategies are prone to reversal, and in the early days of the new financial year, there has been a notable shift away from momentum-based trading to other areas. Now is probably too early to say whether this marks a sustained change, but it cannot be ignored, and caution is always advised.The second big story of FY26 will be CBA. CBA’s growing influence was a key story of FY25. Its weight in the index rose by an average of 2.1 percentage points across the year, reaching an average of 11.5% by June. That helped push the spread between the Financials and Resources sectors to 15.8 percentage points — the widest gap since 2018. Despite the strong cash returns, market valuations are eye-watering; at one point during June, CBA became the world’s most expensive bank on price metrics. The forward price-to-earnings multiple now sits at 18.9 times. This is well above the long-term average of 14.7 and higher than the 10-year benchmark of 16.1. Meanwhile, the dividend yield has slipped to 3.4%, down from the historical average of 4.4%. Earnings momentum remains soft, with FY25 growth estimates still tracking at 1.4%, and FY26 forecast at a moderate 5.4%. This suggests that recent gains have come more from expanding valuation multiples than from actual earnings upgrades, making the August reporting date a catalyst day for it and, by its size, the market as a whole.On the macro front, attention now turns to the Reserve Bank of Australia. The central bank cut the cash rate by 25 basis points to 3.6% at its July meeting. Recent commentary from the RBA has taken on a more dovish tone, with benign inflation data and ongoing global uncertainty expected to outweigh the strength of the labour market. The RBA appears to be steering toward a neutral policy stance, and markets will be watching for further signals on how that shift will be managed. Recent economic data has been mixed. May retail sales were weaker than expected, while broader household spending indicators held up slightly better. Building approvals saw a smaller-than-hoped-for bounce, employment remains strong, but productivity is low. Inflation is now at a 3-year low and falling; all this points to underlying support from the RBA’s easing bias both now and into the first half of FY26.As we move into FY26, the key questions are:
Can fundamentals wrestle back control over momentum?
Will earnings growth catch up to price to justify valuations?
How will policy decisions from the RBA and other central banks shape investor sentiment in an ever-volatile world?
While the early signs suggest a possible rotation, the jury is still out on whether this marks a new phase for the Australian market or just a brief pause in the rally that defined FY25.
While recent data has shown core inflation moderating, core PCE is on track to average below target at just 1.6% annualised over the past three months.Federal Reserve Chair Jerome Powell made clear that concerns about future inflation, especially from tariffs, remain top of mind.“If you just look backwards at the data, that’s what you would say… but we have to be forward-looking,” Powell said. “We expect a meaningful amount of inflation to arrive in the coming months, and we have to take that into account.”While the economy remains strong enough to buy time, policymakers are closely monitoring how tariff-related costs evolve before shifting policy. Powell also stated that without these forward-looking risks, rates would likely already be closer to the neutral rate, which is a full 100 basis points from current levels.
2. The Unemployment Rate anchor
Powell repeatedly cited the 4.2% unemployment rate during the press conference, mentioning it six times as the primary reason for keeping rates in restrictive territory. At this level, employment is ahead of the neutral rate.“The U.S. economy is in solid shape… job creation is at a healthy level,” Powell added that real wages are rising and participation remains relatively strong. He did, however, acknowledge that uncertainty around tariffs remains a constraint on future employment intentions.If not for a decline in labour force participation in May, the unemployment rate would already be closer to 4.6%. Couple this with the continuing jobless claims ticking up and hiring rates subdued, risks are building around labour market softening.
3. Autumn Meetings are Live
While avoiding firm forward guidance, Powell hinted at a timeline:“It could come quickly. It could not come quickly… We feel like the right thing to do is to be where we are… and just learn more.”This suggests the Fed will remain on hold through the July meeting, using the summer to assess incoming data, particularly whether tariffs meaningfully push inflation higher. If those effects prove limited and unemployment begins to rise, the stage could be set for a rate cut in September.
Las acciones de defensa de ASX vuelven a estar en más listas de vigilancia y según el Instituto Internacional de Investigación para la Paz de Estocolmo (SIPRI), el gasto militar mundial alcanzó aproximadamente 2.718 billones de dólares en 2024, un alza de 9.4% en términos reales.
El entorno actual de defensa de Australia se establece en la Estrategia de Defensa Nacional de 2024 y los documentos de planificación de inversiones relacionados, que describen las prioridades de financiación de la capacidad a largo plazo. Además, Canberra ha apuntado a una inversión de capacidad de 330 mil millones de dólares australianos hasta 2034, incluida la financiación adicional para combatientes de superficie, preparación, ataque de largo alcance y sistemas autónomos.
Aquí está la parte que la mayoría de la gente extraña: no todas las acciones de defensa ASX son del mismo comercio. Algunos se sientan cerca de la construcción naval. Algunos son nombres de contra-drones y algunos son operadores más pequeños y de mayor riesgo donde un contrato puede importar mucho más de lo que el mercado supone.
Estos cinco nombres no son una lista de compras, sino que son una lista de vigilancia práctica para los inversores que intentan entender dónde puede aparecer realmente el impulso de adquisiciones en el ASX.
1) Austal (ASX: ASB)
Austal es una de las empresas cotizadas en ASX más directamente expuestas al oleoducto de construcción naval de Australia, aunque la ejecución del contrato, los márgenes y el tiempo de entrega siguen siendo variables importantes.
No solo están ganando contratos aleatorios; han firmado un acuerdo legal masivo (el Acuerdo Estratégico de Construcción Naves) que los convierte en el socio oficial para la construcción de la próxima generación de buques militares de tamaño mediano de Australia en Australia Occidental.
En febrero de 2026, el gobierno dio luz verde a Austal a un proyecto de 4 mil millones de dólares. Esto no es para un solo barco, es para 8 buques “Landing Craft Heavy”. Se trata de enormes barcos de transporte (de unos 100 metros de largo) diseñados para llevar tanques pesados y equipos directamente a una playa. Pero aquí está la parte que la mayoría de la gente extraña, la construcción naval es un maratón, no un sprint.
Como puede ver en el cronograma de entrega, mientras que la construcción comienza en 2026, el barco final no se entregará hasta 2038. Para un inversionista, esto significa que Austal tiene un flujo de ingresos “garantizado” para los próximos 12 años, pero tienen que ser muy buenos en el manejo de sus costos durante ese largo período para realmente obtener ganancias.
2) Escudo del DroneShield (ASX: DRO)
Si ha visto imágenes de pequeños drones que interrumpen los campos de batalla modernos, DroneShield está construyendo parte del “interruptor de apagado”. Su enfoque es la tecnología antidrones, que incluye sistemas que detectan, interrumpen o derrotan drones utilizando guerra electrónica, sensores y herramientas dirigidas por software, en lugar de depender solo de municiones tradicionales.
A principios de 2026, DroneShield había ido más allá de la etiqueta de una prometedora start-up y se había adentrado en una fase comercial mucho más grande. Reportó ingresos para el año fiscal 2025 por 216.5 millones de dólares estadounidenses, un 276% más que en el año fiscal 2024, y dijo que inició el año fiscal 2026 con 103.5 millones de dólares de A$ en ingresos comprometidos.
Un punto que el mercado puede pasar por alto es la capa de software en el modelo. DroneShield reportó 11.6 millones de dólares estadounidenses en ingresos de Software como Servicio (SaaS) en el año fiscal 2025 y dijo que está trabajando para que SaaS represente el 30% de los ingresos dentro de cinco años. Su modelo de suscripción incluye actualizaciones de software para sistemas implementados, lo que agrega un flujo creciente de ingresos recurrentes junto con las ventas de hardware.
Entre las acciones de defensa ASX, DroneShield es una de las formas más directas de seguir el tema Counter-UAS. También es uno de los nombres donde el sentimiento puede oscilar rápidamente, porque las historias de crecimiento pueden regenerar tanto hacia arriba como hacia abajo cuando cambia el tiempo de los pedidos.
EOS construye tanto el “cerebro” como el “músculo” para plataformas militares. Es mejor conocido por los sistemas de armas remotas, que permiten a los operadores controlar torretas armadas desde el interior de vehículos protegidos, y por los sistemas láser de alta energía dirigidos a la defensa contra drones. EOS ha dicho que su rezago incondicional alcanzó alrededor de 459.1 millones de dólares estadounidenses a principios de 2026, tras una serie de victorias contractuales hasta 2025. Eso apunta a una base mucho mayor de trabajo seguro, aunque el tiempo de entrega y la conversión de ingresos siguen siendo importantes.
EOS firmó un contrato de 71.4 millones de euros, unos 125 millones de dólares australianos, con un cliente europeo para un sistema de armas láser de alta energía de 100 kilovatios. EOS dice que el sistema está diseñado para un bajo costo por disparo y puede involucrar hasta 20 drones por minuto. El gobierno australiano ha reservado 1.300 millones de dólares australianos a lo largo de 10 años para la adquisición de capacidad de contra-drones, y EOS ha revelado que formó parte de un exitoso equipo de licitación de LAND 156. Eso no garantiza ingresos futuros, pero sí soporta visibilidad a mediano plazo en un mercado al que la compañía ya se dirige.
EOS se lee como una historia de rebote, pero una que aún depende de la ejecución. La compañía se ha reorientado en torno a sistemas de armas remotas, sistemas de contra-drones y láseres, todas áreas vinculadas a un mayor gasto en defensa. La pregunta clave es si puede seguir convirtiendo el backlog y la canalización en ingresos entregados mientras mantiene la disciplina del balance.
4) Codan (ASX: CDA)
Codan a veces se deja fuera de las listas de acciones de defensa casuales porque está más diversificado. Eso puede ser un descuido. En sus resultados del primer semestre fiscal 26, Codan dijo que su negocio de Comunicaciones diseña comunicaciones de misión crítica para los mercados militares y de seguridad pública globales. Los ingresos por comunicaciones subieron 19% a 221,8 millones de dólares de A$. La compañía también dijo que DTC brindó un fuerte crecimiento de la demanda de sistemas no tripulados y de defensa, con ingresos por sistemas no tripulados que aumentaron 68% a A$73 millones. Codan dijo que aproximadamente la mitad de esos ingresos no tripulados estaban vinculados a aplicaciones de defensa operativa en zonas de conflicto.
Aquí es donde la historia se vuelve más matizada. En una canasta de acciones de defensa ASX, Codan puede ofrecer un perfil diferente, con una sensibilidad de titular menos pura, una diversificación operativa más amplia y una exposición significativa a las comunicaciones militares y los sistemas no tripulados sin ser un nombre de tema único. Esa diversificación también puede significar que las acciones no siempre se negocian como un nombre de defensa de juego puro.
HighCom se encuentra en el extremo especulativo de esta lista, y debería etiquetarse de esa manera. La compañía dice que sus dos negocios continuos son HighCom Armor, que suministra protección balística, y HighCom Technology, que suministra y mantiene pequeños y medianos sistemas aéreos no tripulados, sistemas aéreos contra-no tripulados, e ingeniería relacionada, integración, mantenimiento y apoyo logístico para la ADF y otros ejércitos regionales alineados.
En el primer trimestre del año fiscal 26, los ingresos por operaciones continuas cayeron 59% a A$10.9 millones, mientras que el EBITDA pasó a una pérdida de A$5.4 millones desde una ganancia de A$1.9 millones un año antes. HighCom también reveló 5,1 millones de dólares australianos en ingresos de HighCom Technology, incluidos 3,5 millones de dólares australianos de piezas de repuesto para sistemas aéreos no tripulados (SUAS) y 1,6 millones de dólares australianos por servicios de sostenimiento prestados al Departamento de Defensa de Australia.
Entonces sí, HighCom es una de las acciones de defensa ASX más sensibles financieramente en la junta. Pero también es el tipo de nombre más pequeño que puede mostrar cómo las adquisiciones se filtran hacia el soporte, el mantenimiento y el equipo de protección especializado.
Observaciones clave del mercado
Haga un seguimiento de los hitos del programa, no solo los titulares políticos. Las adjudicaciones de contratos, los inicios de fabricación, los cronogramas de entrega y el trabajo de mantenimiento a menudo importan más que un solo día de anuncio.
Separe la exposición pura de la exposición diversificada. DroneShield y EOS están más cerca de los temas concentrados de tecnología de defensa, mientras que Codan aporta exposición a las comunicaciones dentro de una combinación de negocios más amplia.
Vea temas de capacidad soberana en Australia. Austal y EOS están vinculados a la fabricación local, la integración y las cadenas de suministro australianas, lo que respalda el tema de capacidad soberana más amplio en este grupo.
Presta atención a los balances y conversión de efectivo. El impulso de las adquisiciones puede ser real incluso cuando el tiempo se vuelve desordenado. La última mitad de HighCom es un recordatorio de eso.
Los titulares de defensa pueden parecer inmediatos. Por lo general, las ganancias no lo son. El principal trabajo naval de Austal se extiende hasta la próxima década. Los contratos EOS se entregan a lo largo de varios años. El flujo de pedidos de DroneShield parece sólido, pero la compañía aún separa los ingresos comprometidos de una oportunidad de canalización más amplia. HighCom muestra la otra cara de la moneda. La exposición a las adquisiciones no se traduce automáticamente en una ejecución financiera fluida.
Las referencias a las acciones de defensa que cotizan en ASX son solo información general, no una recomendación para comprar, vender o mantener cualquier título o CFD. Estas acciones pueden ser altamente volátiles y son sensibles al momento de los contratos, la política gubernamental, la geopolítica, el riesgo de ejecución y las condiciones del mercado. Las expectativas de backlog, pipeline e ingresos no son garantías de performance futuro.
Tres bancos centrales están decidiendo las tasas simultáneamente, el crudo Brent se balancea salvajemente alrededor de 100 dólares el barril, y una guerra en el Medio Oriente está reescribiendo las perspectivas de inflación en tiempo real. Pase lo que pase esta semana podría marcar la pauta para los mercados para el resto de 2026.
Datos rápidos
El Banco de la Reserva de Australia (RBA) anuncia su próxima decisión sobre la tasa de efectivo el martes, con los mercados ahora valorando una probabilidad del 66% de una segunda subida a 4.1%.
Algunos analistas han advertido que la guerra de Irán podría empujar la inflación estadounidense a 3.5% para fin de año y retrasar los recortes de tipos de la Fed hasta septiembre, lo que convierte el diagrama de puntos del FOMC de esta semana en el más observado en años.
El crudo Brent está coqueteando con 100 dólares el barril después de que Irán lanzara lo que medios estatales describieron como su “operación más intensa desde el comienzo de la guerra”.
RBA: ¿Australia volverá a subir?
El RBA elevó la tasa de caja por primera vez en dos años a 3.85% en su reunión de febrero luego de que la inflación repuntara materialmente en el segundo semestre de 2025.
La pregunta ahora es si vuelve a moverse antes incluso de ver la próxima impresión trimestral del IPC, que no vence hasta el 29 de abril.
El vicegobernador Andrew Hauser reconoció antes de la reunión que los formuladores de políticas enfrentan una decisión genuinamente dividida, moldeada por señales económicas conflictivas en el país y la creciente inestabilidad en el extranjero.
Actualmente los mercados financieros asignan alrededor de un 66% de probabilidad a otra alza, con un aumento de mayo considerado prácticamente seguro independientemente de lo que ocurra el lunes.
Fechas clave
Decisión sobre la tasa de efectivo del RBA: martes 17 marzo, 14:30 h AEDT
Conferencia de prensa del gobernador Bullock: martes 17 marzo, 15:30 h AEDT
Monitorear
Cualquier referencia de Bullock a nuevas subidas es probable en mayo
FOMC: Es probable que todos los ojos estén puestos en el diagrama de puntos
El FOMC se reúne del 17 al 18 de marzo, con la declaración de política programada para las 2:00pm ET del 18 de marzo y la conferencia de prensa del presidente Jerome Powell a las 2:30pm. El CME FedWatch muestra una probabilidad del 99% de que la Fed mantenga las tasas en 3.50% a 3.75%.
El verdadero accionar se encuentra en el Resumen de Proyecciones Económicas (SEP) y el diagrama de puntos. El punto medio actual muestra un corte de 25 puntos básicos para 2026. Si cambia a dos cortes, eso es dóciles y alcistas para los activos de riesgo. Si se desplaza a cero recortes o agrega una subida de tasas a la proyección, los mercados podrían reaccionar en la otra dirección.
Para complicar aún más las cosas, el mandato de Powell como Presidente de la Reserva Federal expira el 23 de mayo de 2026. Kevin Warsh es el principal candidato para reemplazarlo, visto como más duro en política monetaria. Cualquier comentario de Powell sobre esta transición podría mover los mercados independientemente de la decisión de tasa en sí.
Fecha clave
Decisión de tasa FOMC + Gráfica SEP/punto: jueves 19 de marzo, 4:00 a.m. AEDT
Conferencia de prensa de Powell: jueves 19 de marzo, 4:30 a.m. AEDT
Monitorear
El lenguaje de Powell sobre el petróleo y la inflación arancelaria.
Reacción de rendimiento de tesorería a 2 años.
Reajuste de precios de FedWatch de CME para cualquier cambio en la probabilidad de corte de septiembre.
Banco de Japón: Podría adelantarse un mayor endurecimiento
El BOJ se reúne del 18 al 19 de marzo, con la decisión prevista para el jueves por la mañana, hora de Tokio. La tasa de política actual se sitúa en 0.75% (un máximo de 30 años), y la reunión de enero de 2026 produjo una retención en una votación de 8-1.
El gobernador Ueda ha categorizado la reunión de marzo como “en vivo”, señalando que el cronograma para un mayor endurecimiento podría “adelantarse” si las negociaciones salariales de primavera de Shunto arrojan resultados más fuertes de lo esperado.
Esos resultados van a comenzar a fluir durante la semana, convirtiéndolos en el insumo crítico para la decisión del BOJ. Nomura espera que las subidas salariales de Shunto 2026 lleguen en torno al 5.0%, incluida la antigüedad, con un crecimiento salarial base de aproximadamente 3.4%. Si los resultados confirman esa trayectoria, el caso de una alza en marzo se fortalece considerablemente.
La complicación es el telón de fondo global. Japón importa aproximadamente el 90% de sus necesidades energéticas, y el petróleo alrededor de 100 dólares por barril está empujando al alza los costos de importación y amenazando con agregar presión inflacionaria. Una subida del BOJ a un shock petrolero global sería un movimiento inusualmente audaz.
La mayoría de los participantes del mercado aún se inclinan hacia una espera en esta reunión, siendo abril o julio vistos como el momento más probable para el próximo movimiento.
Fecha clave
Decisión sobre la tasa de política del BOJ (actualmente 0.75%): Jueves 19 de marzo, mañana AEDT
Monitorear
Resultados salariales de Shunto como principal detonante de un alza en marzo.
Idioma de la conferencia de prensa de Ueda y orientación a futuro en abril y julio.
El crudo Brent tocó brevemente 119,50 dólares por barril a principios de semana antes de caer 17% a menos de US$80, luego rebotando hacia US$95 ante señales mixtas de Washington sobre el Estrecho de Ormuz.
Al jueves, Brent estaba de vuelta por más de 100 dólares, ya que Irán lanzó nuevos ataques contra el transporte marítimo comercial y la liberación de la reserva de la AIE no logró brindar un alivio significativo.
En el escenario donde un conflicto más prolongado inflige daños a la infraestructura energética, los analistas estiman que el IPC podría subir a 3.5% para fines de 2026, con los precios de la gasolina acercándose a los 5 dólares por galón en el segundo trimestre.
Para esta semana, el petróleo actúa como una macro meta-variable. Cada titular geopolítico, señal de alto el fuego, ataque de petroleros, liberación de reservas y comentario de Trump podrían mover acciones, bonos y monedas en tiempo real.
Monitorear
Cualquier flujo de petrolero reanudado del Estrecho de Ormuz.
Los ataques estadounidenses e israelíes contra Irán lanzados el 28 de febrero hicieron que el crudo Brent superara los 119 dólares el barril, el oro por encima de los 5.200 dólares, y acciones de defensa a máximos históricos.
En ese contexto, los inversionistas se están enfocando en un pequeño grupo de nombres vinculados a materias primas que pueden seguir siendo sensibles a nuevos movimientos en petróleo, GNL y oro. La pregunta clave es si el choque resulta sostenido, o si un alto el fuego, la normalización del transporte marítimo o una acción política eliminan parte de la prima de riesgo geopolítico.
1. ExxonMobil (NYSE: XOM)
ExxonMobil ha sido uno de los beneficiarios más claros del aumento de precios. Las acciones alcanzaron un máximo histórico de US$159,60 a principios de marzo y están subiendo aproximadamente 28% en lo que va de año.
La compañía produce 4.7 millones de barriles de petróleo equivalente por día, tiene un punto de equilibrio en la Cuenca Pérmica de alrededor de 35 dólares por barril, y está comprometida con 20 mil millones de dólares en recompras para 2026.
Wells Fargo elevó su objetivo de precios a 183 dólares desde 156 dólares tras la escalada, mientras que el consenso de analistas más amplio se sitúa en torno a US$140—US$144. Sin embargo, XOM ya está negociando por encima de muchos objetivos de consenso, y la interrupción de su socio de GNL QatarEnergy plantea un viento en contra operativo a corto plazo.
Qué ver
Si las interrupciones de Ormuz persisten más allá de 4 a 6 semanas.
Una liberación de las existencias de emergencia del G7 o un alto el fuego creíble podrían comprimir la prima de riesgo de guerra.
Cualquier ajuste a los objetivos de consenso de los analistas.
Chevron tocó un nuevo máximo de 52 semanas de 196,76 dólares a principios de marzo y ha subido aproximadamente 24% en lo que va de año.
El punto de equilibrio Brent de la compañía para dividendos y gastos de capital ronda los 50 dólares por barril. Esto significa que a los precios actuales del petróleo por encima de los 90 dólares, está generando un importante flujo de caja libre.
Sin embargo, Chevron ha detenido temporalmente las operaciones en un campo de gas frente a la costa de Israel tras la actividad de misiles en la región, y desde entonces el stock ha retrocedido más del 1% ya que el conflicto afecta directamente sus operaciones.
Qué ver
Actualizaciones operativas directas de los activos israelíes y de Oriente Medio de Chevron.
Cualquier otra paralización que pueda pesar sobre la producción a corto plazo.
Retención de crudo por encima de los 90 dólares, lo que mantiene a Chevron generando un importante flujo de caja libre.
3. Woodside Energy (ASX: WDS/NYSE: WDS)
Dado que Qatar detuvo la producción después de los ataques con aviones no tripulados iraníes, los compradores de toda Asia y Europa están buscando un suministro alternativo. Woodside, como uno de los mayores productores y exportadores de GNL de Australia, se encuentra fuera de la zona de conflicto y está bien posicionado para beneficiarse de la demanda redireccionada.
Los analistas advirten que la sustitución real lleva tiempo debido a las restricciones de envío y del contrato, lo que significa que el aumento de precios puede ser más duradero que un simple comercio al contado. Los precios del gas de referencia del TTF europeo se dispararon más del 50% en una semana, amplificando el entorno de margen para los productores de GNL que no son de Oriente Medio.
Qué ver
El ritmo y el cronograma de cualquier reinicio de la producción de GNL de Qatar.
Si QatarEnergy permanece fuera de línea durante semanas, Woodside podría comenzar a recontratar compradores europeos a precios puntuales elevados.
Un movimiento del dólar australiano al alza podría ser un viento en contra que vale la pena rastrear para las ganancias denominadas en USD.
4. Cheniere Energy (NYSE: GNL)
Junto a Woodside, Cheniere es el beneficiario estadounidense más directo de la interrupción del GNL de Qatar. Al ser el mayor exportador de GNL de Estados Unidos, vio fortaleza intradiaria al inicio de la semana del conflicto.
La producción nacional de energía de Estados Unidos ha amortiguado a los consumidores estadounidenses de lo peor de la conmoción, pero la prima de exportación se ha ampliado a medida que los compradores europeos y asiáticos pagan por el suministro fuera del Golfo.
El comercio es “geopolíticamente sensible”, y cualquier resolución podría revertir rápidamente al alza. Pero mientras la infraestructura de gas de Ormuz y del Golfo siga comprometida, Cheniere está posicionada para beneficiarse estructuralmente.
Qué ver
Cualquier avance diplomático que reabra las rutas marítimas del Golfo.
Anuncios de nuevos contratos de rebajas a largo plazo firmados a precios actuales elevados.
El oro repuntó 5.2% en una sola sesión el 1 de marzo, al tocar los US$5,246/oz, ya que los mercados buscaban activos de refugio seguro. Newmont, el mayor productor de oro del mundo, ha visto sus reservas efectivamente revaluadas a estos precios.
Está al alza junto con la ganancia anual del 24% del oro hasta la fecha, y sus costos de sostenimiento total permanecen en gran medida fijos.
No obstante, los mineros de oro se vendieron bruscamente el 4 de marzo, y Newmont cayó casi 8% en una sola sesión, ya que un desapalancamiento más amplio del riesgo afectó a las renta variable de metales preciosos.
El stock se ha recuperado desde entonces, pero la volatilidad sigue siendo alta. Para los inversionistas de mayor duración, los analistas señalan que las jurisdicciones mineras “seguras” como Canadá, Australia y Nevada están ordenando nuevas primas a medida que la inestabilidad de Oriente Medio eleva el valor del suministro geopolíticamente seguro.
Qué ver
Si el oro puede aguantar más de US$5,000/oz.
Un conflicto prolongado podría acelerar un ciclo de M&A en mineros de oro junior.
Un alto el fuego o un evento amplio de desapalancamiento de la equidad como riesgo principal a monitorear.
Lockheed Martin alcanzó un nuevo máximo histórico de 676.70 dólares el 3 de marzo, un aumento de más del 4% durante el día. Sus cazas F-35, municiones guiadas de precisión, sistemas THAAD y artillería de cohetes HIMARS son fundamentales para la campaña aérea en curso.
El Departamento de Defensa de Estados Unidos se está moviendo para reponer las reservas de municiones, y la ambición declarada de Trump de elevar el presupuesto de defensa de Estados Unidos a 1,5 billones de dólares para 2027 agrega un viento de cola estructural a más largo plazo más allá del conflicto inmediato.
Las acciones de defensa están subiendo en medio de la clásica fijación de precios de riesgo geopolítico, pero los inversores deben tener en cuenta que el flujo contractual real tarda tiempo en traducirse en ganancias, y las valoraciones ya reflejan un optimismo considerable.
Qué ver
El ritmo de las órdenes de reposición de municiones del Departamento de Defensa de Estados Unidos.
La rapidez con la que gana el contrato se traduce en un crecimiento del backlog.
Barrick está siguiendo la racha histórica del oro junto a Newmont, con las acciones subidas bruscamente en lo que va de año. Se encuentra en una capitalización bursátil de aproximadamente 78 mil millones de dólares estadounidenses y está reportando proyecciones récord de flujo de caja libre, ya que sus costos de mantenimiento total se mantienen muy por debajo de los precios al contado actuales.
Al igual que Newmont, experimentó una fuerte venta en una sola sesión de más del 8% durante el evento más amplio de desapalancamiento del 4 de marzo, antes de recuperarse parcialmente.
Las empresas de regalías y streaming como Wheaton Precious Metals (WPM) están siendo favorecidas por algunos inversores como una forma más protegida contra la inflación de acceder al oro al alza, dada su menor exposición a los costos operativos. Pero Barrick sigue siendo uno de los mineros de oro que cotizan en bolsa más grandes del mundo, con ganancias que son muy sensibles a los cambios en el precio del oro.
Qué ver
La capacidad del oro para mantener por encima de US$5,000/oz.
Cualquier Barrick se mueve hacia adquisiciones de mineros junior.
Inflación de costos de energía, ya que el aumento de los precios de los combustibles podría comenzar a exprimir los márgenes operativos de los mineros.