
热门话题
目前俄乌战争局势已经是进行了差不多三个月,按照我们的预计基本上接近尾声了。这个尾声不一定是军事行动马上终止,而是政治压力开始缓和。主要的原因还是来自于西方国家内部面临严峻的通胀,且通胀对经济造成了非常负面的影响。

英国通胀创出了近40年新高,CPI高达9%以上,也就意味着如果咱们收入在单月没有增加9%,其实收入就降低了,生活水准都在下降。这种背景下,西方政府靠选民投票选举,如果加一箱油100多刀的话,咱们都不开心。一个星期多花费200刀加油,一年就是1万刀油费没了。所以西方各国目前对待俄罗斯的政策出现了分歧。俄罗斯本周面临一次债务违约风险,可能出现这一个世纪以来首次违约。俄罗斯需要支付4亿美元的利息,如果是这些利息都无法支付,基本上就意味着一个国家的政府信用破产。目前的情况下,并不是说俄罗斯没有钱来兑付,只是说它没有外币没有美元,因为它的美元都被冻结了,国际制裁阻碍了俄罗斯在海外的资金流动。目前石油价格上涨,虽然西方不买,但是还有别的国家买,能源上的收入每周大概能进账40亿美元。所以俄罗斯目前是非常有钱的,但美国俄罗斯对俄罗斯制裁一直在延续,也非常坚定。俄罗斯有15个未偿付的国际债券,约400亿美元。
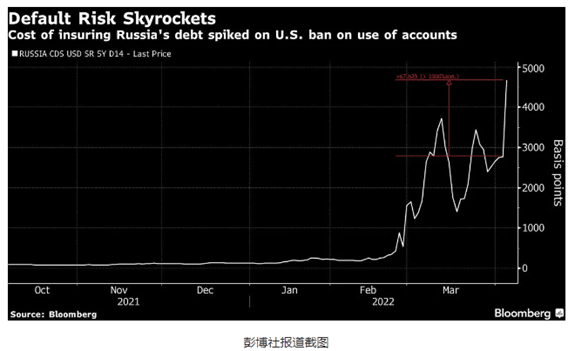
现在普京也是在寻找解决办法,在周三的时候已经签订了一项法令确立支付外币政府债务的一个方法,是通过卢布来偿还欧洲债务,这个也会被视为俄罗斯履行债务的一项依据,因为是他确实没有美元对吧?因为美元都被冻结了,所以只能用卢布来结算。大家也知道俄罗斯卢布目前贬值风险依旧非常大,并且它的流通性在海外并没有什么价值。像人民币一直想走出去,使人民币在部分国家地区具有一定的流通价值,但是卢布比人民币的影响力还要弱一些,所以难以得到西方政府的认可。当然西方政府只能拿到这些卢布去购买俄罗斯石油天然气,相当于开放了美国对俄罗斯在能源领域的一个制裁缺口,这个缺口如果打开了之后,欧美的联盟就不是那么紧密了,在制裁俄罗斯的问题上就必然出现更大的分歧,如果不花掉这些卢布,那么就相当于是利息完全打水漂了。国际信用评级标准普尔就以俄罗斯的卢布偿付上述近6.5亿美元债券本金和债息为由,将俄罗斯的外币发行人评级下调至“选择性违约”。而俄罗斯违约对债券市场影响也很大。1998年夏俄罗斯债务违约引发的市场波动导致美国对冲基金公司——长期资本管理公司倒闭。这一次债务违约如果变得严重,将对国际债券市场再次造成恐慌性动荡,进而影响股市和其他资本市场。当然,从法律逻辑上来讲的话,俄罗斯这个方法是非常恰当的,第一能够避免国家债务面临违约风险,同时又把这个难题抛给了欧洲。如果你接受了卢布你就要给他花掉,如果你不接受或者你接受了不花,其实就意味着欧洲放弃了这些利息收益甚至本金。俄罗斯的财长也公开表示俄罗斯会将债务转换成其他国家的货币。他用了一个非常恰当的一句话,就是说我们尽可能的把马带到水边,但是马是否想喝水并不取决于我们,而是取决于马。就是说给了这个方案,接不接受就看西方国家了,非常巧妙的把这个问题又重新抛回去了。
其实对海外来讲,对尤其是对美国来讲,对这一举措其实是不屑一顾的,因为美国认为你借了美债,必须也要偿还美元。如果偿还其他的货币或者其他的物资,以这种形式的话都意味着该国信用需要下调,融资成本上升,国际地位下降。美国已经达到了目的。目前无法得出俄罗斯是否属于违约的结论,我们还是要看到周末以及下周一,市场对俄罗斯这个行为会做出怎样的反应,如果是反应过激的话,未来的石油价格能源价格的波动还会非常巨大,黄金和粮食价格可能会再次上涨。对于黄金价格,一般通胀高的时候,黄金是有一定的抗通胀的能力的,价格会走高。但是现在,随着美国加息,美元非常强,一直在100上方徘徊,日元持续在贬值。日元在避险情绪上是跟黄金有类似功能的,包括比特币也是有避险功能的,所以日元一直在贬值,创出新低,黄金也没涨上去,一直是在1830左美金左右附近徘徊,比特币价格前段时间跌破了2万美元大关。所以在短期来讲,逻辑非常清晰,就是美元加息持有黄金的成本是上升的,你持有美元的话每年是能达到2% 3%的利息的,持有黄金是没有任何的利息收入的,所以相应的持有成本在上升,机会成本也在上升。在这种背景下,如果大家想要去做黄金类的投资,持有周期会长一点。澳大利亚的金矿还是非常不错的,像 Northern star resources这家公司我们以它为例的话,它底下包括好多的金矿,这些矿的市值和矿的规模都是比较确定的,所以说公司的股票市值基本上等于储量,乘以目前的黄金价格,减去它的开采成本,最终得出这家公司的最终利润。
上一个财年,这家公司收入同比增长了40%,利润增长了216%,达到了22.68亿,增长是非常明显的。公司持有大量的现金,这些钱他没有地方花的对吧?除非是要勘探开采,可能会花掉一两个亿,剩的这几十亿的现金,没有什么使用或者消耗的地方。对于黄金这种企业,现金流动性是非常不错的。在目前加息的背景下面,买黄金和买黄金矿,我们可能会更加推荐买黄金矿的这些上市公司。同时金矿开采在澳大利亚是一个非常成熟的行业,基本上所有的运营商平均开采成本是在800美金到1000美金左右,也就是说目前的黄金价格基本上他们获利是基本上60~70%的毛利润率水平。利润率现在非常高。同时公司的年产量也是一直在增加的,年产量可能会高达200万盎司。大家可以算一下一盎司多少钱,然后乘以200万盎司,就能知道这家公司未来它的营收情况能做到多少。在未来如果美元涨不动了,加息周期停止了,黄金就开始大幅反弹,创出新高到2000美金以上。所以说我们现在给到大家的逻辑,短期金价可能不太会有大幅上涨,也就是维持,但如果1~2年就把加息周期完全走完,走完之后没有继续加息的动力和可能性空间了,黄金价格就会出现大幅的上涨,在那个时候黄金股价我认为翻倍的可能性都是很大的,因为只要黄金价格创出新高,黄金矿股的股价也会创出新高。按照之前的下跌幅度来讲如果股价创出新高,在目前的股价基本上就意味着翻倍了,是非常不错的,值得未来中长期投资的标的。免责声明:GO Markets分析师或外部发言人提供的信息基于其独立分析或个人经验。所表达的观点或交易风格仅代表其个人;并不代表GO Markets的观点或立场。联系方式:墨尔本 03 8658 0603悉尼 02 9188 0418中国地区(中文) 400 120 8537中国地区(英文) +248 4 671 903作者:Jacky Wang | GO Markets 中文部分析主管

The information provided is of general nature only and does not take into account your personal objectives, financial situations or needs. Before acting on any information provided, you should consider whether the information is suitable for you and your personal circumstances and if necessary, seek appropriate professional advice. All opinions, conclusions, forecasts or recommendations are reasonably held at the time of compilation but are subject to change without notice. Past performance is not an indication of future performance. Go Markets Pty Ltd, ABN 85 081 864 039, AFSL 254963 is a CFD issuer, and trading carries significant risks and is not suitable for everyone. You do not own or have any interest in the rights to the underlying assets. You should consider the appropriateness by reviewing our TMD, FSG, PDS and other CFD legal documents to ensure you understand the risks before you invest in CFDs. 免责声明:文章来自 GO Markets 分析师和参与者,基于他们的独立分析或个人经验。表达的观点、意见或交易风格仅代表作者个人,不代表 GO Markets 立场。建议,(如有),具有“普遍”性,并非基于您的个人目标、财务状况或需求。在根据建议采取行动之前,请考虑该建议(如有)对您的目标、财务状况和需求的适用程度。如果建议与购买特定金融产品有关,您应该在做出任何决定之前了解并考虑该产品的产品披露声明 (PDS) 和金融服务指南 (FSG)。
.jpg)
.jpg)
.jpg)


