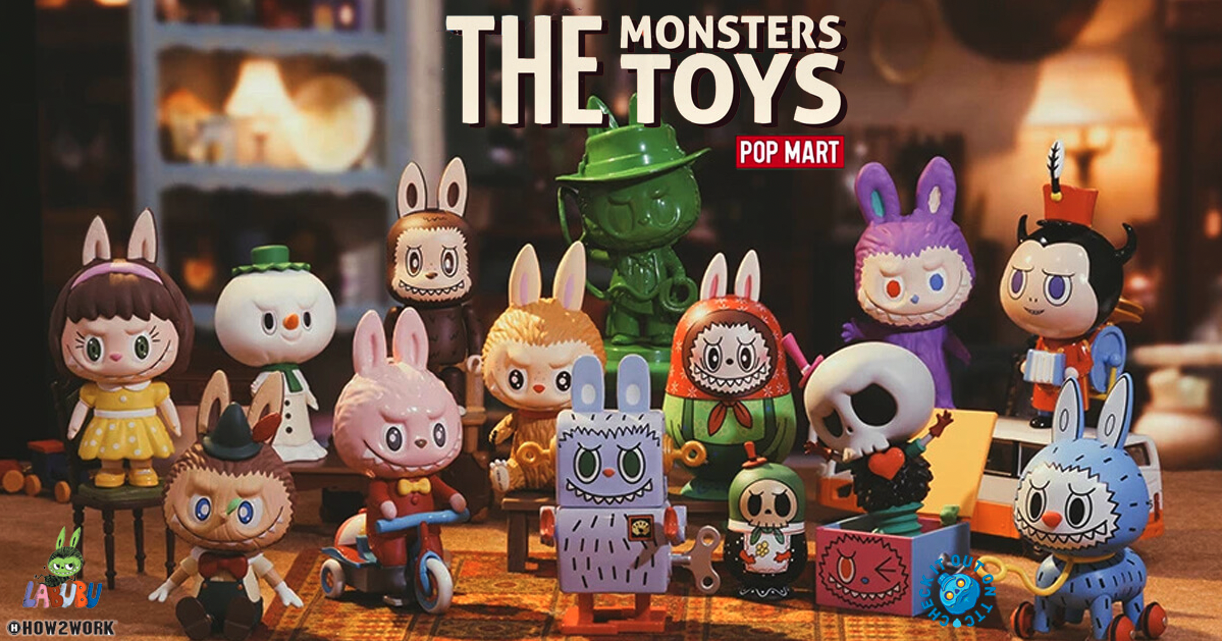
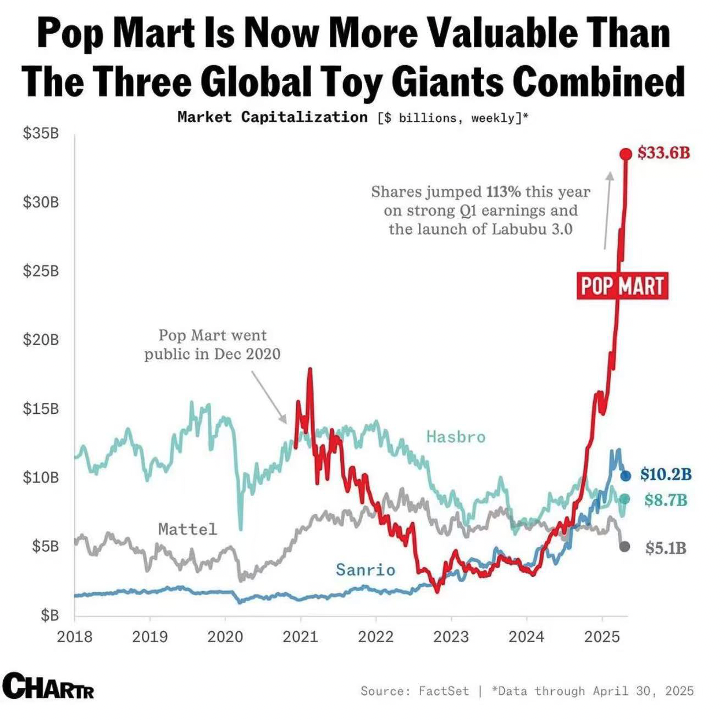
据摩根大通测算,Labubu系列有望在2027年突破140亿元人民币年销售额,年复合增速高达40%。若按IP估值模型折现,其单一IP潜在价值可达400亿人民币以上,已接近泡泡玛特总市值。这意味着:Labubu不只是一次成功的产品,更是“IP资产证券化”的核心样本。三、品牌溢价与盈利模型再升级泡泡玛特在毛利率结构上具有典型“轻资产、强品牌”特征:盲盒单价从2019年的59元涨至目前的89元,毛利率稳定在64%-67%之间;Labubu毛绒款单价接近239元,而成本则是压在50元以下;App私域会员体系(泡泡玛特MEGA会员)贡献超过25%的GMV,带来显著复购与拉新能力。四、国际化与AI潮玩:新增长引擎泡泡玛特正在从“产品出海”走向“IP文化出海”。Labubu已在泰国、马来西亚、英国等国形成稳定粉丝社群;2025年计划新增8个海外门店,并在巴黎、纽约、曼谷举办Labubu巡展。作为中国的潮玩品牌,泡泡玛特2024年海外总收入达到了50.7亿,占比38.9%,欧美市场的高速增长也成为市值增长的引擎。此外,公司已于2025年Q1设立AI潮玩实验室,计划开发基于“情绪识别”“行为反应”的可交互玩偶,并与腾讯START云游戏达成合作。中长期看,公司试图构建“IP × AI × 玩具”的智能互动生态。这不仅拉高了消费频次与单价,更提升了IP生命周期与品牌护城河。五、估值空间与潜在风险截至2025年5月,泡泡玛特总市值约为1100亿港元,对应PE(TTM)为38倍,远高于国内零售平均水平,但低于全球IP运营龙头迪士尼(2025年PE约45倍)。通过数据表明公司当前估值处于“IP兑现初期+海外扩张预期”的合理溢价区间,但存在三方面风险:IP生命周期短与依赖单一IP风险(Labubu销售占比过高);线下运营安全事件(如英国门店排队混乱已引发监管关注);AI潮玩研发仍处早期,投入回报周期长。总而言之,对于泡泡玛特来说,Labubu只是起点,不是终点。泡泡玛特不是在卖玩具,而是在“做文化生意”。Labubu的成功验证了中国潮玩品牌的全球变现能力,也重构了IP与资本之间的关系。从资本角度看,这场由Labubu点燃的热潮,是“内容+用户+运营”三位一体价值链的集中爆发。未来,能否持续创造出“下一个Labubu”,才是泡泡玛特真正的长期估值锚。联系方式:墨尔本 03 8658 0603悉尼 02 9188 0418中国地区(中文) 400 120 8537中国地区(英文) +248 4 671 903作者:Yoyo Ma | GO Markets 墨尔本中文部
By
Yoyo Ma
The information provided is of general nature only and does not take into account your personal objectives, financial situations or needs. Before acting on any information provided, you should consider whether the information is suitable for you and your personal circumstances and if necessary, seek appropriate professional advice. All opinions, conclusions, forecasts or recommendations are reasonably held at the time of compilation but are subject to change without notice. Past performance is not an indication of future performance. Go Markets Pty Ltd, ABN 85 081 864 039, AFSL 254963 is a CFD issuer, and trading carries significant risks and is not suitable for everyone. You do not own or have any interest in the rights to the underlying assets. You should consider the appropriateness by reviewing our TMD, FSG, PDS and other CFD legal documents to ensure you understand the risks before you invest in CFDs. These documents are available here.
免责声明:文章来自 GO Markets 分析师和参与者,基于他们的独立分析或个人经验。表达的观点、意见或交易风格仅代表作者个人,不代表 GO Markets 立场。建议,(如有),具有“普遍”性,并非基于您的个人目标、财务状况或需求。在根据建议采取行动之前,请考虑该建议(如有)对您的目标、财务状况和需求的适用程度。如果建议与购买特定金融产品有关,您应该在做出任何决定之前了解并考虑该产品的产品披露声明 (PDS) 和金融服务指南 (FSG)。
Bitcoin rebounded 7% to touch $94,000 this week as two of the world's largest asset managers doubled down on their conviction that this cycle could break from crypto's boom-bust past.
BlackRock CEO Larry Fink and COO Rob Goldstein declared tokenisation "the next major evolution in market infrastructure,” comparing its potential to the introduction of electronic messaging systems in the 1970s.
Tokenised real-world assets have exploded from $7 billion to $24 billion in just one year, with certain projections expecting tokenised instruments to comprise 10-24% of portfolios by 2030.
Total RWA Value
Grayscale's latest research also put forward the case that this cycle will not follow Bitcoin’s predictable four-year pattern. Their analysis shows this cycle has had no parabolic price surge like previous cycles, and capital is flowing through regulated ETPs and corporate treasuries rather than retail speculation.
Grayscale has boldly predicted Bitcoin will reach new all-time highs next year based on this data, with near-term catalysts including a likely Federal Reserve rate cut and advancing crypto legislation.
AI Boom Creating a Memory Chip Supply Crisis
The AI revolution has had an unexpected ripple effect on conventional memory chips (DRAM).
Post-ChatGPT launch in 2022, chipmakers pivoted aggressively toward high-bandwidth memory (HBM) chips — the components that power AI data centres.
Samsung and SK Hynix, who control roughly 70% of the global DRAM market, transitioned large portions of their production away from conventional chips.
This worked in the short term, but data centre operators are now replacing old servers, and PC and smartphone sales have exceeded expectations (all of which require DRAM).
This saw DRAM supplier inventories fall to just two to four weeks in October, down from 13 to 17 weeks in late 2024.
DRAM spot prices nearly tripled in September this year, while in Tokyo's electronics district, popular gaming memory modules have surged from 17,000 yen to over 47,000 yen in recent weeks.
Google, Amazon, Microsoft, and Meta have all approached Micron with open-ended orders, agreeing to purchase whatever the company can deliver, regardless of price.
Samsung, Micron, and SK Hynix shares have rallied 96%, 168%, and 213% YTD, respectively, thanks to the increased DRAM demand.
Ironically, this recent price surge has seen DRAM chip margins approach those of the advanced HBM chips, meaning non-AI memory could now become equally profitable to produce.
Every trader has had that moment where a seemingly perfect trade goes astray.
You see a clean chart on the screen, showing a textbook candle pattern; it seems as though the market planets have aligned, and so you enthusiastically jump into your trade.
But before you even have time to indulge in a little self-praise at a job well done, the market does the opposite of what you expected, and your stop loss is triggered.
This common scenario, which we have all unfortunately experienced, raises the question: What separates these “almost” trades from the truly higher-probability setups?
The State of Alignment
A high-probability setup isn’t necessarily a single signal or chart pattern. It is the coming together of several factors in a way that can potentially increase the likelihood of a successful trade.
When combined, six interconnected layers can come together to form the full “anatomy” of a higher-probability trading setup:
Context
Structure
Confluence
Timing
Management
Psychology
When more of these factors are in place, the greater the (potential) probability your trade will behave as expected.
Market Context
When we explore market context, we are looking at the underlying background conditions that may help some trading ideas thrive, and contribute to others failing.
Regime Awareness
Every trading strategy you choose to create has a natural set of market circumstances that could be an optimum trading environment for that particular trading approach.
For example:
Trending regimes may favour momentum or breakout setups.
Ranging regimes may suit mean-reversion or bounce systems.
High-volatility regimes create opportunity but demand wider stops and quicker management.
Investing time considering the underlying market regime may help avoid the temptation to force a trending system into a sideways market.
Simply looking at the slope of a 50-period moving average or the width of a Bollinger Band can suggest what type of market is currently in play.
Sentiment Alignment
If risk sentiment shifts towards a specific (or a group) of related assets, the technical picture is more likely to change to match that.
For example, if the USD index is broadly strengthening as an underlying move, then looking for long trades in EURUSD setups may end up fighting headwinds.
Setting yourself some simple rules can help, as trading against a potential tidal wave of opposite price change in a related asset is not usually a strong foundation on which to base a trading decision.
Key Reference Zones
Context also means the location of the current price relative to levels or previous landmarks.
Some examples include:
Weekly highs/lows
Prior session ranges, e.g. the Asian high and low as we move into the European session
Major “round” psychological numbers (e.g., 1.10, 1000)
A long trading setup into these areas of market importance may result in an overhead resistance, or a short trade into a potential area of support may reduce the probability of a continuation of that price move before the trade even starts.
Market Structure
Structure is the visual rhythm of price that you may see on the chart. It involves the sequences of trader impulses and corrections that end up defining the overall direction and the likelihood of continuation:
Uptrend: Higher highs (HH) and higher lows (HL)
Downtrend: Lower highs (LH) and lower lows (LL)
Transition: Break in structure often followed by a retest of previous levels.
A pullback in an uptrend followed by renewed buying pressure over a previous price swing high point may well constitute a higher-probability buy than a random candle pattern in the middle of nowhere.
Compression and Expansion
Markets move through cycles of energy build-up and release. It is a reflection of the repositioning of asset holdings, subtle institutional accumulation, or a response to new information, and may all result in different, albeit temporary, broad price scenarios.
Compression: Evidenced by a tightening range, declining ATR, smaller candles, and so suggesting a period of indecision or exhaustion of a previous price move,
Expansion: Evidenced by a sudden breakout, larger candle bodies, and a volume spike, is suggestive of a move that is now underway.
A breakout that clears a liquidity zone often runs further, as ‘trapped’ traders may further fuel the move as they scramble to reposition.
A setup aligned with such liquidity flows may carry a higher probability than one trading directly into it.
Confluence
Confluence is the art of layering independent evidence to create a whole story. Think of it as a type of “market forensics” — each piece of confirmation evidence may offer a “better hand’ or further positive alignment for your idea.
There are three noteworthy types of confluence:
Technical Confluence – Multiple technical tools agree with your trading idea:
Moving average alignment (e.g., 20 EMA above 50 EMA) for a long trade
A Fibonacci retracement level is lining up with a previously identified support level.
Momentum is increasing on indicators such as the MACD.
Multi-Timeframe Confluence – Where a lower timeframe setup is consistent with a higher timeframe trend. If you have alignment of breakout evidence across multiple timeframes, any move will often be strengthened by different traders trading on different timeframes, all jumping into new trades together.
3. Volume Confluence – Any directional move, if supported by increasing volume, suggests higher levels of market participation. Whereas falling volume may be indicative of a lesser market enthusiasm for a particular price move.
Confluence is not about clutter on your chart. Adding indicators, e.g., three oscillators showing the same thing, may make your chart look like a work of art, but it offers little to your trading decision-making and may dilute action clarity.
Think of it this way: Confluence comes from having different dimensions of evidence and seeing them align. Price, time, momentum, and participation (which is evidenced by volume) can all contribute.
Timing & Execution
An alignment in context and structure can still fail to produce a desired outcome if your timing is not as it should be. Execution is where higher probability traders may separate themselves from hopeful ones.
Entry Timing
Confirmation: Wait for the candle to close beyond the structure or level. Avoid the temptation to try to jump in early on a premature breakout wick before the candle is mature.
Retests: If the price has retested and respected a breakout level, it may filter out some false breaks that we will often see.
Then act: Be patient for the setup to complete. Talking yourself out of a trade for the sake of just one more candle” confirmation may, over time, erode potential as you are repeatedly late into trades.
Session & Liquidity Windows
Markets breathe differently throughout the day as one session rolls into another. Each session's characteristics may suit different strategies.
For example:
London Open: Often has a volatility surge; Range breaks may work well.
New York Overlap: Often, we will see some continuation or reversal of morning trends.
Asian Session: A quieter session where mean-reversion or range trading approaches may do well
Trade Management
Managing the position well after entry can turn probability into realised profit, or if mismanaged, can result in losses compounding or giving back unrealised profit to the market.
Pre-defined Invalidation
Asking yourself before entry: “What would the market have to do to prove me wrong?” could be an approach worth trying.
This facilitates stops to be placed logically rather than emotionally. If a trade idea moves against your original thinking, based on a change to a state of unalignment, then considering exit would seem logical.
Scaling & Partial Exits
High-probability trade entries will still benefit from dynamic exit approaches that may involve partial position closes and adaptive trailing of your initial stop.
Trader Psychology
One of the most important and overlooked components of a higher-probability setup is you.
It is you who makes the choices to adopt these practices, and you who must battle the common trading “demons” of fear, impatience, and distorted expectation.
Let's be real, higher-probability trades are less common than many may lead you to believe.
Many traders destroy their potential to develop any trading edge by taking frequent low-probability setups out of a desire to be “in the market.”
It can take strength to be inactive for periods of time and exercise that patience for every box to be ticked in your plan before acting.
Measure “You” performance
Each trade you take becomes data and can provide invaluable feedback. You can only make a judgment of a planned strategy if you have followed it to the letter.
Discipline in execution can be your greatest ally or enemy in determining whether you ultimately achieve positive trading outcomes.
Bringing It All Together – The Setup Blueprint
Final Thoughts
Higher-probability setups are not found but are constructed methodically.
A trader who understands the “higher-probability anatomy” is less likely to chase trades or feel the need to always be in the market. They will see merit in ticking all the right boxes and then taking decisive action when it is time to do so.
It is now up to you to review what you have in place now, identify gaps that may exist, and commit to taking action!