特朗普8月份表示,JM货币可以“定义未来”,并补充称,他希望JM货币“在美国开采、铸造和制造”。这位当选总统还提议建立类似于美国战略石油储备的国家比特币战略储备,直接购买和投资JM货币作为国家安全措施。并且公开接受任何形式的JM货币捐赠。来自该领域的支持者们为特朗普大选也贡献了可观的真金白银。今年9 月,特朗普和他的子女创办了一家名为 World Liberty Financial 的新JM货币公司,意味着未来的总统亲自加入区块链经济系统中,和他的支持者们,尤其是马斯克,共同支持JM货币市场发展,同时也是受益人。特朗普也说了一句非常激进也有激情的话:“规则将由热爱你的行业的人而不是讨厌你的行业的人制定。”在特朗普赢的大选后,当天美国BTC ETF进入13亿美元新增资金。全球JM货币市场总值达到3万亿美元。
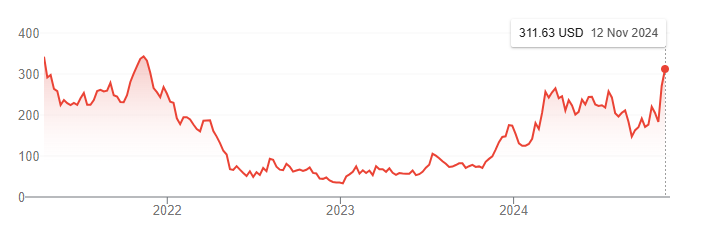
回到过去,看2021年6月,美国证券交易委员会主席加里·根斯勒(Gary Gensler) 在他上任后的首次演讲中表示,JM货币“充斥着欺诈、骗局和滥用”。美国监管机构和美联储共同认为,应该加强JM货币的监管。而目前,美联储理事沃勒表示,稳定币可能为金融系统带来好处。稳定币基本上是一种合成美元。在特朗普胜选后,开始表态支持和认可JM货币在经济系统中的作用。所以,目前美国从政府到监管机构,未来对JM货币的态度,都是开放和支持的。我们不做JM货币本身的价格预测,毕竟美国认可,不代表全世界任何国家都认可。但是,我们从牛市的舆论中,很容易看出来,未来还有更进一步的上涨空间。我之前多次提到,BTC就是JM货币领域的爱马仕。如果我们普通投资者,由于各类问题无法直接参与JM货币市场,或者不了解加密货币世界背后的技术和逻辑,我们可以曲线救国,通过购买与之相关股票进行投资,毕竟,股票各国政府都认可,区块链技术也都认可,股价同样会跟随整个JM世界版块的估值上涨。最推荐的,就是Coinbase。我记得我在2023年左右,公开的墨尔本大型金融讲座活动上,以及多次公开的视频网络研讨会中,都给出推荐,当时价格应该是50-110美金之间波动,而目前价格已经上涨到300美金附近。这家公司是在美国上市的JM货币交易所,只要有交易产生,就有钱赚。该平台持有约9,182枚BTC。所以,BTC价格上涨1万美金,该平台就赚1亿美金。在2024年第三季度,Coinbase报告净收入为7,550万美元,每股收益0.28美元,低于市场预期的0.45美元。收入为12.05亿美元,未达到预期的12.61亿美元。除此之外,GO Markets也给到大家一些区块链技术相关的股票参考:美股上市公司:MicroStrategy Inc. (MSTR):这家商业智能公司是全球持有BTC最多的上市公司之一,持有超过158,000枚BTC。该公司股价进入2024年,也是接近10倍涨幅。
The information provided is of general nature only and does not take into account your personal objectives, financial situations or needs. Before acting on any information provided, you should consider whether the information is suitable for you and your personal circumstances and if necessary, seek appropriate professional advice. All opinions, conclusions, forecasts or recommendations are reasonably held at the time of compilation but are subject to change without notice. Past performance is not an indication of future performance. Go Markets Pty Ltd, ABN 85 081 864 039, AFSL 254963 is a CFD issuer, and trading carries significant risks and is not suitable for everyone. You do not own or have any interest in the rights to the underlying assets. You should consider the appropriateness by reviewing our TMD, FSG, PDS and other CFD legal documents to ensure you understand the risks before you invest in CFDs. These documents are available here.
免责声明:文章来自 GO Markets 分析师和参与者,基于他们的独立分析或个人经验。表达的观点、意见或交易风格仅代表作者个人,不代表 GO Markets 立场。建议,(如有),具有“普遍”性,并非基于您的个人目标、财务状况或需求。在根据建议采取行动之前,请考虑该建议(如有)对您的目标、财务状况和需求的适用程度。如果建议与购买特定金融产品有关,您应该在做出任何决定之前了解并考虑该产品的产品披露声明 (PDS) 和金融服务指南 (FSG)。
Bitcoin rebounded 7% to touch $94,000 this week as two of the world's largest asset managers doubled down on their conviction that this cycle could break from crypto's boom-bust past.
BlackRock CEO Larry Fink and COO Rob Goldstein declared tokenisation "the next major evolution in market infrastructure,” comparing its potential to the introduction of electronic messaging systems in the 1970s.
Tokenised real-world assets have exploded from $7 billion to $24 billion in just one year, with certain projections expecting tokenised instruments to comprise 10-24% of portfolios by 2030.
Total RWA Value
Grayscale's latest research also put forward the case that this cycle will not follow Bitcoin’s predictable four-year pattern. Their analysis shows this cycle has had no parabolic price surge like previous cycles, and capital is flowing through regulated ETPs and corporate treasuries rather than retail speculation.
Grayscale has boldly predicted Bitcoin will reach new all-time highs next year based on this data, with near-term catalysts including a likely Federal Reserve rate cut and advancing crypto legislation.
AI Boom Creating a Memory Chip Supply Crisis
The AI revolution has had an unexpected ripple effect on conventional memory chips (DRAM).
Post-ChatGPT launch in 2022, chipmakers pivoted aggressively toward high-bandwidth memory (HBM) chips — the components that power AI data centres.
Samsung and SK Hynix, who control roughly 70% of the global DRAM market, transitioned large portions of their production away from conventional chips.
This worked in the short term, but data centre operators are now replacing old servers, and PC and smartphone sales have exceeded expectations (all of which require DRAM).
This saw DRAM supplier inventories fall to just two to four weeks in October, down from 13 to 17 weeks in late 2024.
DRAM spot prices nearly tripled in September this year, while in Tokyo's electronics district, popular gaming memory modules have surged from 17,000 yen to over 47,000 yen in recent weeks.
Google, Amazon, Microsoft, and Meta have all approached Micron with open-ended orders, agreeing to purchase whatever the company can deliver, regardless of price.
Samsung, Micron, and SK Hynix shares have rallied 96%, 168%, and 213% YTD, respectively, thanks to the increased DRAM demand.
Ironically, this recent price surge has seen DRAM chip margins approach those of the advanced HBM chips, meaning non-AI memory could now become equally profitable to produce.
Every trader has had that moment where a seemingly perfect trade goes astray.
You see a clean chart on the screen, showing a textbook candle pattern; it seems as though the market planets have aligned, and so you enthusiastically jump into your trade.
But before you even have time to indulge in a little self-praise at a job well done, the market does the opposite of what you expected, and your stop loss is triggered.
This common scenario, which we have all unfortunately experienced, raises the question: What separates these “almost” trades from the truly higher-probability setups?
The State of Alignment
A high-probability setup isn’t necessarily a single signal or chart pattern. It is the coming together of several factors in a way that can potentially increase the likelihood of a successful trade.
When combined, six interconnected layers can come together to form the full “anatomy” of a higher-probability trading setup:
Context
Structure
Confluence
Timing
Management
Psychology
When more of these factors are in place, the greater the (potential) probability your trade will behave as expected.
Market Context
When we explore market context, we are looking at the underlying background conditions that may help some trading ideas thrive, and contribute to others failing.
Regime Awareness
Every trading strategy you choose to create has a natural set of market circumstances that could be an optimum trading environment for that particular trading approach.
For example:
Trending regimes may favour momentum or breakout setups.
Ranging regimes may suit mean-reversion or bounce systems.
High-volatility regimes create opportunity but demand wider stops and quicker management.
Investing time considering the underlying market regime may help avoid the temptation to force a trending system into a sideways market.
Simply looking at the slope of a 50-period moving average or the width of a Bollinger Band can suggest what type of market is currently in play.
Sentiment Alignment
If risk sentiment shifts towards a specific (or a group) of related assets, the technical picture is more likely to change to match that.
For example, if the USD index is broadly strengthening as an underlying move, then looking for long trades in EURUSD setups may end up fighting headwinds.
Setting yourself some simple rules can help, as trading against a potential tidal wave of opposite price change in a related asset is not usually a strong foundation on which to base a trading decision.
Key Reference Zones
Context also means the location of the current price relative to levels or previous landmarks.
Some examples include:
Weekly highs/lows
Prior session ranges, e.g. the Asian high and low as we move into the European session
Major “round” psychological numbers (e.g., 1.10, 1000)
A long trading setup into these areas of market importance may result in an overhead resistance, or a short trade into a potential area of support may reduce the probability of a continuation of that price move before the trade even starts.
Market Structure
Structure is the visual rhythm of price that you may see on the chart. It involves the sequences of trader impulses and corrections that end up defining the overall direction and the likelihood of continuation:
Uptrend: Higher highs (HH) and higher lows (HL)
Downtrend: Lower highs (LH) and lower lows (LL)
Transition: Break in structure often followed by a retest of previous levels.
A pullback in an uptrend followed by renewed buying pressure over a previous price swing high point may well constitute a higher-probability buy than a random candle pattern in the middle of nowhere.
Compression and Expansion
Markets move through cycles of energy build-up and release. It is a reflection of the repositioning of asset holdings, subtle institutional accumulation, or a response to new information, and may all result in different, albeit temporary, broad price scenarios.
Compression: Evidenced by a tightening range, declining ATR, smaller candles, and so suggesting a period of indecision or exhaustion of a previous price move,
Expansion: Evidenced by a sudden breakout, larger candle bodies, and a volume spike, is suggestive of a move that is now underway.
A breakout that clears a liquidity zone often runs further, as ‘trapped’ traders may further fuel the move as they scramble to reposition.
A setup aligned with such liquidity flows may carry a higher probability than one trading directly into it.
Confluence
Confluence is the art of layering independent evidence to create a whole story. Think of it as a type of “market forensics” — each piece of confirmation evidence may offer a “better hand’ or further positive alignment for your idea.
There are three noteworthy types of confluence:
Technical Confluence – Multiple technical tools agree with your trading idea:
Moving average alignment (e.g., 20 EMA above 50 EMA) for a long trade
A Fibonacci retracement level is lining up with a previously identified support level.
Momentum is increasing on indicators such as the MACD.
Multi-Timeframe Confluence – Where a lower timeframe setup is consistent with a higher timeframe trend. If you have alignment of breakout evidence across multiple timeframes, any move will often be strengthened by different traders trading on different timeframes, all jumping into new trades together.
3. Volume Confluence – Any directional move, if supported by increasing volume, suggests higher levels of market participation. Whereas falling volume may be indicative of a lesser market enthusiasm for a particular price move.
Confluence is not about clutter on your chart. Adding indicators, e.g., three oscillators showing the same thing, may make your chart look like a work of art, but it offers little to your trading decision-making and may dilute action clarity.
Think of it this way: Confluence comes from having different dimensions of evidence and seeing them align. Price, time, momentum, and participation (which is evidenced by volume) can all contribute.
Timing & Execution
An alignment in context and structure can still fail to produce a desired outcome if your timing is not as it should be. Execution is where higher probability traders may separate themselves from hopeful ones.
Entry Timing
Confirmation: Wait for the candle to close beyond the structure or level. Avoid the temptation to try to jump in early on a premature breakout wick before the candle is mature.
Retests: If the price has retested and respected a breakout level, it may filter out some false breaks that we will often see.
Then act: Be patient for the setup to complete. Talking yourself out of a trade for the sake of just one more candle” confirmation may, over time, erode potential as you are repeatedly late into trades.
Session & Liquidity Windows
Markets breathe differently throughout the day as one session rolls into another. Each session's characteristics may suit different strategies.
For example:
London Open: Often has a volatility surge; Range breaks may work well.
New York Overlap: Often, we will see some continuation or reversal of morning trends.
Asian Session: A quieter session where mean-reversion or range trading approaches may do well
Trade Management
Managing the position well after entry can turn probability into realised profit, or if mismanaged, can result in losses compounding or giving back unrealised profit to the market.
Pre-defined Invalidation
Asking yourself before entry: “What would the market have to do to prove me wrong?” could be an approach worth trying.
This facilitates stops to be placed logically rather than emotionally. If a trade idea moves against your original thinking, based on a change to a state of unalignment, then considering exit would seem logical.
Scaling & Partial Exits
High-probability trade entries will still benefit from dynamic exit approaches that may involve partial position closes and adaptive trailing of your initial stop.
Trader Psychology
One of the most important and overlooked components of a higher-probability setup is you.
It is you who makes the choices to adopt these practices, and you who must battle the common trading “demons” of fear, impatience, and distorted expectation.
Let's be real, higher-probability trades are less common than many may lead you to believe.
Many traders destroy their potential to develop any trading edge by taking frequent low-probability setups out of a desire to be “in the market.”
It can take strength to be inactive for periods of time and exercise that patience for every box to be ticked in your plan before acting.
Measure “You” performance
Each trade you take becomes data and can provide invaluable feedback. You can only make a judgment of a planned strategy if you have followed it to the letter.
Discipline in execution can be your greatest ally or enemy in determining whether you ultimately achieve positive trading outcomes.
Bringing It All Together – The Setup Blueprint
Final Thoughts
Higher-probability setups are not found but are constructed methodically.
A trader who understands the “higher-probability anatomy” is less likely to chase trades or feel the need to always be in the market. They will see merit in ticking all the right boxes and then taking decisive action when it is time to do so.
It is now up to you to review what you have in place now, identify gaps that may exist, and commit to taking action!