
市场资讯及洞察

从4月之前外汇市场的实际情况开始:地缘政治冲击,中东的石油供应受到压力。整个货币市场的直接反应是交易者以前所见过的:资金流向安全,向收益率转移,并远离任何看似可能受到干扰的东西。
避险资金流遇收益率差异
美元同时受益于这两种力量。它是一个避风港,它还具有目前大多数同行无法比拟的收益优势。瑞士法郎吸收了欧洲避险情绪带来的部分溢出。过去几乎自动吸引避险资金的日元却陷入了完全不同的境地,现在兑美元的收益率差距如此之大,以至于避险逻辑被套利逻辑所取代。
本月最艰难的货币是处于中间位置的货币:风险敏感型、与大宗商品挂钩的货币或根本无法竞争的运行政策利率。新西兰元是最明显的例子,而澳元则是一个更混乱的故事。其背后是对2026年降息预期的重新定价,多个国家的中央银行现在正在重新评估这些预期。
最强推动者:美元(美元)
随着美联储降息和世界其他地区追赶,美元在2025年的大部分时间里逐渐下跌。这个故事在三月下旬停滞不前。伊朗冲突改变了计算方式,美元重新站稳了脚跟,这在某种程度上反映了其在全球市场中的结构性地位。
美国出口石油,当能源价格上涨时,这是贸易条件的改善,而不是贸易条件的冲击。美元的大多数主要货币都处于这个方程式的另一边。再加上3.50%至3.75%的政策利率区间,该区间现在看起来锁定了更长时间,美元的优势既是周期性的,也是结构性的。美元指数(DXY)已重回100水平,但进入4月份的问题是它是保持在这一水平还是进一步推动。
最弱的走势:新西兰元(NZD)
如果你想设计一种在当前环境下会陷入困境的货币,那么新西兰元几乎完全符合这个要求。它对风险敏感。它与大宗商品挂钩。它的政策利率为2.25%,低于美联储,现在也低于澳洲联储。新西兰也是能源进口国,因此油价上涨同时打击了贸易平衡和国内通货膨胀前景。
这些都不是什么新鲜事物,但在美元飙升和普遍避险情绪的背景下,所有这些因素同时冲击,以一种不容忽视的方式压制了纽元。曾经使新西兰元具有吸引力的套利交易已经逆转,因为资本一直在流出,而不是流入。
美元/日元
美元/日元是最清楚地说明当货币的避险地位被套利逻辑所覆盖时会发生什么情况的货币对。日元曾经是交易者在地缘政治压力下寻求保护的第一个停靠港。这种动态已经被抑制,原因很简单:你现在为了持有日元而放弃了太多的收益率。
日本银行(BOJ)的政策利率为0.75%,而美联储的政策利率为3.50%至3.75%,这一差距不鼓励避险资金流动。它鼓励以日元借款并在其他地方部署。因此,尽管美元因地缘政治风险而上涨,但日元也因同样的事件而下跌。这不是它应该如何运作,但当收益率差异如此之大时,数学就是这样计算的。
美元/日元位于159附近,这与日本财政部一直将160列为需要关注的水平相差不远。4月27日和28日的日本央行会议现在是真正的现场直播。
接下来要关注的数据
未来几周,有四个事件是最明显的潜在外汇催化剂。两者都有通向利率预期的直接传导渠道,利率预期是目前外汇市场的大部分变动的推动力。
关键关卡和信号
这些是交易者和决策者最密切关注的参考点。每一个都可能是定位转变或官方应对措施的潜在触发因素。
进入更广阔的外汇世界,并在条件变化时保持灵活性。
开设一个账户 · 登录


这是四月开始时的情况。一场战争正在影响世界上最重要的石油阻塞点之一。布伦特原油交易价格高于100美元。而美联储(Fed)在2025年的大部分时间里都在设计软着陆,现在面临的通货膨胀威胁与其说是由工资、服务业或国内经济驱动的,不如说是由能源驱动的。它正在关注石油冲击。
联邦基金利率为3.50%至3.75%。下一次联邦公开市场委员会(FOMC)会议将于4月28日和29日举行,市场面临的关键问题不是美联储是否会削减,而是美联储能否削减,或者能源冲击是否可能在2026年的大部分时间里关闭了这扇大门。
大量重要数据将于4月发布。3月份的消费者物价指数(CPI)、非农就业人数(NFP)和第一季度国内生产总值(GDP)的预估是最重要的三个。但联邦公开市场委员会4月29日的声明可能为今年余下的时间定下了基调。
增长:业务活动和需求
想想今年的美国经济是什么样子:人工智能驱动的资本支出(capex)是增长叙事的重要组成部分,企业投资意向看上去很坚定,《一、大、美法案》已经在其中了。从表面上看,增长故事看起来很扎实。
然后,霍尔木兹海峡的局势改变了计算方式。不是因为美国是净能源进口国,事实并非如此,而且结构隔热很重要。但是,对美国能源生产商有利的东西仍然可以挤压其他地方的利润率并压制全球需求。4月30日的第一季度国内生产总值(GDP)预估现在可以从两个角度来解读:冲击前经济有多强劲,以及它可能对未来几个季度发出什么信号。
劳工:工资和就业
根据你的阅读方式,二月份的就业报告要么是短暂的,要么是一个警告信号。非农就业人数(NFP)下降了92,000人,失业率小幅上升至4.4%,官方说天气起了作用。这可能是真的,但这也是发生的事情。作为维持高利率的主要论点,劳动力市场突然显得不那么令人信服了。
4月3日的3月就业报告现在确实具有重要意义。回归正的薪资增长可能会稳定紧张情绪,而连续第二次的软打印,尤其是在能源价格上涨的背景下,将开始给美联储带来非常不舒服的说法。它将同时考虑就业增长放缓和通货膨胀威胁。那不是一个舒适的地方。
通货膨胀:消费者价格指数、PPI和个人消费支出
关于通货膨胀目前的走向,这是一个令人不安的真相。在任何石油冲击结束之前,美联储首选的核心个人消费支出(PCE)在1月份已经同比增长了3.1%。美联储并未完全解决其通货膨胀问题,相反,它已经放慢了通货膨胀的速度。那是另一回事。
现在,除了尚未完全解决的通货膨胀问题外,油价还大幅上涨。能源价格可以通过汽油、运输和物流成本相对较快地纳入消费者物价指数(CPI),这些成本最终会出现在几乎所有物品的价格中。4月10日的3月CPI数据可能是本月最重要的单一数据发布,它可能会告诉我们能源冲击是否已经出现在美联储关注的数字中。
政策、贸易和收益
4月也是美国财报季的开始,本季度的业绩具有异常的分量。在回报即将到来的基础上,投资者一直在向人工智能基础设施注入资金。问题是何时。随着地缘政治波动推动人们从以增长为导向的技术转向能源和国防,摩根大通4月14日的财报将既考虑管理层对宏观环境的看法,也要考虑数字本身。
然后是4月28日和29日的联邦公开市场委员会会议。在4月初公布包括NFP、CPI和生产者物价指数(PPI)在内的数据之后,美联储将有足够的信息来更新其措辞。无论是表明降息可能持续到2026年,还是稍微半开着大门,都可能是本季度最重要的沟通。
地缘政治波动已经促使投资者重新评估以增长为主的定位。估计耗资6,500亿美元的人工智能基础设施建设在投资回报率方面也受到更严格的审查。如果财报季在这方面令人失望,如果联邦公开市场委员会表示将长期搁置,那么这种组合可能会考验进入5月的风险偏好。
美国即将发布重大数据?保持专注。
开设一个账户 · 登录

4月初,亚太市场将重点关注霍尔木兹海峡的长期混乱如何影响通货膨胀、贸易流量和政策预期。中国的第十五个五年计划将注意力转移到人工智能和技术自力更生上,这对供应链和区域增长产生了连锁反应。日本和澳大利亚都面临着管理进口能源通胀的挑战,同时衡量在不影响国内需求的情况下可以在多大程度上实现政策正常化。
对于交易者而言,能源价格上涨和政策分歧相结合,可能会使区域指数和货币的波动性升高。
中国
北京的立法者已经批准了第十五个五年计划(2026-2030年),将人工智能(AI)和技术自力更生置于国家议程的中心。政府已将2026年增长目标定为4.5%至5.0%,为数十年来的最低水平,因为它将增长质量置于速度之上。
日本
由于能源驱动的通货膨胀有可能卷土重来,日本银行(BOJ)面临越来越大的政策正常化压力。尽管不包括新鲜食品在内的消费者价格在2月份放缓至1.6%,但最近的油价飙升可能会在未来几个月内将消费者价格指数(CPI)推回2%的目标。
澳大利亚
澳大利亚经济仍处于两速分化状态,老年家庭增加了支出,而年轻人则面临着巨大的负担能力压力。继澳大利亚储备银行(RBA)在3月份将利率提高至4.10%之后,市场高度关注即将发布的通胀数据,以评估是否需要进一步的紧缩政策。
.jpg)
美国最近向伊朗递出了一份结束战争的方案。内容看起来很完整:限制伊朗核能力、拆除部分关键核设施、交出高浓缩铀、接受更严格核查、限制导弹项目、停止支持地区武装,同时确保霍尔木兹海峡恢复开放。作为交换,美国可以考虑放松制裁,甚至支持伊朗发展民用核项目。
这套方案表面上是“停战条件”,而本质上更像是特朗普想要的一份胜利清单。他要的不是单纯停火,而是打一场仗之后,拿着一份漂亮的结果收兵。最好是美国显得强硬,伊朗显得让步,油价还能回落,市场也能松一口气。这样一来,特朗普既能说自己赢了,又能避免战争长期消耗。
但问题是,这个想法对美国来说合理,对伊朗来说却不能接受。
这份方案里的内容已经不只是“各退一步”,而是要求伊朗在核项目、导弹能力、地区影响力这些最核心的问题上大幅后退。说得直接一点,这更像是要求伊朗带伤停战,还得自己签下认输文件。伊朗虽承受很大压力,但压力大,并不代表像美国低头。
伊朗这几天释放出来的信号很明确:可以谈,但我不会跪着谈。 伊朗方面提出的条件,包括要求正式结束战争、获得未来不再遭袭的保证、得到赔偿,而且不接受美国对弹道导弹项目指手画脚。
这背后其实就一句话:特朗普想快点把战争结束,而伊朗想把美国拖进一个无法收场的局面。
特朗普不是突然想和平,而是这场仗开始变得不划算了
特朗普为什么急着谈“结束战争”? 不是因为他突然变得温和了,而是因为这场仗已经开始变得不划算。
美国当然还能继续打,也还在增兵施压。但增兵和全面入侵是两回事,摆出强硬姿态和真的愿意打一场长期战争,也是两回事。现在的美国,更像是在用继续施压给谈判加码,而不是准备真的一路打到底。
原因很简单:美国并不想陷进一场长期消耗战。 一旦冲突继续拖下去,最先出问题的未必是军事,而是油价、通胀、市场和民意。特朗普最在意的,本来就是经济表现和政治观感,而不是为了伊朗打一场没完没了的战争。
更可能出现的,是以下几种走向
特朗普把战争变成一台 “市场机器”
特朗普未必只是想结束战争,他也可能想把战争变成一个可以随时拿来调控市场预期的政治工具。什么时候油价太高,就释放“谈判接近达成”的消息;什么时候伊朗不配合,就再放出增兵、打击能源设施或扩大制裁的威胁。战争本身不一定被迅速结束,但“战争预期”会被不断交易。也就是说,美国现在手里不只是导弹和航母,还有一个极其好用的东西:战争预期管理权。 这比“冲突继续拖着”更有利,因为不是被动拖延,而是主动利用模糊局势反复给市场定价。
不是停战,而是“半停火、半勒索”的新常态
双方未必会签出一份真正的和平协议,更可能进入一种模糊状态:伊朗不再大规模升级,美国也不追求立刻彻底摧毁;霍尔木兹不完全恢复,油价也回不到真正安心的位置。战争没有结束,只是从热战转成长期施压。美国可以宣称自己压住了局势,伊朗也不用公开接受屈辱条件。
美伊通过中间方达成有限交易
还有一种可能,是双方通过中间方私下达成某种有限安排。美国不再继续扩大打击,伊朗逐步放松海峡压力,局势慢慢降温,油价回落,但双方都不会公开承认自己作出了多少让步。对特朗普来说,这是最现实也最体面的结果;对伊朗来说,也比公开签下一份近乎认输的协议更容易交代。
说到底,这场博弈的核心很清楚:美国想尽快结束战争,而且要赢着结束;伊朗则不愿按照美国写好的结局退场。也正因如此,这场冲突更可能出现的,不是干脆利落的收尾,而是谈判、施压、试探与市场波动长期交织。对市场参与者来说,面对这样的局面,关键在于如何在反复拉扯中规避风险、利用风险。当战争迟迟无法真正收尾,波动本身就会成为新的交易环境。

随着伊朗冲突的重塑 能源市场,中央银行转为鹰派,尽管混乱不堪,黄金仍处于自由落体状态,2026年的避险手册比以往任何时候都更加复杂。
事实速览
- 尽管中东战争活跃,但黄金已从历史最高水平下跌了20%以上
- 新加坡元兑美元汇率接近自2014年10月以来的最高水平
- 这个 澳大利亚储备银行(RBA) 由于伊朗推动的油价推动澳大利亚通货膨胀率上升,2026年3月将利率上调至4.10%
1。黄金(XAU/USD)
黄金仍然是全球交易最广泛的避风港。它受益于地缘政治压力、美元疲软和负实际利率环境。但是,它在2026年的短期行为需要解释。
尽管中东战争活跃,但黄金仍大幅抛售。可能的原因是美联储下调了2026年的降息预期,理由是生产者通货膨胀率高于预期, 霍尔木兹海峡-油价推动了通货膨胀的持续性。
归根结底,黄金的牛市取决于实际收益率下降和美元疲软,而目前这两个条件都不具备。交易者应意识到,在像伊朗冲突造成的通货膨胀供应冲击中,黄金的表现并不总是如预期。
但是,如果你缩小视野,长期前景将巩固黄金的避险地位,到2025年成为有记录以来最强劲的年份之一。
值得关注的关键变量:美联储指引、实际收益率和美元方向。
2。日元 (JPY)
由于日本是世界上最大的净债权国,日元长期以来一直是避险货币。在压力时期,日本投资者倾向于汇回资本,推动日元走高。
但是,到目前为止,这种动态似乎在2026年发生了变化。日元同比下跌6.63%,接近2024年7月以来的最低水平,石油进口成本的飙升正在打压该货币。
但是,日元的避险作用并未消失。在股票大幅抛售和流动性事件中,它往往会重新站稳脚跟。但是在石油驱动的通胀冲击中,它面临着结构性阻力。
值得关注的关键变量:日本央行的利率决定、美日收益率差异以及日本当局发出的任何干预信号。
3.瑞士法郎 (CHF)
瑞士的政治中立性、账户盈余和强大的机构框架使法郎成为反身避险货币。与日元不同,瑞士法郎在当前环境中保持不变,2026年法郎兑美元汇率上涨,欧元/瑞郎保持稳定。
对于欧洲和中东的交易者来说,瑞士法郎通常是压力事件中的第一停靠港。
值得关注的关键变量:瑞士国家银行的干预语言、欧洲的地缘政治发展和全球风险指数。
4。美国国债 (US10Y)
在正常情况下,美国政府债券是世界上最大、流动性最高的避险工具。但是 2026 年不是正常情况...
收益率一直在上升,而不是下降,这意味着对于任何寻求安全的人来说,债券价格都朝着错误的方向发展。
当避险事件期间收益率上升时,这表明市场将债券视为通货膨胀风险而不是安全资产。
但是,像票据和2年期国债这样的短期国债则是另一回事。与长期债券相比,它们可能提供更高的收入和更低的期限风险,这就是为什么一些投资者在动荡时期更能防御性地使用它们的原因。
值得关注的关键变量:美联储通讯、消费者价格指数和个人消费支出数据,以及10年期国债收益率是否突破4.50%或回落至4.00%以下。
5。澳元兑美元(澳元/美元):反向竞争
澳元被广泛认为是一种风险货币,与全球大宗商品需求和中国的增长密切相关。
在避险环境中,澳元/美元通常会下跌。澳元/美元下跌可以作为更广泛全球压力的主要指标,这对于具有区域风险敞口的交易者来说可能是一个有用的背景。
澳洲联储的加息周期(自2026年初以来两次加息)为澳元提供了一些下限,但在持续的全球避险走势中,这种支撑是有限的。
值得关注的关键变量:澳大利亚央行前瞻性指导、中国采购经理人指数数据、铁矿石价格以及石油对澳大利亚通胀预期的影响。
6。美元指数(DXY)
在急性压力期间,美元充当世界储备货币和反身避风港。当流动性枯竭时,无论潜在趋势如何,全球对美元的需求往往会激增。
在过去的12个月中,由于全球对美国财政轨迹的信心动摇,美元已经下跌。但在过去的一个月中,在鹰派美联储和地缘政治风险上升的支持下,它已经走强。
在避险环境中,美元继续吸引避险资金流动。但是,油价上涨会增加通货膨胀风险,使美联储的政策预期复杂化。
值得关注的关键变量:美联储利率路径、美国通胀数据和全球流动性状况。
7。新加坡元 (SGD)
新加坡元是当前环境中最具弹性的货币之一,在全球范围内鲜为人知,但在整个东南亚都具有很高的相关性。
在避险资金流和投资者被新加坡AAA评级债券、股息密集的股票市场和可预测的政府政策所吸引的支持下,新加坡元已升至接近2014年10月以来的最高水平。
新加坡金融管理局通过名义有效汇率区间而不是利率来管理新加坡元,使其具有与其他避险货币不同的性质。
对于有印尼、马来西亚、泰国、越南和更广泛的东盟地区敞口的交易者来说,美元/新加坡元可以作为区域风险偏好的实用基准。
值得关注的关键变量:新加坡金融管理局的政策区间调整、区域贸易流动以及更广泛的美元/亚洲动态。
8。现金和短期固定收益
有时,最有效的避风港可以简单地减少暴露。由于主要经济体的中央银行利率仍处于较高水平,现金和短期政府债券可以在不受市场风险影响的同时提供可观的收益率。
澳洲联储在3月份的会议上将现金利率提高至4.10%。英格兰银行维持在3.75%,而欧洲央行将其存款便利利率维持在2.00%,主要再融资利率维持在2.15%。 在所有主要经济体中,短期政府票据多年来首次提供了实际回报。
在动荡的环境中,资本保值有时比回报最大化更重要。
值得关注的关键变量:所有主要经济体的中央银行会议日历,以及利率路径前瞻性指导的任何变化。
接下来要看什么
美联储通胀数据。 核心个人消费支出是目前黄金、债券和美元最重要的单一数据点。任何一个方向上的任何惊喜都可能同时移动所有这三个方向。
日元干预风险。 日元接近此前引发日本当局行动的水平。具有亚太地区风险敞口的交易者应密切关注。
澳洲联储的下一步行动。 澳大利亚目前为4.10%,通货膨胀率仍高于目标,问题在于徒步周期是否还有更长的路要走。下一次澳洲联储会议将于5月5日举行。
地缘政治轨迹。 任何缓和中东局势的举措都将迅速减少避险需求,并将资本转回风险资产。反之亦然。
中国的增长信号。 中国复苏强于预期,可能会提振大宗商品货币,降低整个亚太地区的防御地位。
长期镜头
2026年的环境表明,避险资产的有效性取决于 类型 令人震惊,而不仅仅是其严重性。
伊朗冲突造成的通货膨胀供应冲击是传统避风港最困难的环境之一。
随着实际收益率的上升,黄金下跌。随着通货膨胀预期的攀升,债券抛售。随着日本进口成本的飙升,即使是日元也可能贬值。
无论宏观条件如何,都保持着机构信誉、管理框架和充足流动性的资产。瑞士法郎、新加坡元和短期现金工具比目前的黄金或多头债券更符合这种描述。
在2026年,交易者面临的问题不是 “哪个避风港?”它是 “避风港,避开什么?”

如果您花了任何时间查看交易终端,那么您已经看过了。新闻头条爆发,图表折线突然间所有人都在冲向同一个出口或同一个入口。看起来像混乱。实际上,它通常是一连串的机械响应。
这很重要,有两个原因。许多读者认为故事就是交易。不是。无论是利率决定、供应冲击还是盈利亏损,故事都是燃料,剧本是引擎。
以下是差价合约(CFD)交易中常用的七种核心策略。使用差价合约,您不是在买入标的资产。你在推测价值的变化。这意味着如果价格上涨,交易者可以持有多头头寸,如果价格下跌,则可以持有空头头寸。
首先要了解的七种策略
1。趋势跟踪(建制剧本)
趋势跟踪基于这样的观点,即已经在运转中的市场可以保持活跃,直到它遇到明显的结构性障碍。一些市场参与者将其视为一种基于图表的方法,因为它侧重于当前方向,而不是试图确定一个确切的转折点。
理由: 目的是找出明确的方向偏差,例如更高的高点和更高的低点,并遵循该势头而不是与之对立的方向。
交易者在寻找什么: 指数移动平均线(EMA),例如50天或200天均线,通常用于解释趋势强度,尽管指标可能会产生错误的信号并且本身不可靠。

它是如何工作的: 50周期均线可以充当动态支撑位,随着价格上涨而上升。在上升趋势中,一些交易者观察市场创出新的更高高点(HH),然后回落至EMA,然后再次走高。每走高的低点(HL)都可能表明买家仍处于控制之中。
在回调期间,当价格触及或接近50周期均线时,一些交易者将该区域视为潜在的决策区域,而不是假设趋势会自动恢复。
要看什么: HH 和 HL 的顺序是趋势结构性证据的一部分。如果该序列中断,例如价格跌破先前的HL,则趋势可能会减弱,设置可能不再成立。
2。区间交易(乒乓球比赛)
市场可能会在很长一段时间内横盘整理。这就形成了一个区间,买家和卖家处于暂时的平衡状态。区间交易是围绕这种行为建立的,侧重于既定区间底部和顶部附近的走势。
理由: 价格在下限(称为支撑)和上限(称为阻力)之间移动。在这些边界附近移动可以帮助定义范围的宽度。
交易者在寻找什么: 一些交易者使用相对强度指数(RSI)等振荡器来帮助判断资产在每个边界附近看起来是超买还是超卖。

它是如何工作的: 支撑位是一个价格区域,从历史上看,买入兴趣足够强劲,足以阻止市场进一步下跌。阻力位是历史上抛售压力阻碍进一步上涨的地方。
当价格接近支撑位时,一些交易者会寻找潜在反弹的迹象。当它接近阻力位时,他们会寻找势头可能正在减弱的迹象。RSI读数低于35可能表明市场在支撑位附近超卖,而高于65的读数可能表明市场在阻力位附近超买。
要看什么: 区间交易的主要风险是突破,即价格以强劲的势头果断地突破任一水平。这可能预示着新趋势的开始,在每笔交易中使用范围之外的止损可能有助于管理这种风险。
3.Breakouts(卷曲的春季剧本)
最终,每个区间都承受着压力。当平衡发生变化并且价格突破支撑或阻力时,就会发生突破。市场在低波动时期(价格在窄幅区间内横盘整理)和高波动性爆发时期(价格可以做出更大的方向性波动)之间交替出现。
理由: 在平静的整合之后,有时会出现更广泛的波动性扩大。压缩越紧,为下一步行动储存的能量就越多。
交易者在寻找什么: 布林带通常用于解释波动率的变化。当带子收紧时,就会形成挤压。一些市场参与者认为,走出区间表明情况可能正在发生变化。

它是如何工作的: 布林带由一条中线、20个周期的移动平均线和2个根据近期价格波动而扩张或收缩的外部波动组成。当波段收窄并接近时,即挤压,市场异常平静。
这通常被描述为螺旋弹簧。能量可能正在积累,随后可能会采取更严厉的举动。一些交易者将首次穿过外波段视为方向的早期线索,而不是其本身的明确信号。
要看什么: 并非每一次挤压都会导致强劲的突破。当价格短暂移动到区间外,然后迅速反转回区间内时,就会发生虚假突破。等待蜡烛在区间外收盘,而不是进入蜡烛中间,可以降低陷入虚假走势的风险。
4。新闻交易(偏差游戏)
这是事件驱动的交易。重点是市场预期与数据或标题实际交付之间的差距。经济数据的发布,例如通货膨胀数据(CPI)、就业报告和中央银行的决定,可能会导致金融市场急剧快速波动。
理由: 高影响力的发布,例如通货膨胀数据或中央银行的决定,可能会迫使资产快速重新定价。相对于预期,惊喜越大,走势可能越大。
交易者在寻找什么: 交易者经常使用经济日历来追踪时机。有些人关注市场在初步反应后的表现,而不是将第一步视为决定性的。

它是如何工作的: 在新闻发布之前,随着交易者的等待,价格可能会在平静的窄幅区间内波动。当数据发布时,如果实际读数与共识预期存在显著差异,则重新定价可能会很快发生。
例如,由于消费者价格指数高于预期,黄金可能会大幅飙升。但是,蜡烛也可以打印出很长的上部灯芯,这意味着价格达到了飙升的高位,但随后遭到了强烈的拒绝。卖家可能会迅速介入,价格可能会回调。这种飙升和回撤模式是新闻交易中最容易识别的设置之一。
要看什么: 初始峰值的方向和大小并不总是能说明全部情况。灯芯长度可以提供重要的线索。长灯芯可能表明最初的动作被拒绝,而数据发布后的灯芯较短可能表示方向性移动更加持续。
5。均值回归(橡皮筋游戏)
价格有时会变动得太远、太快。均值回归建立在这样的理念之上,即过度波动可能会向历史平均水平偏移,就像橡皮筋拉得太紧,然后反弹一样。
理由: 这是一种逆势方针。它寻找可能无法持续的乐观情绪或悲观情绪,以及恢复平衡的立场。
交易者在寻找什么: 一个常见的例子是价格远离20天移动平均线(MA),而RSI也达到了极限水平。在这种设置中,交易者关注的是向均值回落,而不是继续偏离均值。

它是如何工作的: 20周期均线代表市场最近的平均价格。当价格进入极端区域时,例如高于或低于该平均值的3个标准差以上,则与最近的趋势相去甚远。
RSI高于70可能表明市场向上拉伸,而低于30则表明下行趋势相同。一些均值回归交易者使用这些组合信号作为可能向20周期均线回调的信号,而不是假设这一走势将继续延续。
要看什么: 在趋势强劲的市场中,均值回归策略可能会带来重大风险。市场的延续时间可能会超过预期,而与短期趋势相反的头寸可能会导致大幅下跌。头寸规模和明确的止损至关重要。
6。心理水平(大人物游戏)
市场由人驱动,人们倾向于关注整数。100美元、2,000美元或货币对的平价1.000美元可以起到磁铁的作用。在金融市场中,某些价格水平可能会吸引不成比例的买入和卖出活动,这不仅仅是因为技术分析,而是由于人类的心理。
理由: 大额订单、止损和止盈水平可能聚集在这些大数字周围,这可能会强化支撑或阻力。这种自我强化的行为是这些拒绝对交易者有意义的原因之一。
交易者在寻找什么: 交易者经常观察价格在接近整数时的表现。市场可能会犹豫不决,拒绝该水平或以势头突破该水平。同一级别的多次灯芯拒收可能比单个灯芯的重量更大。

它是如何工作的: 当价格从下方接近整数时,一些交易者会注意上方的长灯芯,即蜡烛体上方的细垂直线。上限较长意味着价格已达到该水平,但卖家积极介入,并在蜡烛收盘前将其推回下方。
一根灯芯的拒绝可能值得注意。一个集群中有三个可能更重要。一些交易者将这种累积的拒绝作为在该水平上进行卖空(卖出)设置的理由的一部分。
要看什么: 心理水平也可以充当相反方向的磁铁。如果价格坚定地突破,则该水平可能会起到支撑作用。决定性的收盘价高于该水平,而不仅仅是断线,可能是拒绝设置已不再有效的早期迹象。
7。行业轮换(经济季节走势)
这是一种宏观策略。随着经济背景的变化,资本可能会从较高增长的行业转移到更具防御性的行业,然后再次返回。并非股市的所有部分都同时朝着同一个方向发展。
理由: 在经济放缓中,全权支出可能会减弱,而对基本服务的需求可以保持更加稳定。投资者可以相应地在行业之间轮换资本。
交易者在寻找什么: 在差价合约中,一些交易者通过相对强势来表达这种观点,在减少或抵消较弱板块的敞口的同时,增加或抵消对较弱板块的敞口。

它是如何工作的: 在增长阶段,当经济扩张时,投资者倾向于偏爱科技等以增长为导向的行业。随着经济环境的变化,可能是由于利率上升、收益放缓或衰退风险增加所致,可能会出现一个轮换点。
在放缓阶段,这种模式可以逆转。随着投资者将资本转移到防御性创收领域,科技可能会走弱,而公用事业可能会走强。早期信号可能包括增长板块表现相对不佳,以及防御力异常强劲。
要看什么: 行业轮换通常不是一朝一夕的事情。它通常持续数周到数月。跟踪两个板块之间的比率(通常显示在相对强度图表中)可以使这种转变在绝对价格变得明显之前就显现出来。

为什么风险管理是生存的引擎
头条新闻是一回事。对您账户的市场影响是另一回事。如果你不管理机制,策略就无关紧要。
由于差价合约是以保证金交易的,因此小幅的市场波动可能会对账户产生巨大影响。如果杠杆率过高,即使是轻微的波动也可能触发追加保证金或自动平仓,具体取决于提供商的条款。这不是理论上的风险。这是新交易者在方向正确的交易中损失超过预期的常见原因。
市场并不总是沿直线移动。有时,从一个级别到另一个级别的价格差距,尤其是在周末或重大新闻事件之后,在这种情况下,止损可能无法以确切的要求价格填补。这就是所谓的滑点。这是大额头寸可能会给重大公告带来额外风险的原因之一。
底线
这辆车很强大,但剧本可以帮助你继续行驶。
显而易见的交易通常已经定价了。更重要的是了解摆在你面前的市场状况。是潮流、范围调整、爆发还是仅仅是对标题做出反应?
评估杠杆产品的读者通常将重点放在头寸规模、风险限额和产品披露上,然后再决定该产品是否适合他们。头条新闻将继续变化。风险管理的数学不是。
准备好在主要交易之外进行交易了吗?
开设一个账户 · 登录
免责声明:本文仅为一般信息,仅用于教育目的。它解释了常见的交易概念和市场行为,并不构成金融产品建议、推荐或交易信号。任何例子仅供参考,不考虑您的目标、财务状况或需求。差价合约是复杂的杠杆产品,风险很高。在采取行动之前,请考虑PDS和TMD以及差价合约交易是否适合您。必要时寻求独立建议。过去的表现不是未来业绩的可靠指标。
上周的影响与广告一样重要。澳洲联储加息,美联储坚持加息,在有报道称以色列袭击伊朗南帕尔斯天然气田之前,市场几乎没有时间处理任何加息。
未来一周的央行决策将减少,但对市场可能同样重要。Flash PMI将首次广泛了解这场战争是否已经出现在商业信心中。澳大利亚2月份的消费者价格指数是对澳洲联储下一步行动最重要的国内数据点。而石油市场仍然是主要的宏观变量。
事实速览
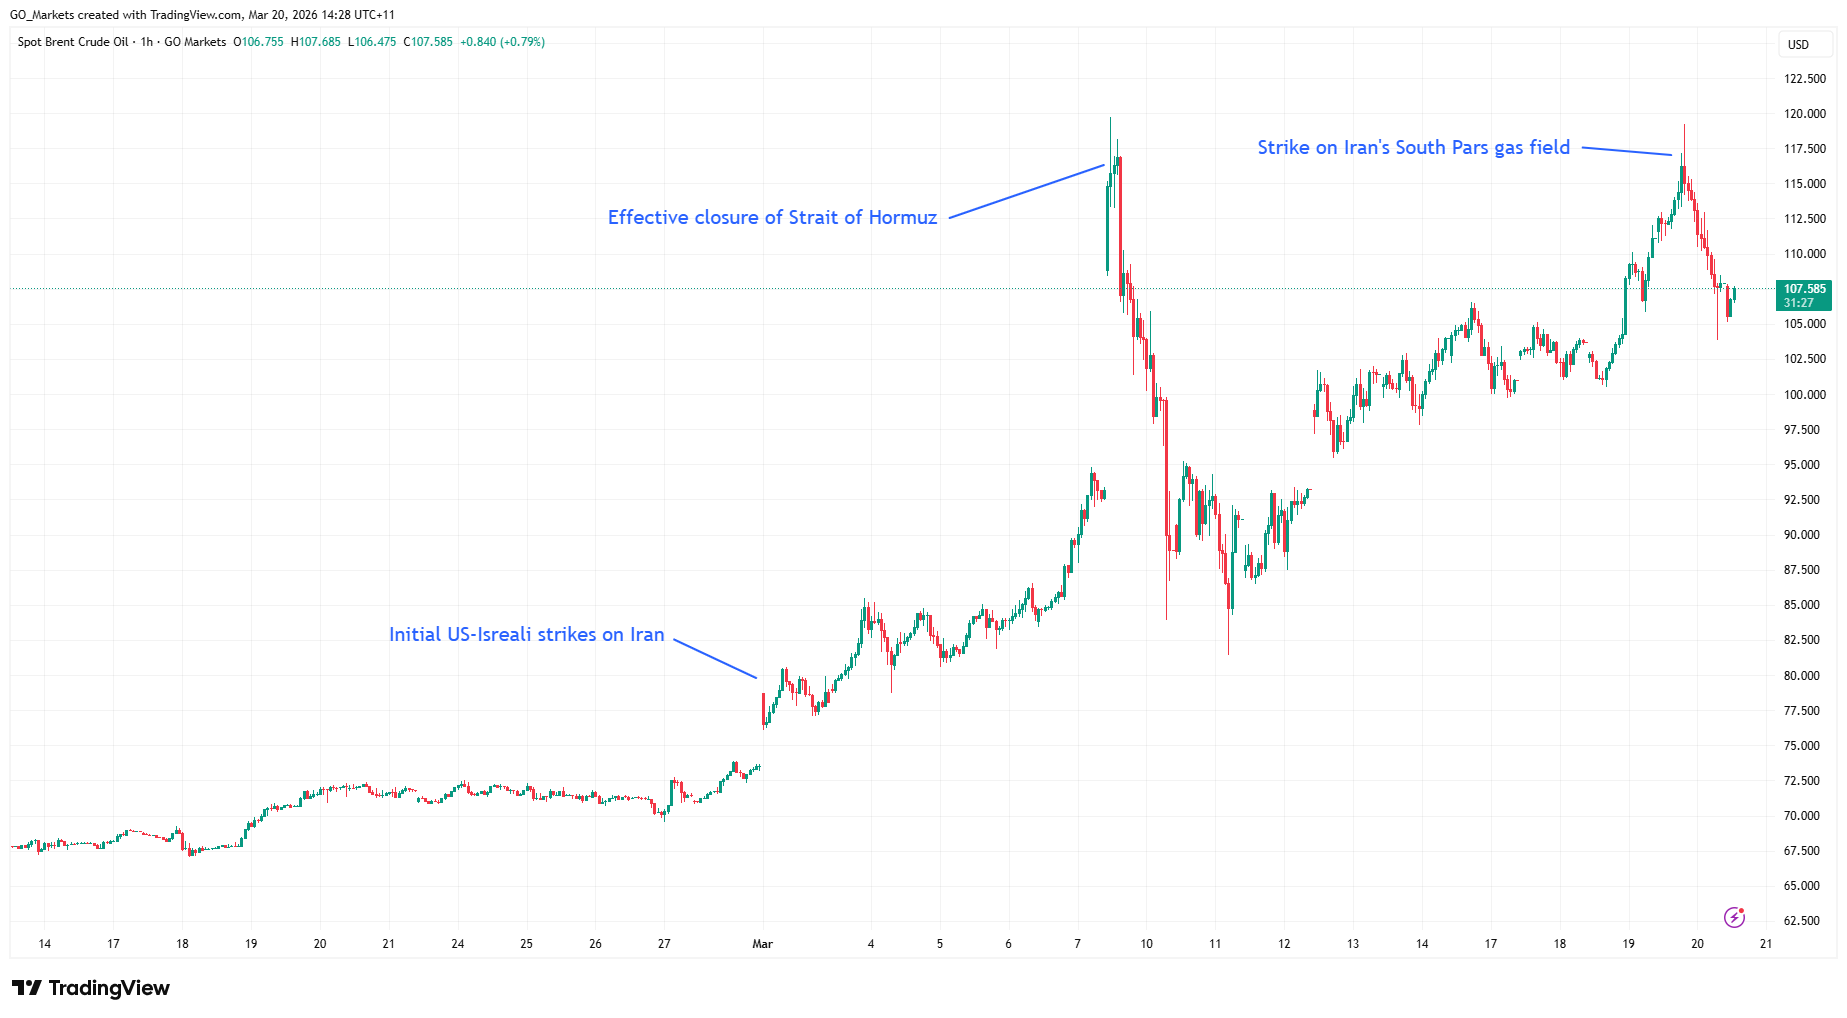
- 在以色列首次袭击伊朗南帕尔斯天然气田后,布伦特原油价格飙升至每桶110美元以上。
- 澳大利亚、日本、欧元区、英国和美国的初步采购经理人指数均在周二公布。
- 澳大利亚2月份消费者价格指数周三公布,这是自澳洲联储连续加息以来的首次通胀数据。
石油:从危机到紧急情况
上周石油局势严重恶化。自2月28日战争爆发以来,布伦特原油已经飙升了约80%。
3月18日对伊朗南帕尔斯天然气田的袭击是上游石油和天然气基础设施首次成为攻击目标。
伊朗对袭击的回应是威胁要瞄准沙特阿拉伯、阿联酋和卡塔尔各地的设施。如果这些威胁中的任何一个得到实施,全球石油冲击将从供应中断升级为对该地区产能的直接攻击。
分析师现在表示,150美元的布伦特原油是可以实现的,200美元不在可能范围之内。1970年代的阿拉伯石油禁运导致价格翻了三番,高级能源主管已经用这些术语描述了当前的冲击。
对于本周的市场而言,石油是主要变量。任何停火、外交进展或恢复霍尔木兹航运的信号都可能引发油价的回调。伊朗对海湾基础设施的任何袭击都可能使它们走高。
监视器
- 通过霍尔木兹海峡的每日船只过境次数。
- 伊朗对海湾基础设施的报复,对沙特或阿联酋设施的袭击将是重大升级。
- 美国和欧洲的IEA储备何时以及如何进入市场。
- 卡塔尔南帕尔斯的中断正在影响欧洲液化天然气市场。
- 特朗普的言论可能导致盘中油价波动。
全球采购经理人指数快报:关于处于战争状态的经济的第一篇读物
周二同时公布了所有主要经济体3月份的标准普尔全球采购经理人指数初值估计。
这将是第一个记录制造商和服务公司如何应对超过100美元的石油、霍尔木兹海峡封锁以及中东战争造成的更广泛不确定性的数据集。
每个经济体的关键问题是,油价飙升和战争的不确定性是否削弱了商业信心,抑制了新订单或将投入价格指数推至多年来的新高。
鉴于在大多数经济体的调查窗口关闭之前,石油价格已突破100美元,因此投入成本读数可能会大幅上升。
关键日期
- 标普全球快报澳大利亚采购经理人指数: 澳大利亚东部夏令时间3月24日星期二上午9点
- 标普全球快报日本采购经理人指数: 澳大利亚东部夏令时间3月24日星期二上午11点30分
- 汇丰银行印度采购经理人指数简报: 澳大利亚东部夏令时间3月24日星期二下午 4:00
- HCOB Flash 法国采购经理人指数: 澳大利亚东部夏令时间3月24日星期二晚上 7:15
- HCOB Flash 德国采购经理人指数: 澳大利亚东部夏令时间3月24日星期二晚上 7:30
- HCOB 欧元区采购经理人指数简报: 澳大利亚东部夏令时间3月24日星期二晚上 8:00
- 标普全球快报英国采购经理人指数: 澳大利亚东部夏令时间3月24日星期二晚上 8:30
- 标普全球快报美国采购经理人指数: 澳大利亚东部夏令时间3月25日星期三上午12点45分
监视器
- 制造业和服务业中任何多年高点的输入价格组成部分。
- 衡量战争冲击在多大程度上削弱了前瞻预期的商业信心指数。
- 新订单是未来产出的指标;急剧下降可能预示着需求正在受到破坏。
- 美国综合采购经理人指数:已经是2月份主要经济体中最疲软的数据,另一个软数据可能会敲响增长的警钟。
澳大利亚:又一次加息了吗?
澳洲联储于3月17日连续第二次会议上调,以5票对4票的微弱票数将现金利率提高至4.10%。
布洛克州长将其描述为一场 “非常活跃的讨论”,政策方向不成问题,只是时机问题。
本周将公布的2月份消费者价格指数作为反映任何石油冲击的第一手数据。扣除包括燃料在内的挥发性物质的调整后的均值将是澳洲联储最密切关注的数字。高于3.5%的读数可能会巩固5月份加息的理由。较为温和的结果可能会使暂停的论点死灰复燃。
澳新银行和澳大利亚国民银行都表示预计5月份将进行第三次加息,使现金利率达到4.35%。
关键日期
- ABS 消费者价格指数(CPI): 澳大利亚东部夏令时间3月25日星期三上午11点30分
监视器
- 削减后的平均通货膨胀率是澳洲联储的首选衡量标准。
- 可以将石油冲击与国内价格压力区分开来的燃料和能源成分。
- 住房和服务通货膨胀是推动澳洲联储长期担忧的粘性因素。
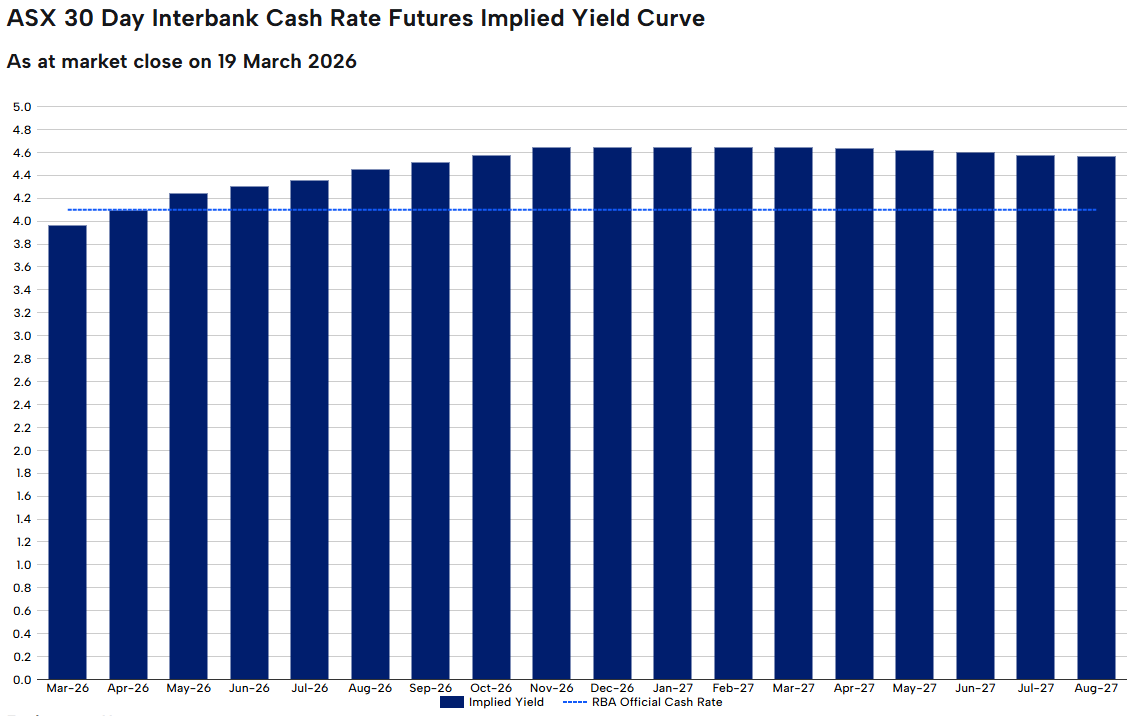
来源: ASX 澳洲联储利率追踪器
准备好在主要交易之外进行交易了吗?
开设一个账户 · 登录