Market news & insights
Stay ahead of the markets with expert insights, news, and technical analysis to guide your trading decisions.

Markets head into the week beginning 16 February with a heavy mix of economic data and ongoing earnings momentum, which will feed into the broader growth picture.
- Flash PMIs (Friday): US, Eurozone, UK and Japan business surveys provide an early read on February growth momentum.
- AI beyond tech: Commentary has increasingly focused on how AI could affect business models across industries, although sector moves can reflect multiple drivers.
- Equity rotation: Recent tech performance has been mixed, and broader participation looks less consistent than a confirmed rotation.
- Earnings: With most US mega caps reported, retail and consumer names are in focus this week, and the Australian reporting season remains busy.
- Bitcoin (BTC): Pulled back after an attempted rebound and remains highly sensitive to shifts in sentiment.
Flash PMIs
Friday’s flash PMI readings across major economies could provide a timely read on business conditions and demand trends.
If services remain resilient while manufacturing stays soft, markets may interpret this as steady but uneven growth. If both weaken, growth concerns could return more quickly.
Earlier in the week, Japan GDP, UK labour data, UK CPI, Australian employment, and US trade data helped set the tone before Friday’s flash PMI releases from multiple countries.
Key dates
- Flash PMIs (US, Eurozone and UK): Friday, 20 February
Monitor
- Currency volatility around PMI releases.
- Bond yield reactions to growth surprises or disappointment.
- Sector and commodity performance shifts that may be tied to changing demand expectations.
AI disruption
Some market commentary has highlighted potential longer-term competitive implications of AI across a range of industries, although company and sector performance can still be driven by macro conditions, rates and earnings expectations.
- Financials: Some discussion has focused on whether AI tools could alter parts of wealth management and advice delivery over time, though share-price moves can reflect multiple influences.
- Logistics and freight: Some market discussion has centred on whether greater automation could affect costs and pricing dynamics over time, alongside other cyclical drivers.
- Software: Reactions remain mixed, with some companies benefiting from AI integration while others face questions about differentiation and pricing power.
This shift means the AI theme could increasingly express itself through relative performance and dispersion, rather than a broad “risk-on” bid.
Monitor
- Earnings guidance that references automation, AI investment, or AI-related competitive pressure.
- Increased dispersion between sectors and within sectors.
- Larger reactions to forward-looking commentary rather than headline beats or misses.
Equity rotation
The rebound in technology shares seen earlier last week has lost momentum. Rather than clear risk-off conditions, the market is showing mixed participation.
Financials, industrials and defensive sectors have attracted flows at times, but not consistently enough to confirm a durable rotation.
Participation remains uneven, and evidence of a more consistent pattern of money flow is still limited at this stage.
Monitor
- Sustained relative strength in non-tech sectors.
- Yield movements and their influence on growth-sensitive equities
- Broader sector participation versus narrow tech leadership
Earnings focus
As the US earnings season moves towards its backend, attention turns toward retail names this week.
Retail results can provide signals about consumer strength, discretionary spending trends and margin resilience, particularly amid mixed perceptions about the state of the economy.
In Australia, reporting season continues, supporting stock-specific volatility across the ASX.
Monitor
- Retail margin commentary and discounting trends
- Consumer demand outlook statements and guidance tone
- Large single-stock moves even when index direction is muted
Bitcoin sentiment-sensitive
Bitcoin has traded lower over recent sessions and remains highly volatile. A move back toward the 5 February low is possible, but prices can change quickly in either direction.
Some market participants view Bitcoin as one indicator of speculative sentiment, although any broader “risk appetite” read-through is uncertain and can be influenced by multiple drivers across crypto markets.
Key economic events


Big global events like the Olympics can pull attention away from markets, shift participation, and thin out volume in pockets.
When that happens, liquidity can appear lighter, spreads can be less consistent, and short-term price action can become noisier, even if broader index-level volatility does not change materially.
So instead of asking “Do the Olympics create volatility?”, a more practical lens is to ask “What volatility events could show up during the Games?”
Quick facts
- Evidence is generally weak that the Olympics themselves are a consistent, direct driver of market volatility.
- Volatility spikes that occur during Olympic windows have often coincided with bigger forces already in motion, including macro stress, policy surprises, and geopolitics.
- The more repeatable Olympics-linked impact tends to be around execution conditions, not a new fundamental market regime.
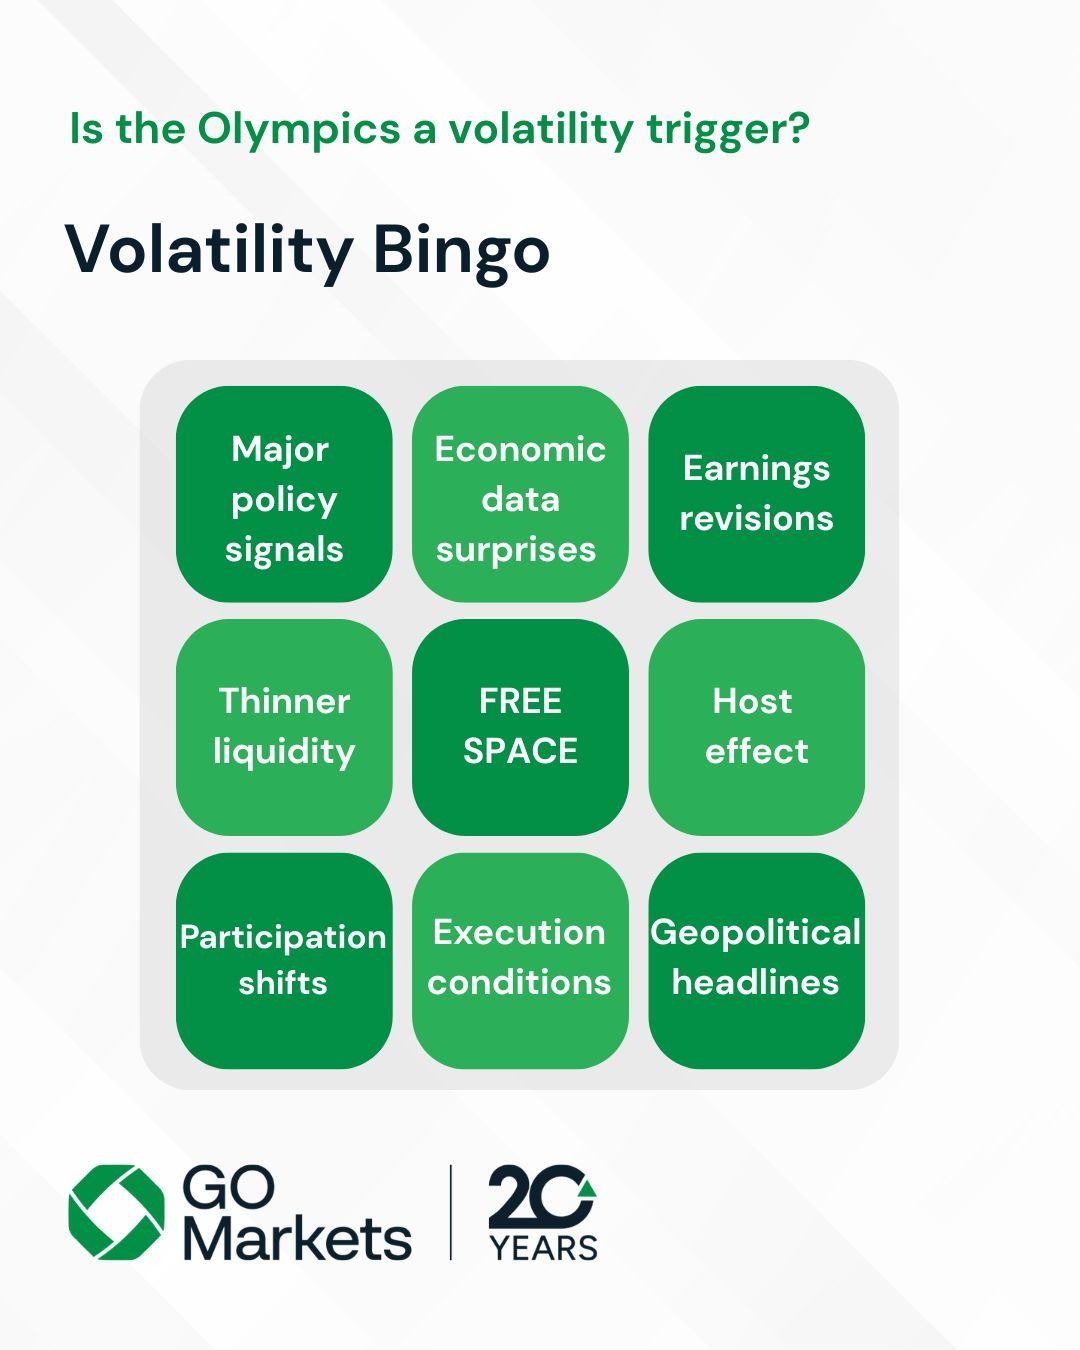
Olympic “volatility bingo”, how it works
Think of it as a checklist of common volatility triggers that can land while the world is watching.
Some “volatility bingo” squares are timeless, like central banks and geopolitics. Others are more modern, such as cyber disruption risk, climate activism, and social flashpoints surrounding host-city logistics.
Macro and policy
Central bank shock
When policy expectations shift, markets can move regardless of the calendar.
London 2012 is a reminder that the story was not sport. It was the Eurozone. In late July 2012, ECB President Mario Draghi delivered his “whatever it takes” remarks in London, at a time when sovereign stress was a dominant volatility theme.
Macro stress already underway
Beijing 2008 took place in a year defined by the global financial crisis, with volatility tied to credit stress and repricing risk appetite, not to the event itself. The Games ran from 8 August 2008 to 24 August 2008.
Geopolitics and security
Regional conflict timing
During Beijing 2008, the Russia-Georgia conflict escalated in early August 2008, overlapping with the Olympic period. The market lesson is that geopolitical repricing does not pause for major broadcasts.
“After the closing ceremony” risk
Beijing 2022 ended on 20 February 2022. Russia’s full-scale invasion of Ukraine began on 24 February 2022, only days later.
This is a classic “bingo square” because it reinforces the same principle. A geopolitical escalation can land near a global event window without necessarily being caused by it.
Security incident headline shock
The Olympics have also been directly impacted by security events, even if those events are not “market drivers” on their own.
Two historic examples that shaped the broader security backdrop around major events are:
- The Munich massacre during the 1972 Summer Games.
- The 1996 Atlanta Olympics bombing in Centennial Olympic Park.

Modern host-city climate
Environmental and anti-Olympics protests
Host city activism is not new, but the themes have become more climate and infrastructure-focused.
Paris 2024 saw organised protests and “counter-opening” events. Reporting around Paris also referenced environmental protest attempts by climate groups.
The current 2026 Winter Olympics opened amid anti-Olympics protests in Milan, with reporting that included alleged railway sabotage and demonstrations focused in part on the environmental impacts of Olympic infrastructure.
These types of headlines can matter for markets indirectly, through risk sentiment, transport disruption, policy response, and broader “instability” framing.
Cyber disruption risk
The cyber “bingo square” has become more prominent in modern Games.
France’s national cybersecurity agency ANSSI reported 548 cybersecurity events affecting Olympics-related entities that were reported to ANSSI between 8 May 2024 and 8 September 2024.
Even when events are contained, cyber incidents can still add noise to headlines and confidence.
Logistics and “can the event run” controversy
Sometimes the volatility link is not the Games, but the controversy around delivery.
Paris 2024 had high-profile scrutiny around the Seine and event readiness, alongside significant public spending to clean the river and ongoing debate about water quality risks.
Health and disruption narratives
Public health concerns
Rio 2016 is a reminder that health risk narratives can become part of the Olympic backdrop, even when the market impact is indirect.
Zika concerns were widely discussed ahead of the Games, including debate about global transmission risk and travel-related spread.
The “postponement era” memory
Tokyo 2020 was postponed to 2021 due to COVID-19, which underlined that global shock events can dominate everything else, including major sporting calendars.

Practical takeaways for traders
The most repeatable Olympics-era shift is often not “more volatility”, but different execution conditions.
During major global events, some traders choose to watch spreads and depth for signs of thinning liquidity, trade less when conditions look choppy, and stay aware that geopolitical, cyber, and protest headlines can hit at any time.
In global markets of enormous scale, sport is usually not the catalyst. The bingo squares are.

The Olympic and Winter Olympic Games capture global attention for weeks, drawing millions of viewers and dominating headlines. For traders, this attention often feels like a catalyst, yet the real market drivers remain the same: macroeconomics, policy, and global risk sentiment, not the sporting calendar.
So why do some traders say results feel weaker during major sporting events?
Often it comes down to a failure to adapt to conditions that can shift at the margin, particularly liquidity and participation.
1. Expecting “event volatility”
A major global event can create an assumption that markets should move more. Some traders position for breakouts or increase risk in anticipation of bigger swings, even when conditions don’t support it.
Key drivers
- In some markets and sessions, reduced participation can weaken trend follow-through
- Sentiment can inflate expectations beyond what price action delivers
Example: A trader expects a breakout during the Olympic opening ceremony period, but low regional participation limits price movement, leading to false starts.
2. Forcing trades in quiet sessions
When price action is slower and ranges compress, some traders feel pressure to stay active and take lower-quality entries.
Key drivers
- Narrow intraday ranges can increase false signals
- Lower conviction can favour consolidation over trend, raising false-break risk
- “Staying engaged” can reduce selectivity
Takeaway: Use quieter sessions to refine setups or review data rather than forcing marginal trades.
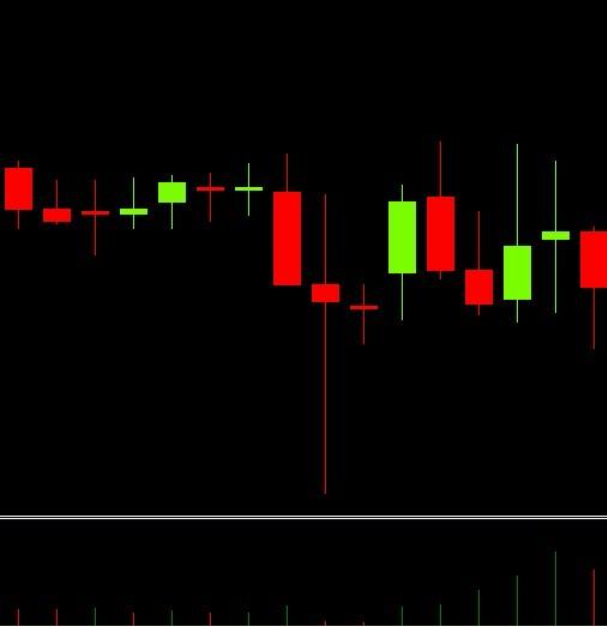
3. Ignoring thinner liquidity
Participation can ease slightly during major global events, and the impact is often more pronounced on shorter timeframes. Daily charts may look normal, while intraday price action becomes choppier with more wicks.
Key drivers
- In lower-depth conditions, price can jump more easily, and wick size can increase
- In some instruments and sessions, thinner liquidity can coincide with wider spreads and more variable execution (varies by market, venue and broker conditions)
Timeframe sensitivity to thinner conditions
The above table is illustrative only (varies by market): Daily charts may look normal. Five-minute charts can feel more erratic.
Low volume big wicks example
4. Using normal size in abnormal conditions
Even if overall volatility looks stable, execution risk can rise when liquidity thins, especially for short-term or scalping-style approaches.
Key drivers
- Slippage can increase, and stops may “overshoot”
- Thin conditions can trigger stops more easily in noise
- Wider spreads can shift entry/exit outcomes versus normal conditions
Adjustment: Maintaining fixed sizing may distort effective risk. Some traders review transaction costs, including spreads, and execution conditions when setting risk parameters such as stops/limits, particularly in thinner sessions.
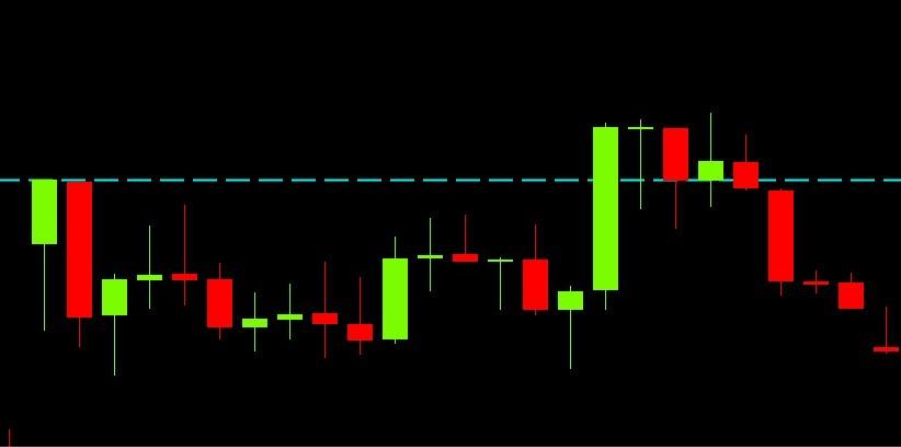
5. Trading breakouts with low follow-through
Trend-following tactics can falter when participation declines. Momentum may dissipate quickly, and false breaks become more common.
Key drivers
- Reduced flow can limit sustained directional moves
- Some low-liquidity regimes may favour mean reversion over momentum
Example: A classic range breakout appears valid intraday but fades rapidly as follow-through volume fails to materialise.
Failed breakout example
6. Overlooking timing and distraction risk
There is no reliable evidence that the Olympic calendar predictably drives geopolitical events. But when tensions are already elevated, major global events can sometimes coincide with attention being spread elsewhere, somewhat similar to holidays, elections or major summits.
Traders should identify when conditions are slower or thinner and adjust accordingly, aligning tactics with reduced follow-through risk and calibrating position sizes to execution reality. Most importantly, avoid forcing trades when edge is limited during these periods.
Upcming economic events

The torch is lit in Milan, and public attention has moved from the opening-ceremony theatrics to the competition on the slopes.
But for forex (FX) traders, eyes are still on the euro (EUR) charts. With Italy at the centre of the sporting world, the eurozone economy is facing one of its most-watched moments of the year.
1. The home court advantage (Italy’s economy)
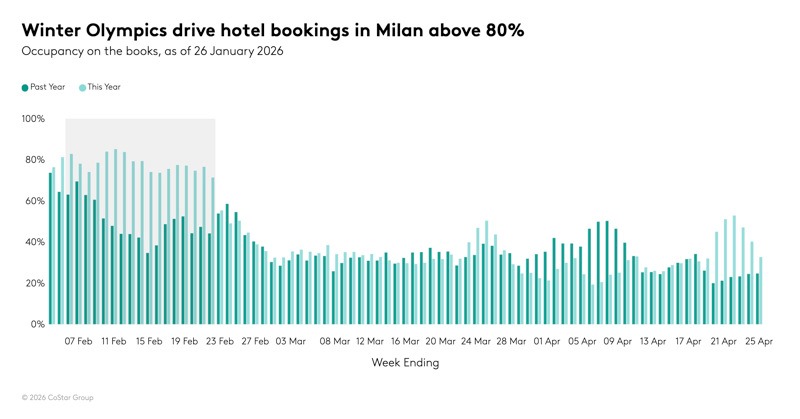
Some estimates suggest the Olympics could deliver roughly a €5.3 billion boost to the Italian economy, driven by direct spending and a longer tourism tail once the flame goes out. In practical terms, that can mean a front-loaded “direct expenditure” phase. Hospitality, retail and transport demand can peak as an estimated 2.5 million spectators move between Milan and the Dolomites.
Checklist task: Watch Italy industrial production (Wednesday, 11 February 2026). While the Games may support services activity, it’s worth tracking whether broader production data is keeping pace or if the Olympic impact is narrowly concentrated in tourism‑linked sectors.
2. The ECB signals
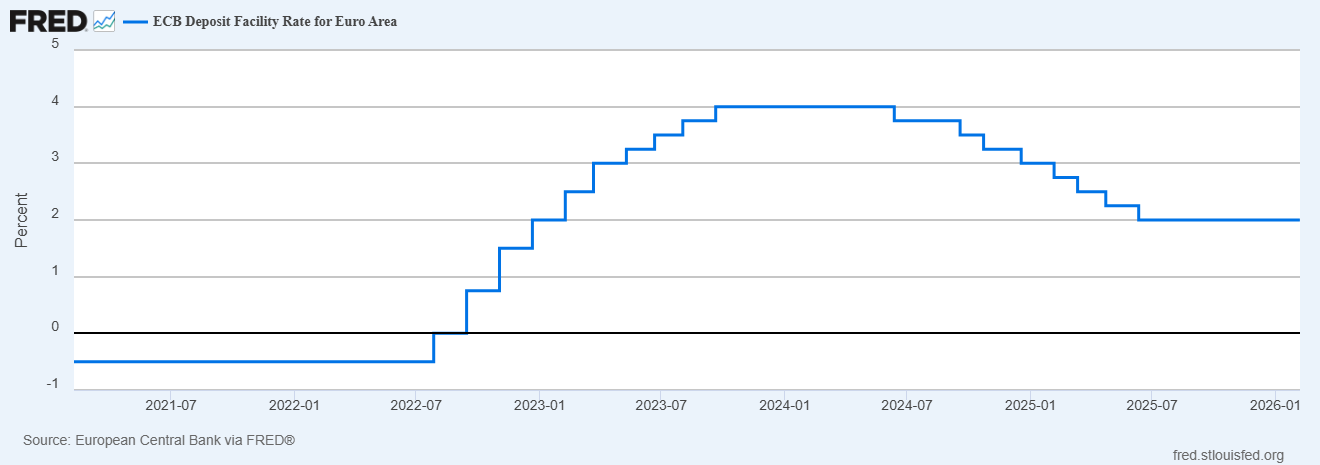
At its 5 February meeting, the European Central Bank (ECB) held policy settings steady at 2.15% and the deposit facility at 2.00%. President Christine Lagarde signalled that while inflation appears to be stabilising, the ECB remains in “wait and see” mode.
Checklist task: Monitor speeches from ECB members this week. Any shift in tone, including a more hawkish tilt that suggests rates may stay higher for longer, could act as a potential tailwind for EUR/USD, especially if it contrasts with a more cautious Federal Reserve tone.
3. Navigate the London-New York overlap
The most prestigious Olympic finals often land in the European evening. For traders, this lines up with the London to New York session overlap (typically 14:00 to 17:00 GMT). That’s when liquidity is deepest in EUR crosses and when positioning can whipsaw around data and headlines.
Checklist task: Expect possible peak liquidity and the potential for “false breakouts” during these hours. If a major US data point (such as Tuesday’s retail sales, or Friday’s CPI) lands while European markets are still open, EUR pairs may see a volatility pickup.
GO Markets week ahead
4. Safe haven slopes
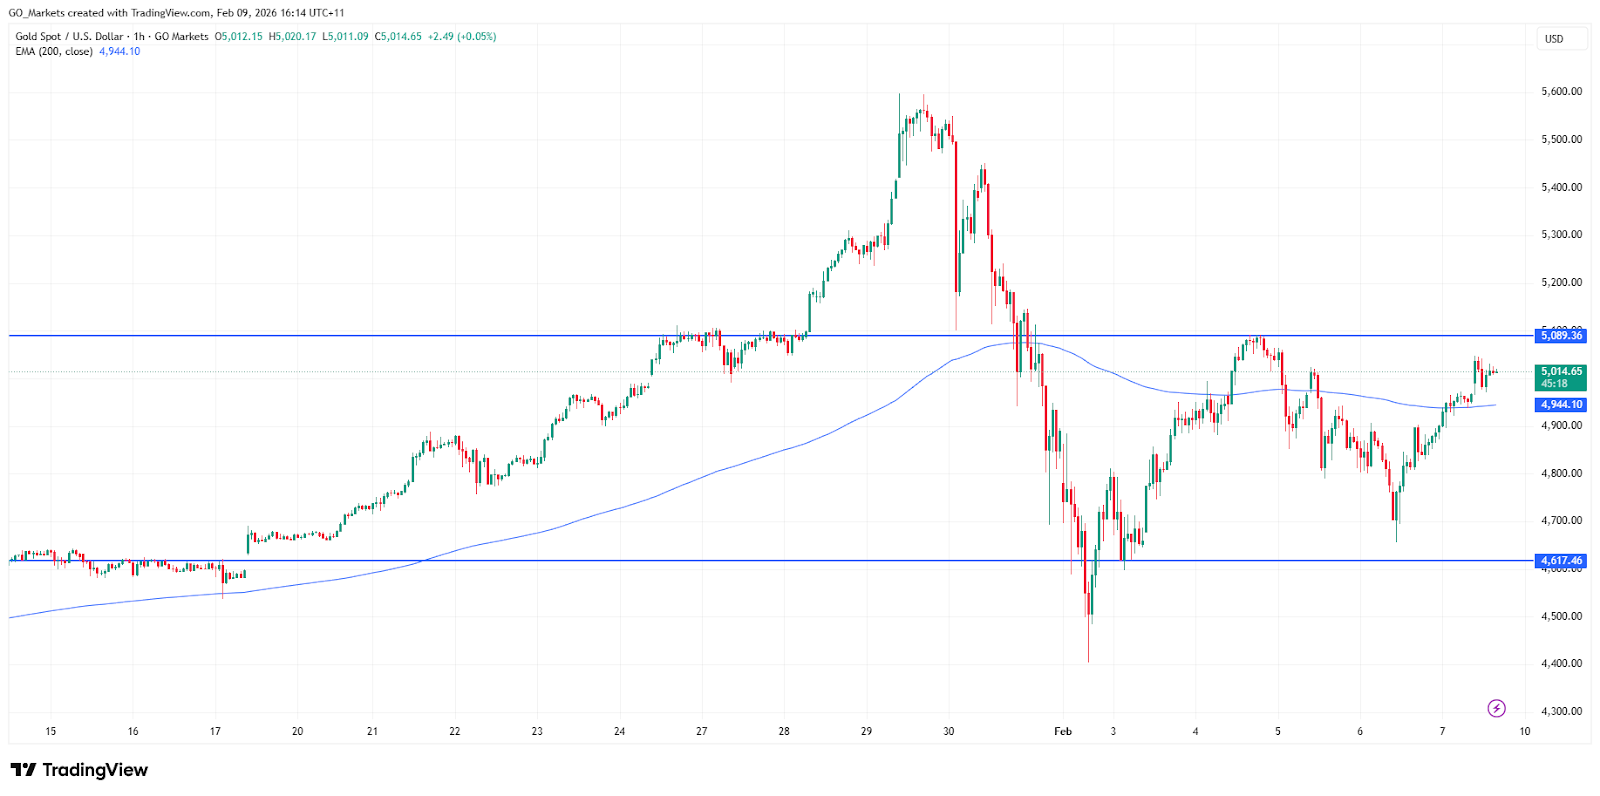
While the euro is the star of the show, the Olympics can still be shadowed by broader geopolitical noise. For example, gold is already trading around the US$5,000 mark after briefly breaking above it in early February, driven by central‑bank buying, expectations of a weaker dollar, and upgraded year‑end forecasts.
Checklist task: If sentiment turns risk-off, watch traditional haven assets such as the Swiss franc (CHF) and gold. Gold has seen large swings recently and is currently testing resistance near US$5,000. EUR/CHF may also see higher volatility if geopolitical headlines intensify during the Games.
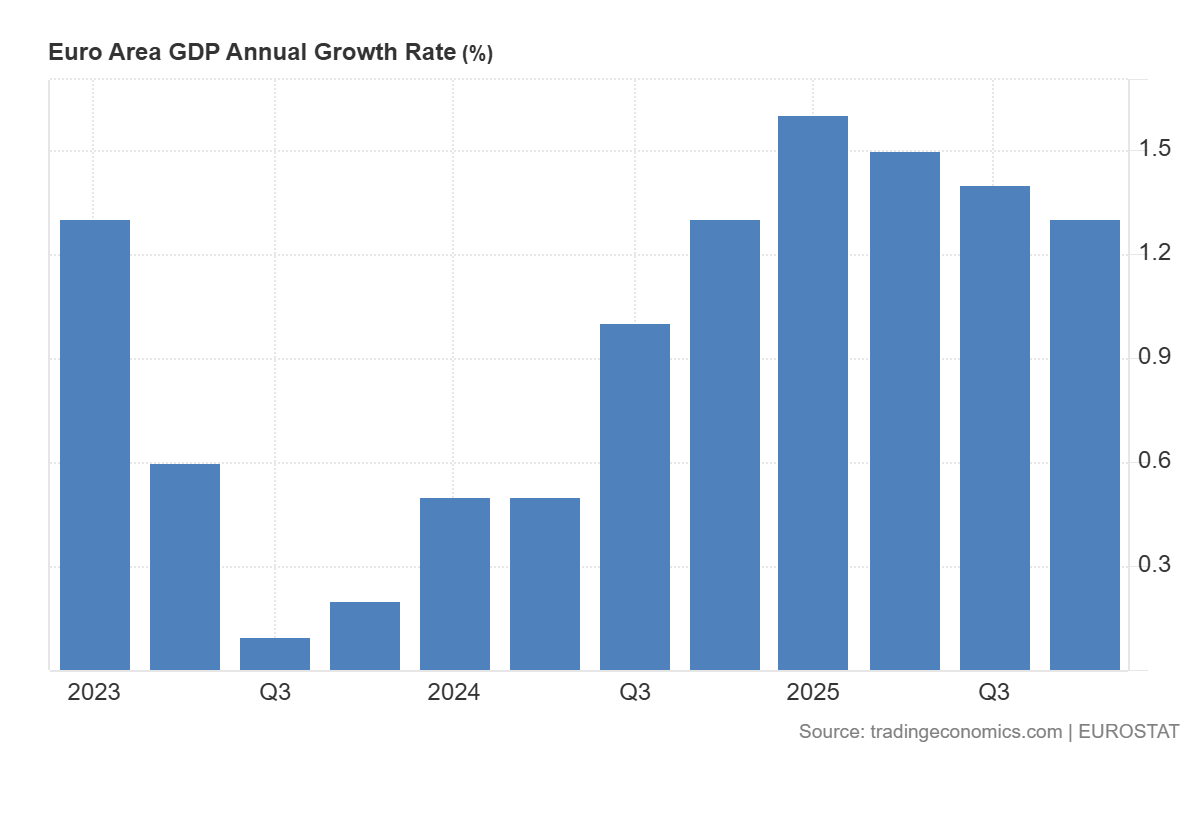
5. GDP final standings
The week wraps with the eurozone’s Q4 GDP (second estimate) on Friday, 13 February 2026.
Checklist task: The preliminary estimate showed 0.3% growth. If the figure is revised upward, it may reinforce the eurozone’s resilience and could support a late-week bid in EUR.
Bottom line
While the “Olympic boost” may offer a sentiment cushion for Italy, the euro’s direction is still likely to be shaped by whether the ECB’s “wait and see” stance is challenged by Friday’s GDP update or Wednesday’s industrial production release.
With gold hovering near US$5,000 and the US facing a calendar affected by rescheduled data, volatility could stay elevated into key overlap hours, right as prime-time events are taking place.

Your complete day-by-day guide to Australian medal chances and market-moving moments during the Milano Cortina Winter Olympics.
Quick Facts
- Opening Ceremony: 6:00 am, 7 February AEDT (8:00 pm, 6 February Milan).
- Prime viewing window: 4:00 am to 2:00 pm AEDT daily coincides with pre-market and ASX trading hours.
- Medal ceremonies: Typically run from 6:00 am to 7:00 am AEDT. Perfect for pre-market position adjustments.
- 53 Australian athletes competing: The second-largest Australian Winter Olympic team ever, with 10 genuine medal contenders.
GO Markets Olympic Schedule

Olympic Schedule
All times shown in AEDT
Opening Ceremony + first medals - Saturday, February 7
Opening Ceremony at breakfast time, then the first gold medal awarded in primetime on Saturday.
Harry Laidlaw represents Australia in the Men's Downhill, the Games' first Gold medal event, while cross-country skiers Rosie Fordham and Phoebe Cridland compete late Saturday night.
This same-day pairing of ceremony and first medals creates maximum media saturation, with a full weekend news cycle processing before Monday's ASX open.
Key events
- Opening Ceremony: 6:00 am AEDT
- Men's Downhill Final (first gold medal of the games): 9:30 pm AEDT
- Women's 10km + 10km Skiathlon: 11:00 pm AEDT
For traders
- NEC (Nine Entertainment): Double viewership event. Opening Ceremony 6:00 am Saturday, lines up for the peak morning TV audience. First medals at 9:30 pm are a primetime Saturday night.
- Italian equities (FTSE MIB): Historically underperform during domestic Olympics. Turin 2006 saw -2.1% during the Games.
- STLA (Stellantis): ESG headline risk if environmental groups target the ceremony.
- Apparel sponsor arbitrage: If a non-favourite wins Men's Downhill, their sponsor sees average +2.3% pop (PyeongChang 2018, Beijing 2022 data).
First medals continue - Sunday, February 8
The medal rush continues on Sunday as 19-year-old Valentino Guseli takes flight in Men's Snowboard Big Air, offering Australia an early podium chance in one of the Games' most visually spectacular events.
With the ceremony glow still fresh, Guseli's performance sets the tone for Australia's snowboard campaign and could influence Monday's ASX open positioning for action sports stocks.
Key events
- Men's Snowboard Big Air Final (Valentino Guseli): 5:30 am AEDT
- Women's Normal Hill Individual Final: 5:57 am AEDT
For traders
- MNST (Monster Beverage): Action sports sponsor, benefits from multi-athlete Olympic presence.
- FL (Foot Locker), ZUMZ (Zumiez): Youth retail action sports exposure. Guseli gold could create a temporary buzz.
Monday, February 9
A rare quiet day in Australia's Olympic calendar. No Australian medal events are scheduled, making this a pure observation day for traders.
Monitor how Guseli's weekend result is processed through Monday's ASX open, and position ahead of Tuesday's Coady showdown.
Tuesday, February 10
Tess Coady attempts to upgrade her 2022 bronze to gold in Women's Snowboard Big Air. The Tuesday morning timing offers traders a potential pre-market positioning window, though Coady's modest mainstream profile limits exposure compared to the moguls stars on the following day.
Key events
- Women's Snowboard Big Air Final: 5:30 am AEDT
For traders
- FL (Foot Locker), ZUMZ (Zumiez): Youth retail. Coady gold could create a temporary buzz.
- MNST (Monster Beverage): Less volatile, general action sports sponsor.
Wednesday, February 11
The calm before Jakara Anthony. No Australian events on Wednesday means traders spend the day positioning for the biggest moment of the Games: Anthony's moguls final just past midnight.
Moguls Finals - Thursday, February 12
The biggest moment of the Games for Australia arrives just after midnight on Wednesday with Jakara Anthony defending her Olympic crown in the Women's Moguls Final.
As the nation's brightest gold medal hope with 26 World Cup victories, Anthony's 12:15 am performance is the single highest-impact potential event for NEC and VFC stocks across the entire Olympic fortnight.
Matt Graham also chases his first Olympic gold at 10:15 pm Thursday night. Both events carry high NEC and VFC volatility potential.
Key events
- Women's Moguls Final (Jakara Anthony): 12:15 am AEDT
- Men's Moguls Final (Matt Graham): 10:15 pm AEDT
For traders
- NEC (Nine Entertainment): Monitor overnight results and viewership for Thursday open direction.
- VFC (VF Corp/North Face): Sponsors both athletes. A double medal could bring a larger impact.
- Defending champion volatility: An Anthony loss could create higher emotional swings.
- Social sentiment: Track Twitter/Google Trends Thursday morning to gauge the magnitude of Anthony’s performance.
Friday, February 13
Snowboard cross takes centre stage with two Australian medal chances bookending Friday's trading day.
Adam Lambert's overnight final sets the morning open, while Josie Baff's evening showdown takes the Aus prime time slot.
Key events
- Men's Snowboard Cross Finals: 12:56 am AEDT
- Women's Snowboard Cross Finals: 7:30 pm AEDT
For traders
- NEC sentiment gauge: If Lambert medals Fri morning and Graham medaled Thu night, it could create positive momentum.
Jakara Anthony competes - Saturday, February 14
Jakara Anthony goes for the double in Saturday night's Women's Dual Moguls Final.
If she claims gold Thursday and again here, the "double gold Jakara" narrative writes itself, offering geometric rather than linear media value.
Key events
- Women's Dual Moguls Final (Jakara Anthony): 9:46 pm AEDT
For traders
- NEC narrative power: "Double gold Jakara" could draw in more casual viewers.
- If Anthony silver/bronze Thu: Redemption story potential.
- Weekend timing: Saturday night result = Monday ASX gap.
- Format risk: Monitor qualifying rounds; if margins are greater than 1 second (blowouts), engagement could drop.
Sunday, February 15
A quiet Sunday offers redemption arcs and low-impact action. Brendan Corey's morning short track effort carries minimal stock relevance, while Matt Graham's late-night dual moguls final provides a second medal chance after Friday's traditional event.
Key events
- Short Track Speed Skating 1500m Final: 8:42 am AEDT
- Men's Dual Moguls Final: 9:46 pm AEDT
For traders
- VFC second opportunity: If Graham misses on Friday’s moguls, dual moguls redemption is possible.
Monday, February 16
Harry Laidlaw returns to the slopes for late Monday night slalom action, but alpine skiing holds minimal sway over Australian audiences.
This is a placeholder day in the trading calendar, with markets more focused on digesting the weekend moguls results and positioning for Tuesday's monobob final.
Key events
- Men's Slalom: 11:00 pm AEDT
Bree Walker competes - Tuesday, February 17
Bree Walker could make Olympic history as she competes in the Women's Monobob Final, chasing Australia's first-ever bobsleigh medal.
While the narrative is powerful, the commercial reality is that bobsleigh has no retail sponsor footprint, limiting direct stock plays.
Key events
- Pairs Figure Skating Final: 6:00 am AEDT
- Women's Monobob Final: 7:06 am AEDT
For traders
- NEC: Bobsleigh historically gets low ratings, but a Walker gold could provide value as an Australian-first.
Wednesday, February 18
Veterans Laura Peel and Danielle Scott take centre stage on Wednesday night in an event with proud Australian history (2 golds since 2002). However, aerials' niche appeal and late-night timing may limit market impact.
Key events
- Women's Aerials Final: 9:30 pm AEDT
- Women's Slalom Final: 11:30 pm AEDT
For traders
- NEC: If either medals, potential for a small sentiment boost.
- VFC exposure: Limited potential as aerials athletes are less commercially developed.
Thursday, February 19
Thursday night aerials effort is a low-impact finale event with minimal medal expectation for Australian Reilly Flanagan, and even less market relevance.
Scotty James' Saturday halfpipe showdown is the real conversation as the games begin winding down, although a medal run from Flanagan could create an underdog narrative.
Key events
- Men's Aerials Final: 9:30 pm AEDT
Friday, February 20
The final calm before Scotty James' legacy-defining Saturday. Set up day for James' 5:30 am Saturday halfpipe final, the Games' last major potential volatility event for an Aussie athlete.
Scotty James competes - Saturday, February 21
Scotty James' legacy moment arrives Saturday morning. He’s represented Australia at five Olympics, with two medals and zero golds. This is his final chance and brings with it the Games' most emotionally charged event, and the last major trading catalyst before Monday's Closing Ceremony.
Key events
- Men's Snowboard Halfpipe Final (Scotty James): 5:30 am AEDT
- SkiMo Mixed Relay: 11:30 pm AEDT
For traders
- NEC: Potential weekend delays on price discovery. If James gold Saturday.
- NKE (Nike): Potential halo effect from gold via action sports lift.
- Guseli wildcard: Valentino is also competing (his second event after Big Air, Feb 8). A dual medal could create narrative amplification.
Sunday, February 22
Sixteen-year-old Indra Brown takes the Sunday morning spotlight in Women's Freeski Halfpipe, facing off against favourite Eileen Gu (CHN) in what could become a Gen-Z brand inflection point.
Key events
- Women's Freeski Halfpipe Final (Indra Brown): 5:30 am AEDT
- Two-Woman Bobsleigh Final: 7:05 am
For traders
- Mon-Tue watch: Monitor which brands announce Brown signings.
- MILN (Global X Millennials ETF): Action sports retailers, social platforms exposure for Gen Z.
Closing Ceremony - Monday, February 23
The curtain falls on Milano Cortina 2026 with Monday morning's Closing Ceremony, and history says this is where euphoria dies.
- Men's Ice Hockey Final (NHL Superstars): 12:10 am AEDT
- Closing Ceremony: 6:00 am AEDT
Markets to watch:
- French Alps 2030 rotation: Closing features handover to France.
- Australian medal count: If greater than 4 medals (Beijing total), the government may increase 2030 winter sports funding.
- Ice Hockey Final: NHL players compete for the first time since 2014. Major US/Canada viewership means a potential CMCSA boost.

Global markets move into the new week with a number of potentially high-impact catalysts. Japan’s general election lands first on Sunday, followed by US inflation and labour market data that continue to shape interest-rate expectations.
- Japan election: Policy continuity and political stability are generally viewed as supportive for regional markets.
- US inflation and labour market: The consumer price index (CPI) and the Employment Situation report (nonfarm payrolls, NFP) are the immediate macro focal points for the week.
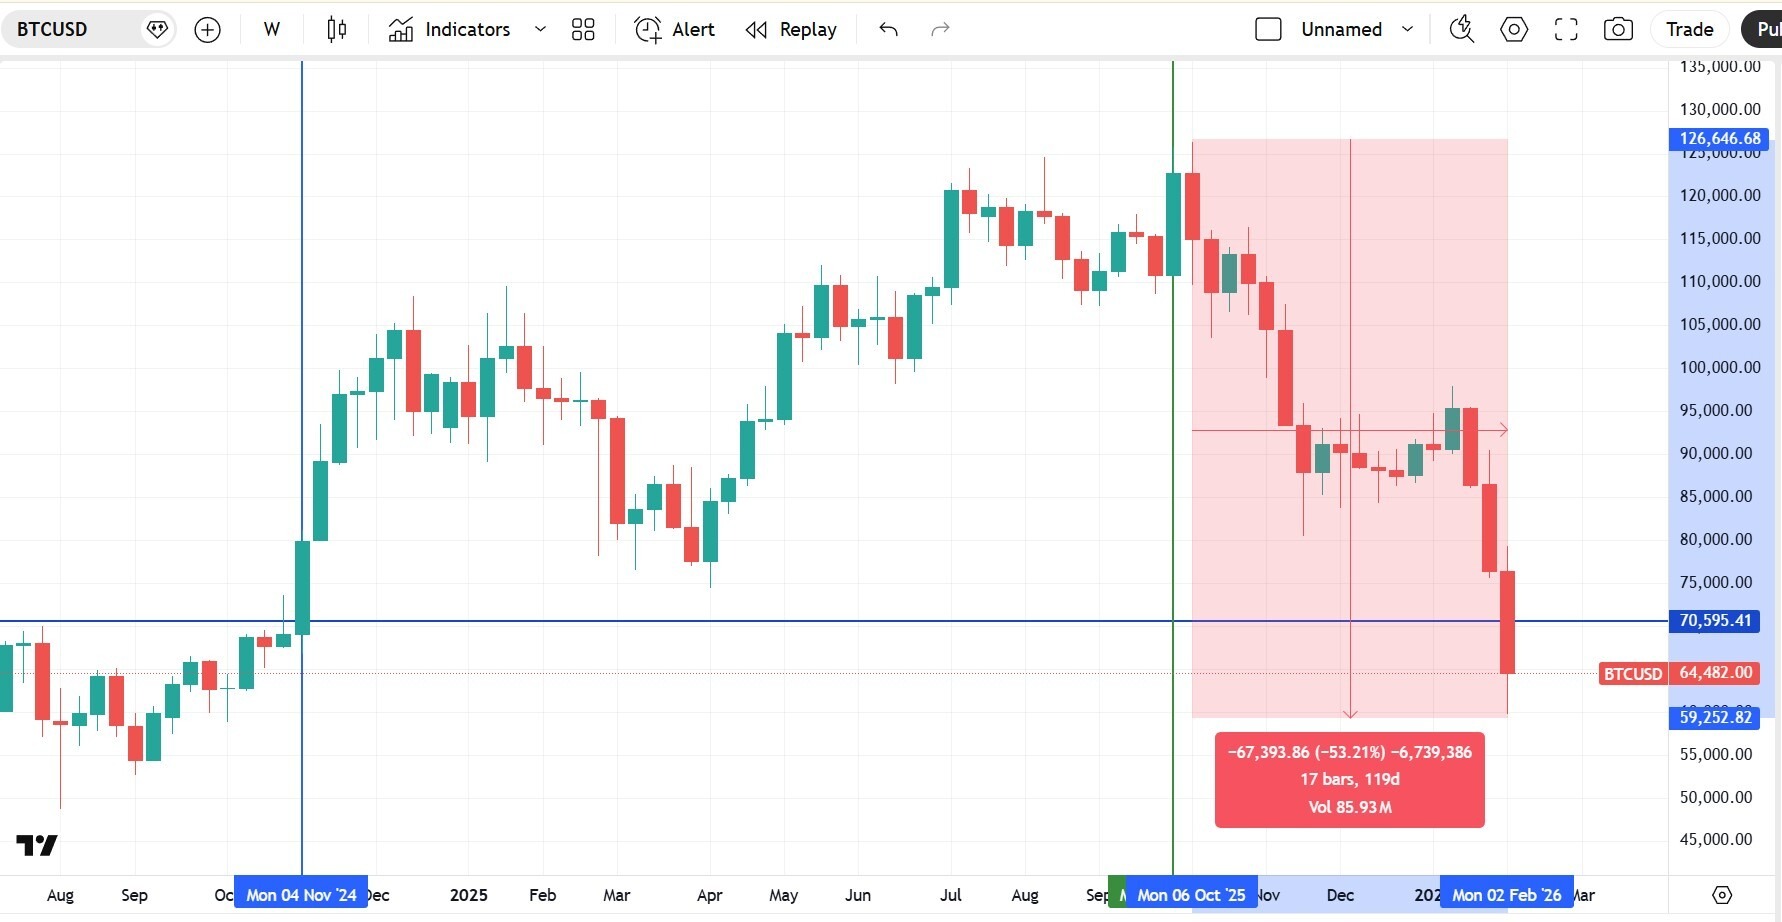
- Bitcoin risk gauge: Bitcoin is back near levels last seen in late 2024 and remains well below its October 2025 peak.
- Sector rotation watch: Technology has recently underperformed while value and defensive segments have stabilised, with earnings season continuing to influence flows.
Japan election
The general election in Japan is primarily viewed through the lens of policy certainty. Markets typically favour a clear outcome and continuity in fiscal and monetary settings.
Unexpected results or coalition uncertainty may increase short-term volatility in the JPY and regional indices at the start of the week.
Key dates
- General election (Japan): Sunday, 8 February
- Results through Asian trade on Monday
Market impact
- JPY may be sensitive to results uncertainty or potential changes in policy direction
- Asia equities may see early-week volatility until results are clear
US inflation and labour market
Inflation remains the most direct input into interest-rate expectations, while the monthly NFP report provides a broad read on employment conditions and wage pressures.
Treasury yields and the USD often react quickly to these releases, with knock-on effects across equities, gold and growth assets.
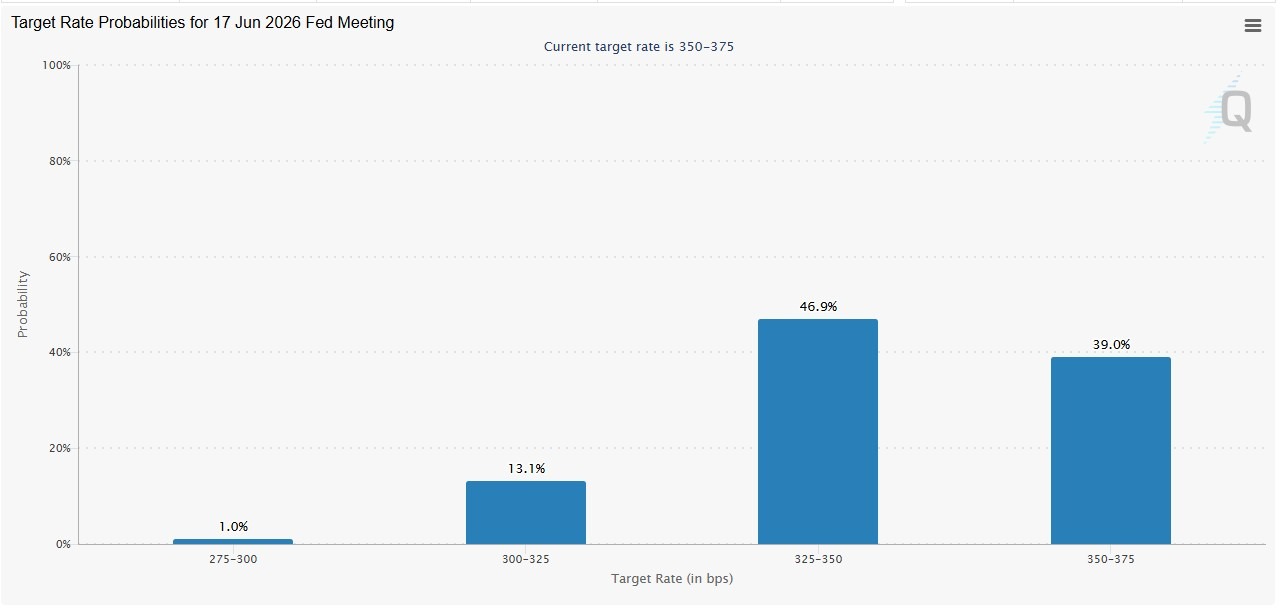
Current pricing indicates markets assign less than a 30% probability of a cut by the April meeting, with June meeting hike probabilities above 50%.
Key dates
- Employment Situation: Wednesday, 11 February 08:30 (ET) | Thursday, 12 February 00:30 (AEDT)
- CPI (January 2026): Friday, 13 February 08:30 (ET) Saturday, 14 February 00:30 (AEDT)
Market impact
- Yields often move first, followed by USD and then risk assets
- Expectations for rate-cut timing may adjust quickly
- Growth and technology shares remain more rate-sensitive
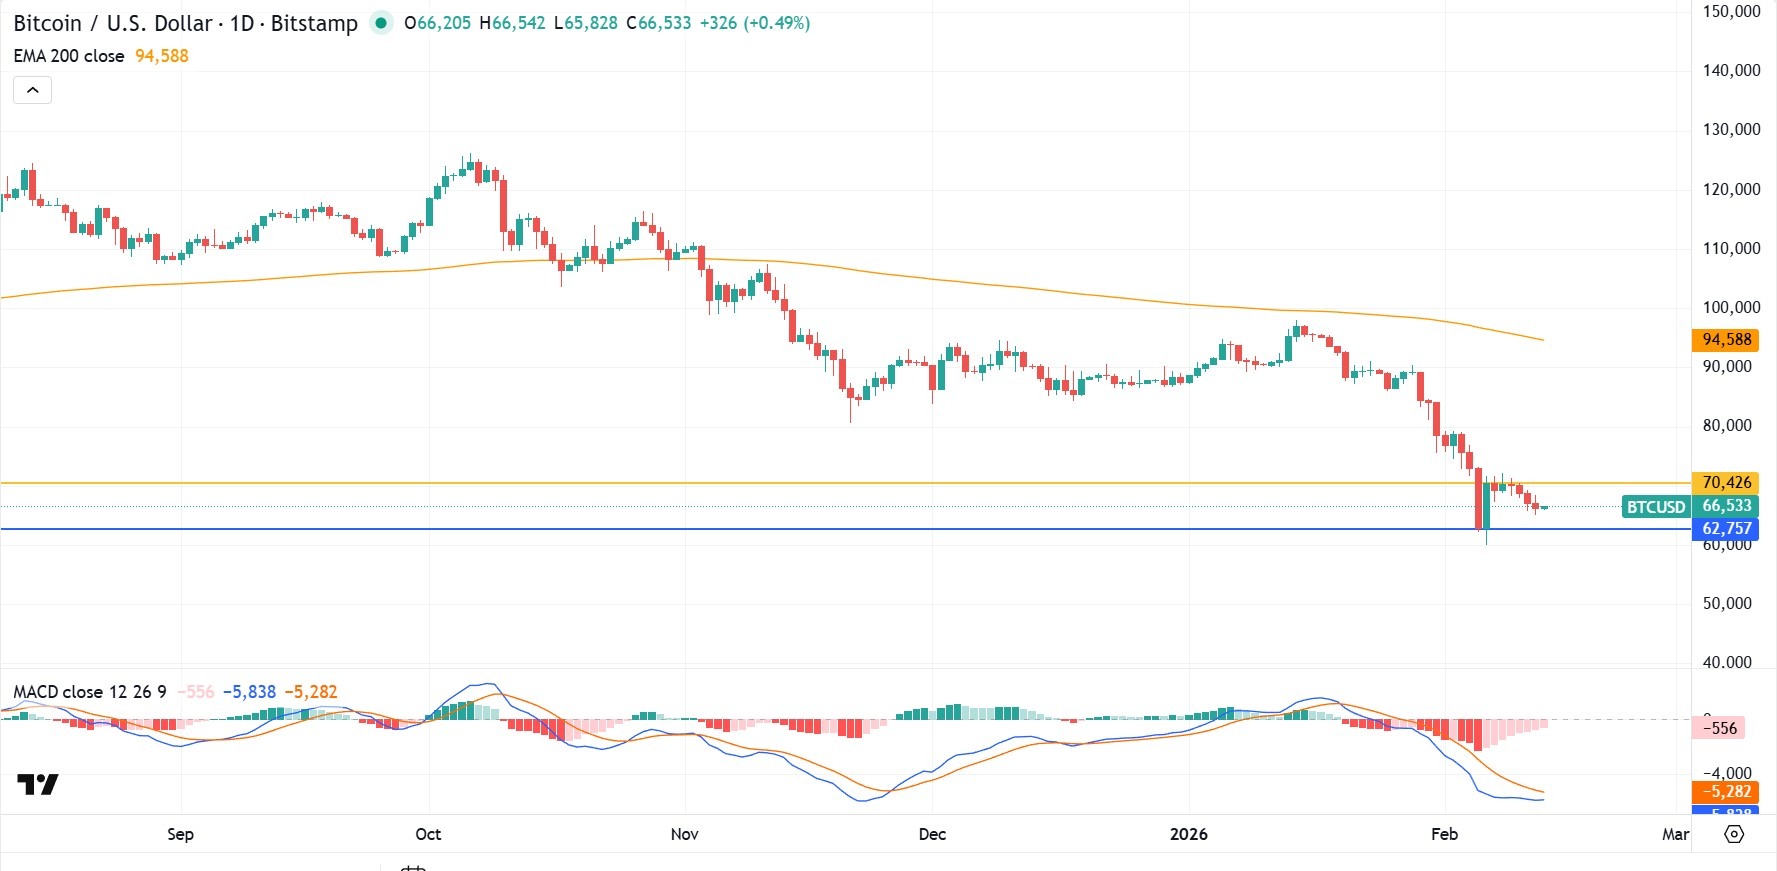
Bitcoin
Bitcoin has declined to levels last seen prior to the US elections in November 2024 and is close to 50% below its October 2025 peak.
While not a traditional macro indicator, crypto markets could be viewed as a real-time read on investor risk tolerance. Sustained weakness can coincide with more cautious positioning across higher-beta assets, including technology shares.
Market impact
- Softer crypto sentiment may coincide with reduced speculative flows
- Risk appetite may remain more selective
Sector rotation
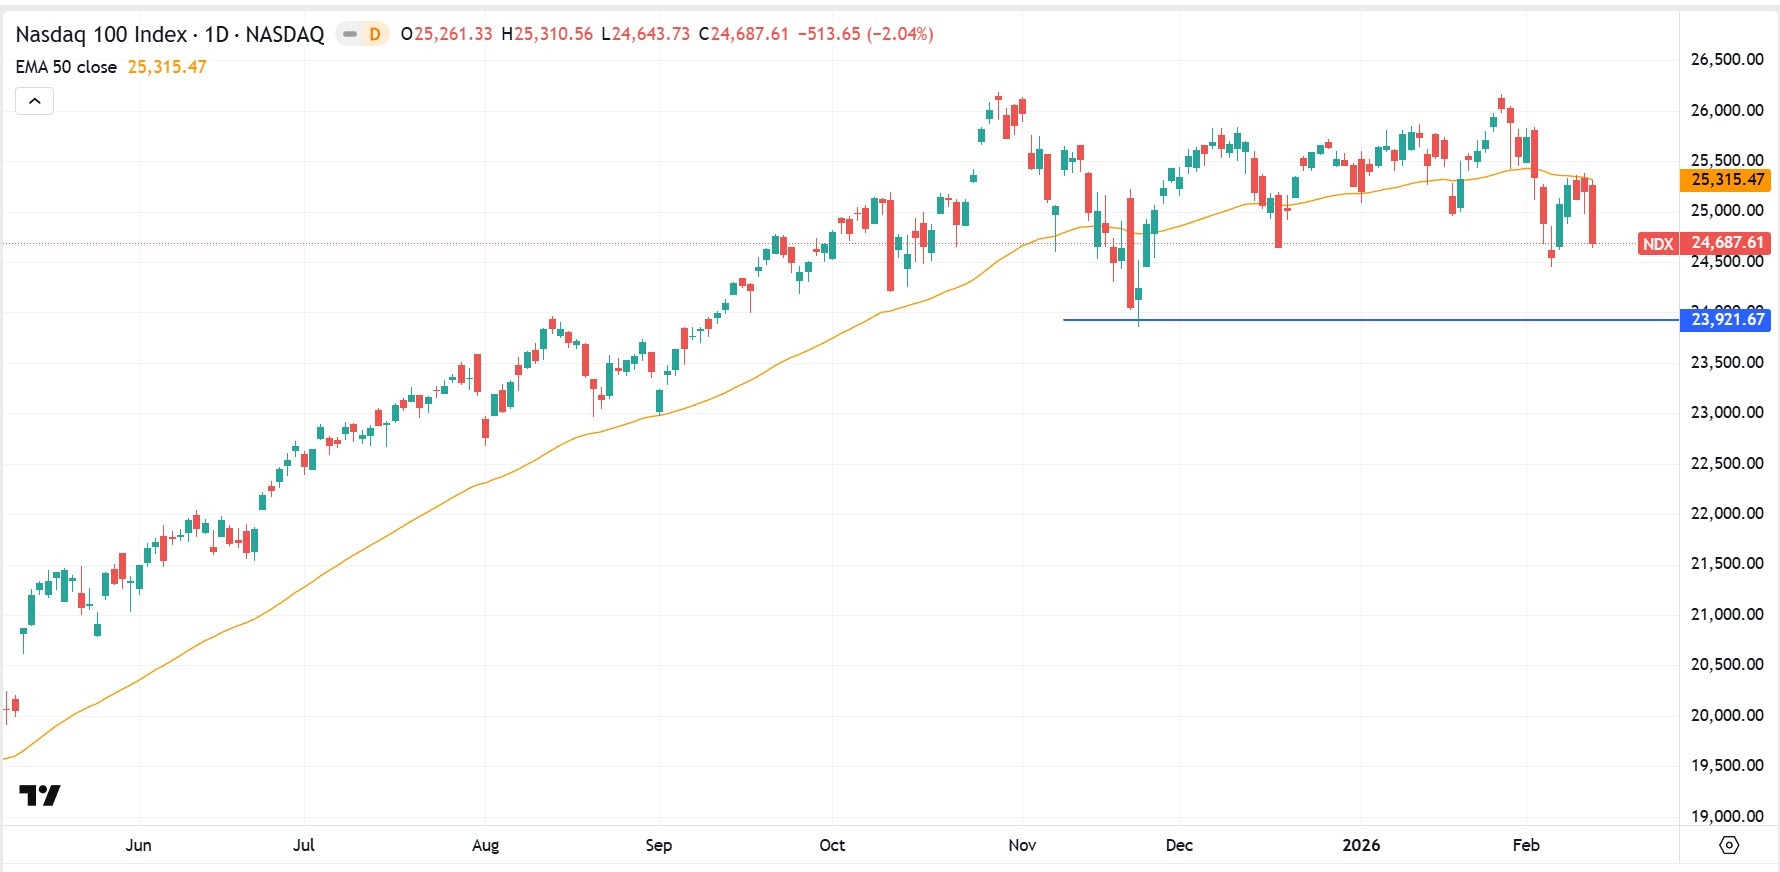
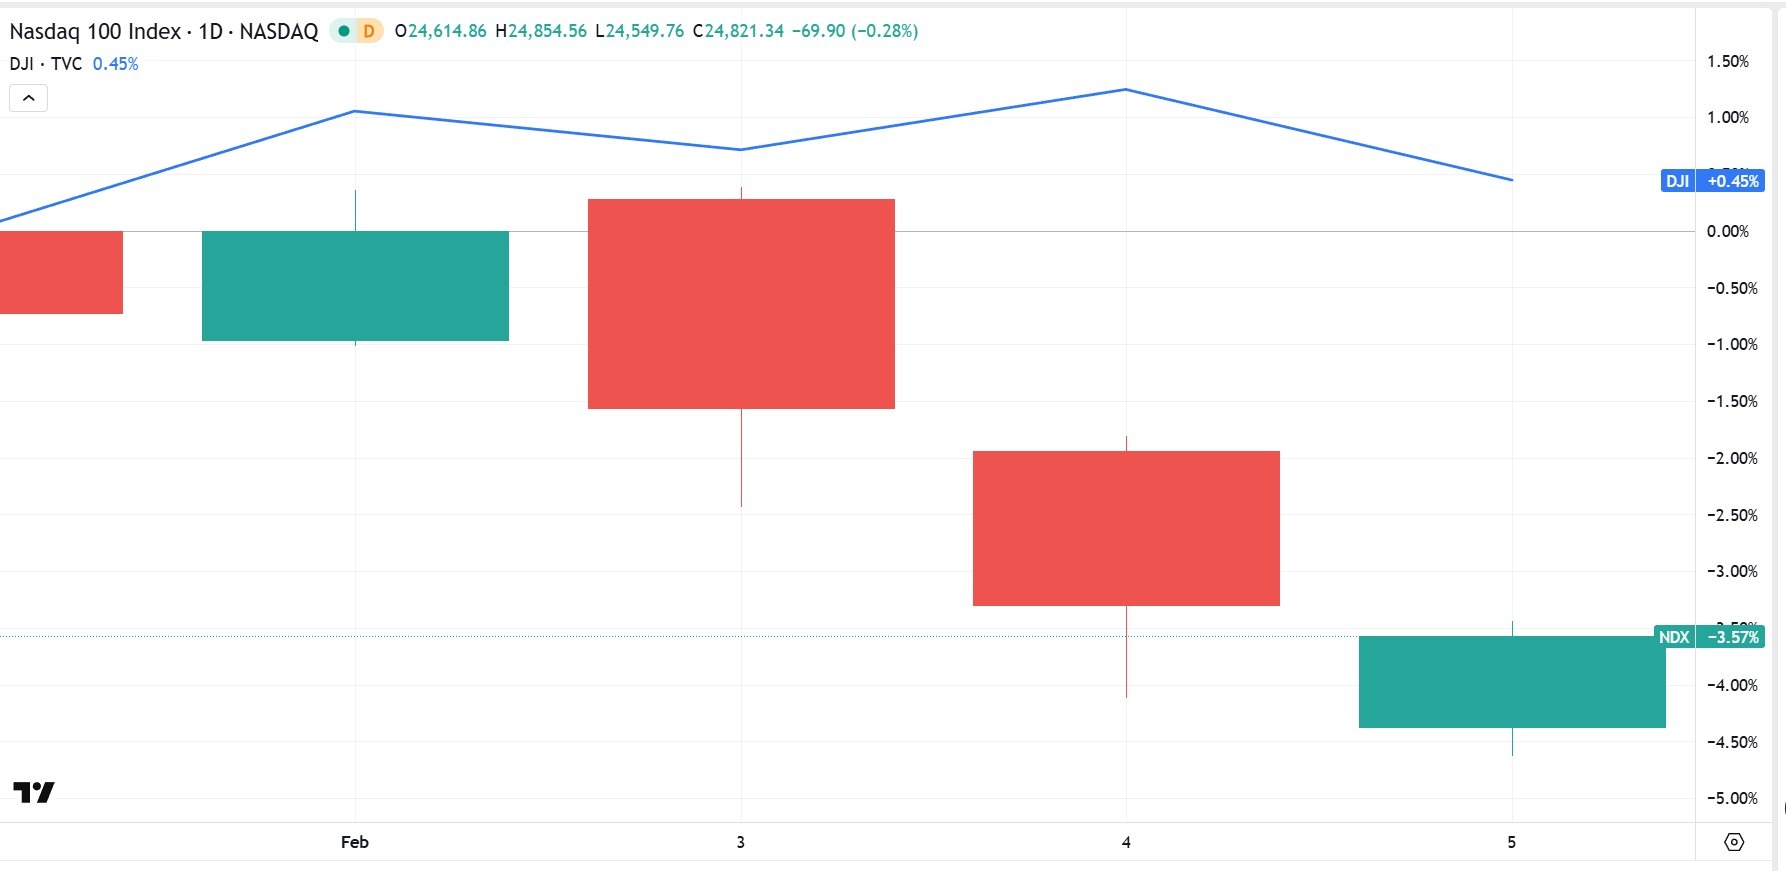
Over the past week, the Dow Jones Industrial Average has outperformed, trading just below neutral, while the Nasdaq-100 has declined more than 4%, reflecting sensitivity in large-cap technology to firmer yields.
What the move may reflect
- Rate-driven pressure on growth stocks
- Profit-taking after strong tech performance
- Earnings season favouring broader sector participation
- A generally more cautious tone across higher-beta assets
Markets typically look for sustained multi-week outperformance in financials, industrials or defensives before characterising the shift as structural rotation.
Market impact
- Tech remains more sensitive to yield moves
- Value and defensive sectors may see relative support
- Earnings guidance continues to influence leadership

February’s FX landscape is likely to be driven by inflation persistence, labour resilience, and central bank communications. With several high-impact data releases across the US, Europe, Japan and Australia, near-term moves may be more event-driven and repricing-led, rather than trend-led.
Quick facts
- USD remains the key reference point, with US data driving repricing in yields and the broader FX market.
- EUR sensitivity remains high around European Central Bank (ECB) messaging and incoming inflation and activity signals.
- JPY remains tightly linked to domestic data and Bank of Japan (BOJ) communication, with USD/JPY often reacting sharply to shifts in yield expectations.
- AUD remains policy sensitive, with domestic inflation and labour data likely to matter most, alongside global risk tone and metals.
US dollar (USD)
Key events
- Nonfarm payrolls (NFP) and unemployment: 8:30 am, 11 February (ET) | 12:30 am, 12 February (AEDT)
- Consumer Price Index (CPI), headline and core: 8:30 am, 13 February (ET) | 12:30, 13 February (AEDT)
- Personal income and outlays (includes the PCE price index): 8:30, 20 February (ET) | 12:30, 21 February (AEDT)
What to watch
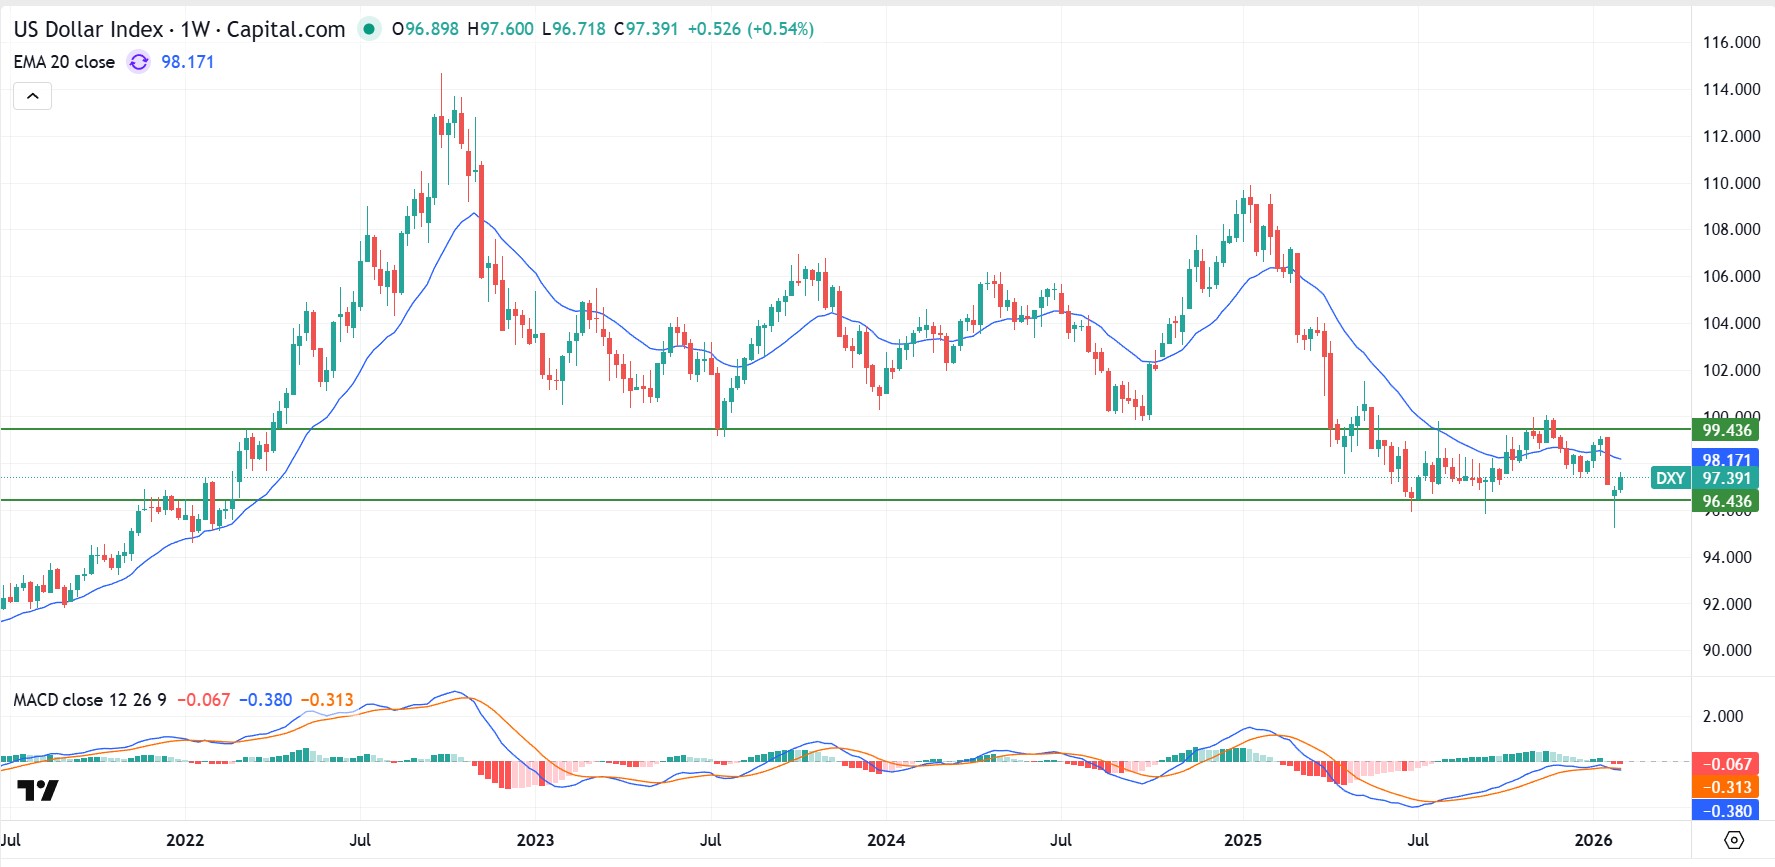
The USD is likely to remain primarily driven by shifts in inflation and labour data and their implications for Federal Reserve rate expectations. Recent headlines surrounding Federal Reserve independence have also added volatility to USD positioning.
Stronger inflation or labour resilience is often associated with firmer USD support via higher yield expectations. Softer outcomes could reduce rate support and allow pairs like EUR/USD and AUD/USD to stabilise.
Key chart: US dollar index (DXY) weekly chart
Euro (EUR)
Key events
- ECB policy decision: 12:15 am, 6 February (AEDT)
- ECB press conference: 12:45 am, 6 February (AEDT)
- ECB flash estimates for GDP and employment: 8:00 pm, 13 February (AEDT)
What to watch
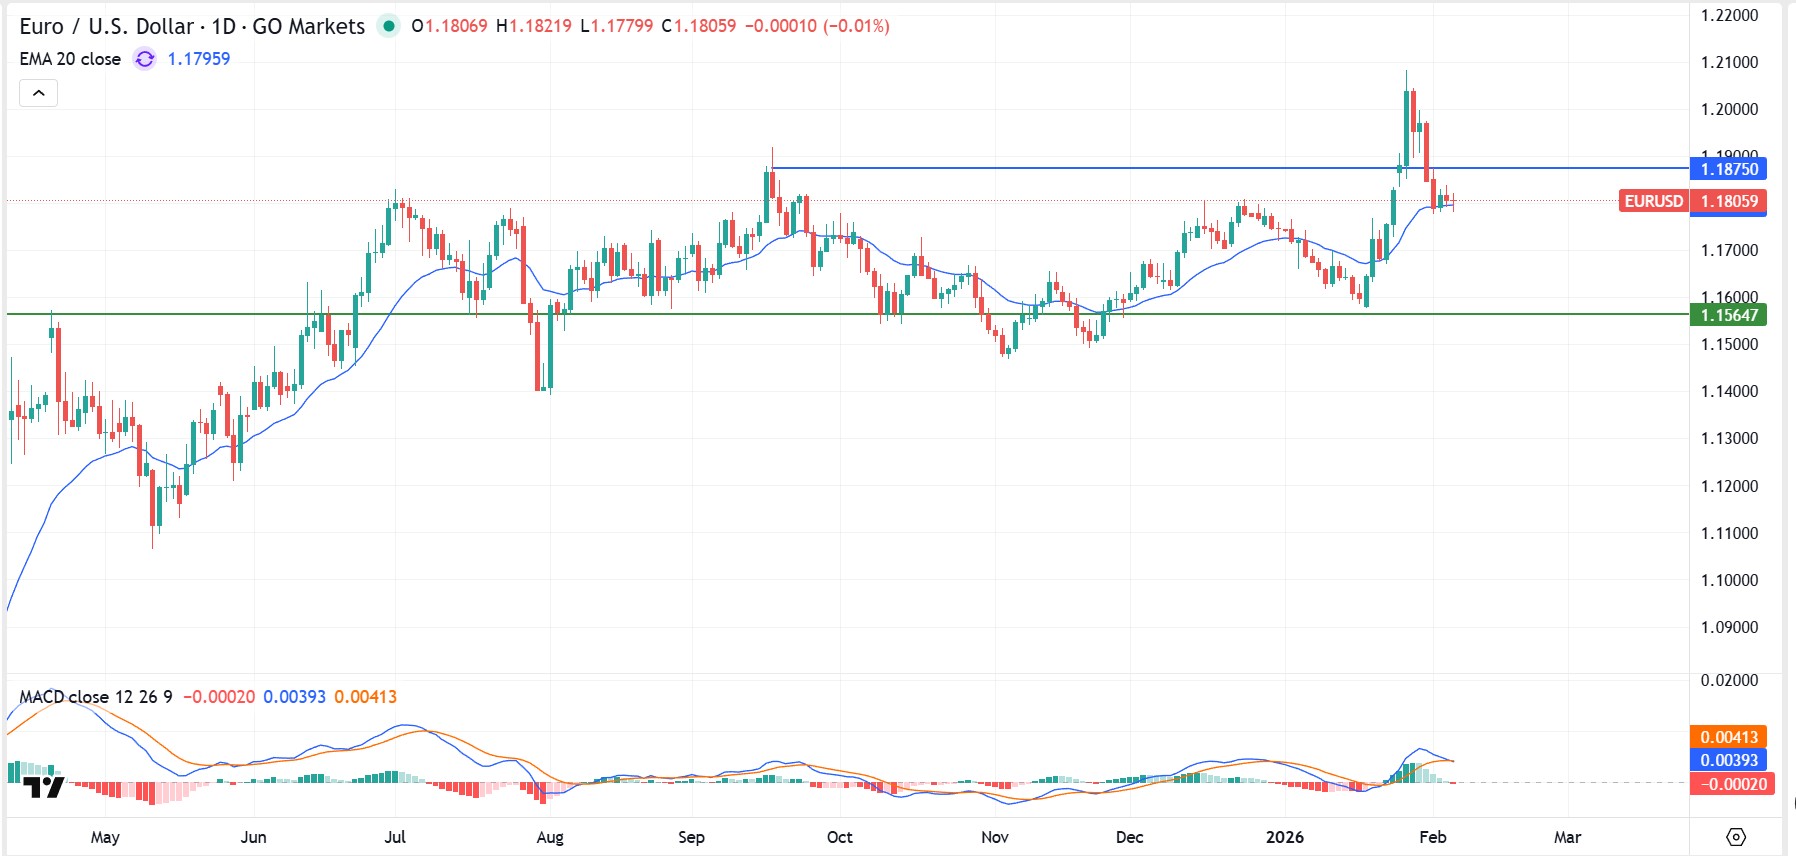
EUR direction remains linked to whether the ECB can maintain its stance without a material deterioration in activity, or whether inflation and growth data pull forward easing expectations.
Resilient growth and firm inflation could support the “higher for longer” pricing bias. Weaker growth or softer inflation could weigh on the currency, particularly if they bring forward easing expectations.
Key chart: EUR/USD weekly chart
Japanese yen (JPY)
Key events
- Japan preliminary GDP (Q4 2025, first preliminary): 6:50 pm, 15 February (ET) | 10:50 am, 16 February (AEDT)
- National CPI (Japan): 20 February (Japan)
What to watch
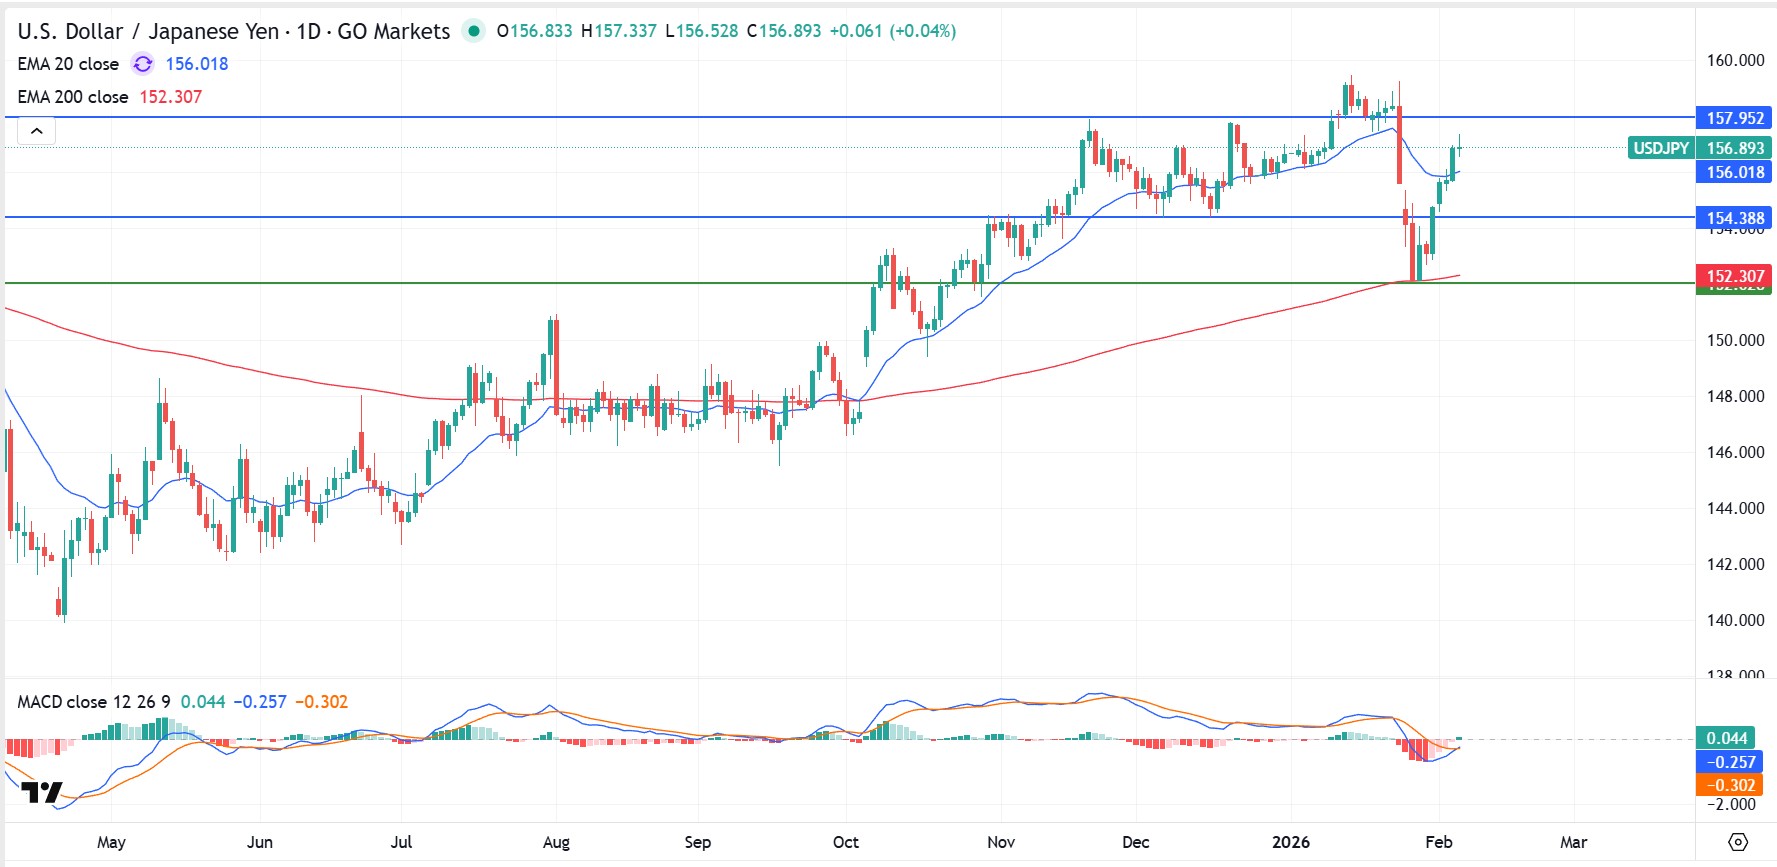
JPY remains sensitive to domestic yield shifts and BOJ communication. Even modest adjustments to policy expectations could generate outsized moves in USD/JPY.
Firm growth or inflation outcomes could support JPY via higher domestic yields and shifting BOJ expectations. Softer outcomes or cautious policy messaging could keep USD/JPY supported.
Key chart: USD/JPY daily chart
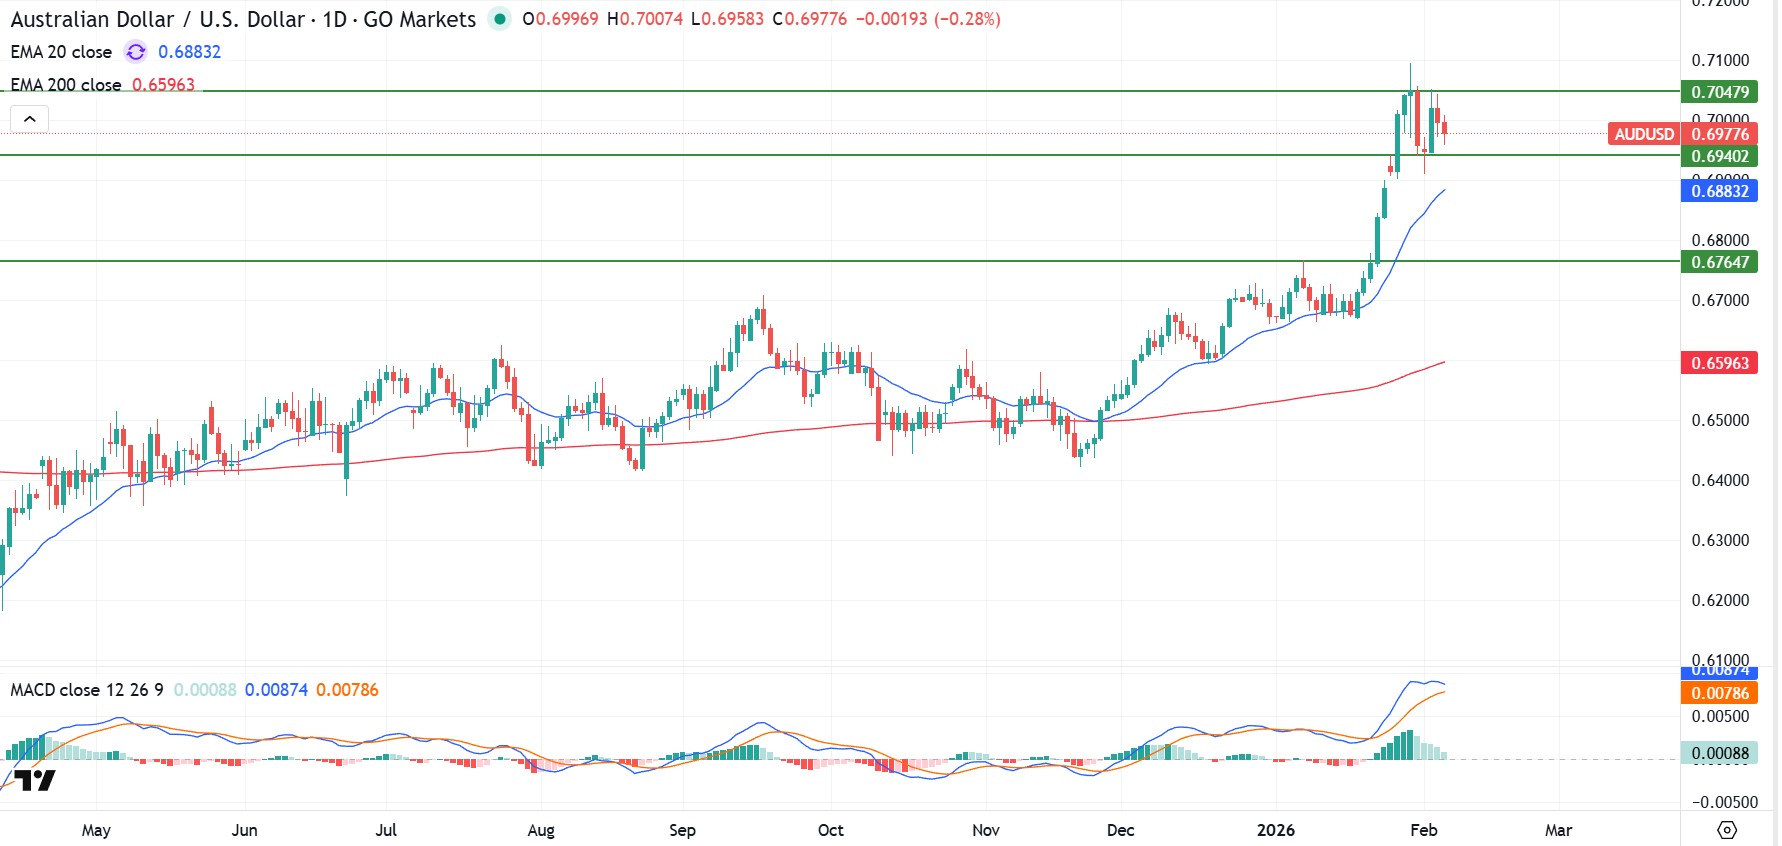
Australian dollar (AUD)
Key events
- RBA minutes: 11:30 am, 17 February (AEDT)
- Wage Price Index: 11:30 am, 18 February (AEDT)
- Labour Force Survey: 11:30 am, 19 February (AEDT)
- Consumer Price Index (CPI): 11:30 am, 25 February (AEDT)
What to watch
AUD remains sensitive to policy, responding quickly to domestic inflation and labour data, as well as global risk sentiment and its impact on metal pricing.
Persistent wages or inflation pressures could support AUD via firmer policy expectations. Softening data could reduce rate support and weigh on AUD performance, particularly versus USD and JPY.
Key chart: EUR/AUD daily chart