Bid-Ask Spread explained: What Traders Need to Know
Mike Smith
14/9/2023
•
0 min read
Share this post
Copy URL
The bid-ask spread is the difference between the highest price a buyer is willing to pay for an asset (the bid) and the lowest price a seller is willing to accept to sell it (the ask or offer). This spread is a fundamental element of market liquidity and represents the transaction cost that traders need to consider when entering and exiting positions. For example, if there is a spread of 1 pip between buyers and sellers, this represented the cost of trade taken.
It is worth pointing out at this stage the much is made of the “spread” in comparison between the value that one broker may offer versus another. However, there are far more influential factors that determine the success or otherwise of trading such as determining high probability entries, effective risk management and appropriate profit taking exits. This is particularly the case for retail investors who trade smaller contract sizes, as opposed to institutional traders, who often trade much larger sizes of trade ad so small differences in spread will have more impact.
Nevertheless, some understanding of the bid/ask spread, and how this may alter at various points during the trading day is important. Factors influencing bid-ask spread Although there are more, we have focused on the top eight factors we think are of not only most influential but have trader relevance. Asset Liquidity: A highly liquid market usually has a smaller bid-ask spread.
When there are more market participants interested in trading a specific asset, there are more bids and asks available, which narrows the spread. In essence, the abundance of buyers and sellers in a liquid market reduces the difference between the buying and selling prices. Trading Volume: Similar to liquidity, higher trading volume often leads to a narrower spread.
Increased trading activity means more frequent transactions, which can reduce the spread. Active markets tend to have more competitive pricing due to the large number of transactions taking place. Asset Volatility: Increased volatility usually results in a wider spread.
When an asset's price exhibits rapid and unpredictable movements, market makers and traders face higher risk. To compensate for this risk, they set wider spreads. This is often observed when major economic data or news is released, causing abrupt market movements.
Market Hours: Spreads might be wider during market open and close due to uncertainty and reduced liquidity. This phenomenon is often seen toward the end of market hours and the beginning of new trading sessions. Additionally, some assets may have wider spreads when traded outside their primary market hours, such as futures contracts associated with indexes that are closed during specific times.
Asset Popularity: Well-known assets usually have tighter spreads compared to less popular instruments. For example, in the Forex market, currency pairs are categorised by liquidity. Major pairs like EUR/USD tend to have tighter spreads because they are highly popular among traders.
Exotic pairs, on the other hand, have wider spreads due to their lower trading activity e.g., US Dollar/Polish Zloty (USDPLN) Regulatory Environment: The level of regulation in a market can influence the spread. Forex markets, for instance, are less regulated compared to stock markets with centralized exchanges. This can lead to comparatively wider spreads in forex trading, as there is no central authority to standardize pricing.
Transaction Size: Large orders can impact the spread, making it wider, especially in less liquid markets. When a trader places a substantial order, it can temporarily disrupt the supply and demand balance in the market, causing a wider spread until the order is executed. Technological Factors: Faster trading systems and networks can lead to tighter spreads.
Advanced technology allows for more efficient matching of buyers and sellers, reducing the spread. High-frequency trading and electronic communication networks (ECNs) contribute to this efficiency by facilitating quicker trade executions. Other factors to consider with the bid-ask spread Slippage and Spread: A significant aspect to consider in trading is slippage, which refers to the difference between the expected price of a trade and the actual price at which it is executed.
A wider spread, indicating a larger gap between the bid and ask prices, can increase the risk of slippage. This happens because, in volatile markets or with wider spreads, it becomes more challenging to execute trades at the precise desired price. Traders may experience slippage when their orders are filled at a different, often less favourable, price due to market fluctuations.
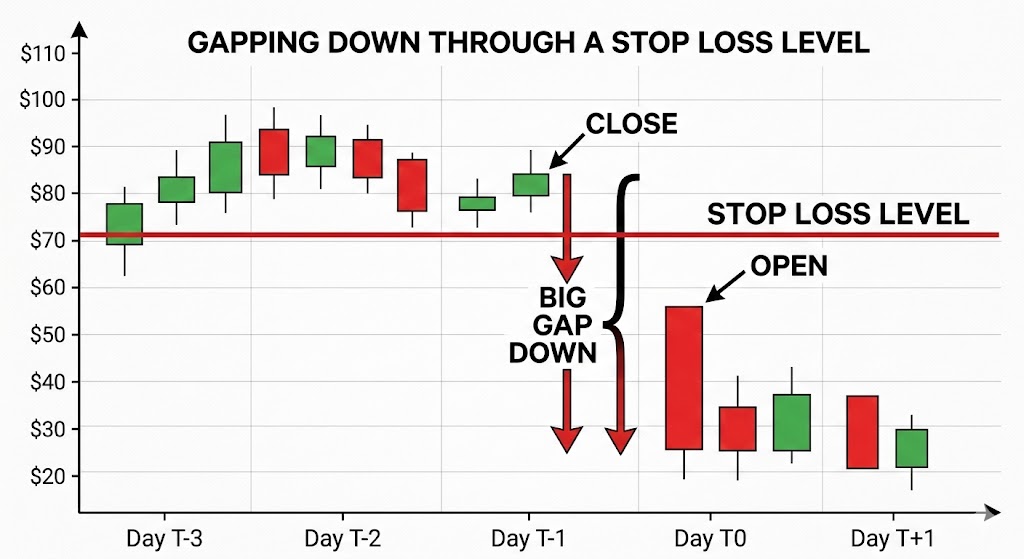
Therefore, traders should be acutely aware of the potential impact of spread size on the likelihood and extent of slippage, especially when trading in fast-moving markets. Stop Placement and Spread: As spreads widen, it's crucial to consider their influence on stop-loss orders. Stop-loss orders are designed to limit potential losses by automatically triggering a trade closure when the asset's price reaches a specified level.
However, an increasingly wider spread introduces the possibility that the spread alone could trigger the stop-loss order. This is particularly relevant when the stop level is set close to the current market price or price has moved towards the stop. Traders need to strike a balance between setting stop levels that provide adequate protection and avoiding premature triggering due to spread fluctuations.
Having a good understanding of the typical range of spreads for the assets they are trading can help traders make more informed decisions when placing stop orders to manage risk effectively. Alternative accounts and differing spreads Some brokers offer different types of platforms that may offer tighter than the spread associated with a standard account. Often, there is a small brokerage payable for such accounts and the trader must decide which is the best option for them.
If you are interested in looking at different account types with different spread at GO Markets then drop our support team an email at [email protected] and we would be delighted to walk you through the options that are available to you. Summary Understanding the bid-ask spread is important for traders as it has the potential to affect many aspects of trading including costs, strategy, risk management, and perhaps even market interpretation. Although there are significantly more influential factors on your potential trading outcomes than the width of the spread, if treating your trading as a business, which arguably is the right approach to have, then knowing about such factors and their impact would seem prudent.
By
Mike Smith
Mike Smith (MSc, PGdipEd)
Client Education and Training
Os artigos são elaborados por analistas e colaboradores da GO Markets e baseiam-se na sua análise independente ou em experiências pessoais. As opiniões, pontos de vista ou estilos de negociação expressos são próprios dos autores e não devem ser considerados como representativos ou partilhados pela GO Markets. Qualquer conselho fornecido é de natureza “geral” e não leva em conta os seus objetivos, situação financeira ou necessidades pessoais. Antes de agir com base em qualquer conselho, considere se ele é apropriado para os seus objetivos, situação financeira e necessidades. Se o conselho estiver relacionado à aquisição de um produto financeiro específico, você deve obter a nossa Declaração de Divulgação (Disclosure Statement - DS) e outros documentos legais disponíveis no nosso site antes de tomar qualquer decisão.
Every trader has had that moment where a seemingly perfect trade goes astray.
You see a clean chart on the screen, showing a textbook candle pattern; it seems as though the market planets have aligned, and so you enthusiastically jump into your trade.
But before you even have time to indulge in a little self-praise at a job well done, the market does the opposite of what you expected, and your stop loss is triggered.
This common scenario, which we have all unfortunately experienced, raises the question: What separates these “almost” trades from the truly higher-probability setups?
The State of Alignment
A high-probability setup isn’t necessarily a single signal or chart pattern. It is the coming together of several factors in a way that can potentially increase the likelihood of a successful trade.
When combined, six interconnected layers can come together to form the full “anatomy” of a higher-probability trading setup:
Context
Structure
Confluence
Timing
Management
Psychology
When more of these factors are in place, the greater the (potential) probability your trade will behave as expected.
Market Context
When we explore market context, we are looking at the underlying background conditions that may help some trading ideas thrive, and contribute to others failing.
Regime Awareness
Every trading strategy you choose to create has a natural set of market circumstances that could be an optimum trading environment for that particular trading approach.
For example:
Trending regimes may favour momentum or breakout setups.
Ranging regimes may suit mean-reversion or bounce systems.
High-volatility regimes create opportunity but demand wider stops and quicker management.
Investing time considering the underlying market regime may help avoid the temptation to force a trending system into a sideways market.
Simply looking at the slope of a 50-period moving average or the width of a Bollinger Band can suggest what type of market is currently in play.
Sentiment Alignment
If risk sentiment shifts towards a specific (or a group) of related assets, the technical picture is more likely to change to match that.
For example, if the USD index is broadly strengthening as an underlying move, then looking for long trades in EURUSD setups may end up fighting headwinds.
Setting yourself some simple rules can help, as trading against a potential tidal wave of opposite price change in a related asset is not usually a strong foundation on which to base a trading decision.
Key Reference Zones
Context also means the location of the current price relative to levels or previous landmarks.
Some examples include:
Weekly highs/lows
Prior session ranges, e.g. the Asian high and low as we move into the European session
Major “round” psychological numbers (e.g., 1.10, 1000)
A long trading setup into these areas of market importance may result in an overhead resistance, or a short trade into a potential area of support may reduce the probability of a continuation of that price move before the trade even starts.
Market Structure
Structure is the visual rhythm of price that you may see on the chart. It involves the sequences of trader impulses and corrections that end up defining the overall direction and the likelihood of continuation:
Uptrend: Higher highs (HH) and higher lows (HL)
Downtrend: Lower highs (LH) and lower lows (LL)
Transition: Break in structure often followed by a retest of previous levels.
A pullback in an uptrend followed by renewed buying pressure over a previous price swing high point may well constitute a higher-probability buy than a random candle pattern in the middle of nowhere.
Compression and Expansion
Markets move through cycles of energy build-up and release. It is a reflection of the repositioning of asset holdings, subtle institutional accumulation, or a response to new information, and may all result in different, albeit temporary, broad price scenarios.
Compression: Evidenced by a tightening range, declining ATR, smaller candles, and so suggesting a period of indecision or exhaustion of a previous price move,
Expansion: Evidenced by a sudden breakout, larger candle bodies, and a volume spike, is suggestive of a move that is now underway.
A breakout that clears a liquidity zone often runs further, as ‘trapped’ traders may further fuel the move as they scramble to reposition.
A setup aligned with such liquidity flows may carry a higher probability than one trading directly into it.
Confluence
Confluence is the art of layering independent evidence to create a whole story. Think of it as a type of “market forensics” — each piece of confirmation evidence may offer a “better hand’ or further positive alignment for your idea.
There are three noteworthy types of confluence:
Technical Confluence – Multiple technical tools agree with your trading idea:
Moving average alignment (e.g., 20 EMA above 50 EMA) for a long trade
A Fibonacci retracement level is lining up with a previously identified support level.
Momentum is increasing on indicators such as the MACD.
Multi-Timeframe Confluence – Where a lower timeframe setup is consistent with a higher timeframe trend. If you have alignment of breakout evidence across multiple timeframes, any move will often be strengthened by different traders trading on different timeframes, all jumping into new trades together.
3. Volume Confluence – Any directional move, if supported by increasing volume, suggests higher levels of market participation. Whereas falling volume may be indicative of a lesser market enthusiasm for a particular price move.
Confluence is not about clutter on your chart. Adding indicators, e.g., three oscillators showing the same thing, may make your chart look like a work of art, but it offers little to your trading decision-making and may dilute action clarity.
Think of it this way: Confluence comes from having different dimensions of evidence and seeing them align. Price, time, momentum, and participation (which is evidenced by volume) can all contribute.
Timing & Execution
An alignment in context and structure can still fail to produce a desired outcome if your timing is not as it should be. Execution is where higher probability traders may separate themselves from hopeful ones.
Entry Timing
Confirmation: Wait for the candle to close beyond the structure or level. Avoid the temptation to try to jump in early on a premature breakout wick before the candle is mature.
Retests: If the price has retested and respected a breakout level, it may filter out some false breaks that we will often see.
Then act: Be patient for the setup to complete. Talking yourself out of a trade for the sake of just one more candle” confirmation may, over time, erode potential as you are repeatedly late into trades.
Session & Liquidity Windows
Markets breathe differently throughout the day as one session rolls into another. Each session's characteristics may suit different strategies.
For example:
London Open: Often has a volatility surge; Range breaks may work well.
New York Overlap: Often, we will see some continuation or reversal of morning trends.
Asian Session: A quieter session where mean-reversion or range trading approaches may do well
Trade Management
Managing the position well after entry can turn probability into realised profit, or if mismanaged, can result in losses compounding or giving back unrealised profit to the market.
Pre-defined Invalidation
Asking yourself before entry: “What would the market have to do to prove me wrong?” could be an approach worth trying.
This facilitates stops to be placed logically rather than emotionally. If a trade idea moves against your original thinking, based on a change to a state of unalignment, then considering exit would seem logical.
Scaling & Partial Exits
High-probability trade entries will still benefit from dynamic exit approaches that may involve partial position closes and adaptive trailing of your initial stop.
Trader Psychology
One of the most important and overlooked components of a higher-probability setup is you.
It is you who makes the choices to adopt these practices, and you who must battle the common trading “demons” of fear, impatience, and distorted expectation.
Let's be real, higher-probability trades are less common than many may lead you to believe.
Many traders destroy their potential to develop any trading edge by taking frequent low-probability setups out of a desire to be “in the market.”
It can take strength to be inactive for periods of time and exercise that patience for every box to be ticked in your plan before acting.
Measure “You” performance
Each trade you take becomes data and can provide invaluable feedback. You can only make a judgment of a planned strategy if you have followed it to the letter.
Discipline in execution can be your greatest ally or enemy in determining whether you ultimately achieve positive trading outcomes.
Bringing It All Together – The Setup Blueprint
Final Thoughts
Higher-probability setups are not found but are constructed methodically.
A trader who understands the “higher-probability anatomy” is less likely to chase trades or feel the need to always be in the market. They will see merit in ticking all the right boxes and then taking decisive action when it is time to do so.
It is now up to you to review what you have in place now, identify gaps that may exist, and commit to taking action!
One of the most impactful books I’ve ever read is “The 7 Habits of Highly Effective People: Powerful Lessons in Personal Change” by Stephen Covey.
When it was first published in 1989, it quickly became one of the most influential works in business and personal development literature, and retained its place on bestseller lists for the next couple of decades.
The compelling, comprehensive, and structured framework for personal growth presented in the book has undoubtedly inspired many to rethink how they organise their lives and priorities, both professionally and personally.
Although its lessons were originally designed for self-improvement and positive structured growth, the underlying principles are universal, making them easily transferable to many areas of life, including trading.
In this article, you will explore how each of Covey’s seven original habits can be reframed within a trading context, in an attempt to offer a structure that may help guide you to becoming the best trader you can be.
1. Be Proactive
Being proactive means recognising that we have the power to choose our responses and to shape outcomes through appropriate preparation with subsequent planned reactions.
In a Trading Context:
For traders, this means anticipating potential problems before they arise and putting measures in place to better mitigate risk.
Rather than waiting for issues to unfold, the proactive trader identifies potential areas of concern and ensures that they have access to the right tools, resources, and people to prepare effectively, whatever the market may throw at them.
What This Means for You:
Being proactive may involve seeking out quality education and services, maintaining access to accurate and timely market information, continually assessing risk and opportunity, and having systems to manage those risks within defined limits.
Consequences of Non-Action:
Inadequate preparation and a lack of defined systems often lead to poor trading decisions and less-than-desired outcomes.
Failing to assess risk properly can result in significant and often avoidable losses.
By contrast, a proactive approach builds resilience and confidence, ensuring that when challenges arise, your response is measured and less emotionally driven by what is happening on the screen in front of you.
2. Begin with the End in Mind
Covey's second habit is about defining purpose. It suggests that effective people are more likely to achieve what is possible if they start with a clear understanding of their destination, so every action aligns with that ultimate vision.
In a Trading Context:
Ask yourself: What is my true purpose for trading?
Many traders may instinctively answer “to make money,” but money is surely only a vehicle to achieve something else in your world for you and those you care about, not a purpose per se.
You need to clarify what trading success really means for you.
Is it a greater degree of financial independence through increased income or capital growth, the freedom of having more time, achieving a personal challenge of becoming an effective trader, or a combination of any of these?
What This Means to You:
Try framing your purpose as, “I must become a better trader so that I can…” and complete a list with your genuine reasons for tackling the market and its challenges.
This helps you establish meaningful short-term development goals that keep you moving toward your vision. Keep that purpose visible, as a note near your trading screen that reminds you why you are doing this.
Consequences of Non-Action:
Traders with a clearly defined purpose are more likely to stay disciplined and consistent.
Those without one often drift, chasing short-term gains without direction. There is ample evidence that formalising your development in whatever context through goal setting can significantly increase the likelihood of success. Why would trading be any different?
Surely the bottom-line question to ask yourself is, “Am I willing to risk my potential by trading without purpose?”
3. Put First Things First
This habit is about time management and prioritisation. This involves focusing your efforts and energy on what truly matters. As part of the exploration of this concept, Covey emphasised distinguishing between what is important and what is merely urgent.
In a Trading Context:
Trading demands commitment, learning, and reflection.
It is not just about screen time but about using that time effectively.
Managing activities to ensure your effort is spent wisely on planning, measuring, journaling and performance evaluation, and refining systems, accordingly, are all critical to sustaining both improvements in results and balance.
What This Means to You:
Traders often believe they need to spend more time trading when what they really need is to focus on better time allocation.
It is logical to suggest that prioritising activities that can often contribute directly to improvement, such as system testing, reviewing performance, analysing results, and refining your strategy, is worthwhile.
These high-value tasks can help traders focus their time more deliberately and systematically.
Consequences of Non-Action:
If you fail to control your trading time effectively, you will be more likely to spend much of it on low-impact activities that produce little progress.
Over time, this not only hurts your results but also reduces the real “hourly value” of your trading effort.
In business terms, and of course, you should be treating your trading as you would any business activity; poor prioritisation can inflate your costs and diminish your potential trading outcomes.
4. Think Win: Win
Covey's fourth habit encouraged an attitude of mutual benefit, where seeking solutions that facilitate positive outcomes for all parties.
In a Trading Context:
In trading, this concept must be adapted to suggest that developing a mindset that recognises every well-executed plan as a win, even when an individual trade results in a loss.
Some trading ideas will simply not work out, and so some losses are inevitable, but if they remain within defined limits, they should not be viewed as failures but rather as a successful adherence to a trading plan. In the aim of developing consistency in action, and the widely held belief that this is one of the cornerstones of effective trading, then it surely is a win to fulfil this.
So, in simple terms, the real “win” lies in a combination of maintaining discipline, following your system, and controlling risk beyond just looking at the P/L of a single trade.
What This Means to You:
Building and trading clear, unambiguous systems that you follow consistently has got to be the goal.
This process produces reliable data that you can later analyse and subsequently use to refine specific strategies and personal performance.
When you do this, every outcome, whether profit or loss, can serve as valuable feedback.
For example, a controlled loss that fits your plan is proof that your system works and that you are protecting your capital.
Alternatively, a trailing stop strategy, which means you exit trades in a timely way and give less profit back to the market, provides positive feedback that your system has merit in achieving outcomes.
Consequences of Non-Action:
Without this mindset shift, traders can become emotionally reactive, interpreting normal drawdowns as personal defeats.
This fosters loss aversion and other biases that can erode decision-making quality if left unchecked. Through the process of redefining “winning,” you are potentially safeguarding both your capital and, importantly, your trading confidence (a key component of trading discipline).
5. Seek First to Understand and Then Take Action
Covey's fifth habit emphasises empathy, the act of listening and aiming to fully understand before responding. In trading, this principle translates to understanding the market environment before taking any action.
In a Trading Context:
Many traders act impulsively, driven by excitement or fear, which often results in entering trades without taking into account the full context of what is happening in the market, and/or the potential short-term influences on sentiment that may increase risk.
This “minimalisation bias,” defined as acting on limited information, will rarely produce consistent results. Instead, adopt a process that begins with observation and comprehension.
What This Means to You:
Establishing a daily pre-trading routine is critical. This may include a review of key markets, sentiment indicators, and potential catalysts for change, such as imminent key data releases. Understanding what the market is telling you before you decide what to do is the aim of having this sort of daily agenda.
This approach may not only improve trade selection but also enable you to get into a state of psychological readiness that can facilitate decision-making quality throughout the session.
Consequences of Non-Action:
Failing to prepare for the trading day ahead can mean not only exposing yourself to unnecessary risk but also arguably being more likely to miss potential opportunities.
A trader who acts without understanding is vulnerable both psychologically and financially. Conversely, being forewarned is being forearmed. When you aim to understand markets first before any type of trading activity, your actions are more likely to be deliberate, grounded, and more effective.
6. Synergise
Synergy in Covey's model means valuing differences and combining the strengths of those around you to create outcomes greater than the sum of their parts.
In a Trading Context:
In trading, synergy refers to the integration of multiple systems and disciplines that work together. This includes your plan, your record keeping and performance management processes, your time management, and your emotional balance.
No single system is enough; success comes from the synergy of elements that support and inform one another.
What This Means to You:
Integrating learning and measurement is an integral part of your trading development process. Journaling, for example, allows you to assess not only your technical performance but also your behavioural consistency.
This self-awareness allows you to refine your plan and so helps you operate with greater confidence.
The synergy between rational analysis and emotional composure is what is more likely to lead to consistently sound trading decisions.
Consequences of Non-Action:
When logic and emotion are out of balance, decision-making will inevitably suffer.
If your systems are incomplete, ambiguous, or poorly connected to the reality of your current level of understanding, competence and confidence, your results are likely to be inconsistent. Building synergy across all areas of your trading practice, including that of evaluation and development in critical trading areas, will help create cohesion, efficiency, and better performance.
7. Sharpen the Saw
Covey's final habit focuses on continuous learning and refinement, including maintaining and improving the tools at your disposal and skills and knowledge that allow you to perform effectively.
In a Trading Context:
In trading, this translates to creating a plan to achieve ongoing, purposeful learning.
Even small insights can make a large difference in results. Effective traders continually refine their knowledge, ask new questions, and apply lessons from experience.
What This Means to You:
Trading learning can, of course, take many forms. Discovering new indicators that may offer some confluence to price action, testing different strategies, exploring new markets, or simply understanding more about yourself as a trader.
There is little doubt that active participation in learning keeps you engaged, adaptable and sharp. Even making sure you ask at least one question at a seminar or webinar or making a simple list at the end of each session of the "3 things I learned", can be invaluable in developing momentum for your growth as a trader.
Your record-keeping and performance metrics should generate fresh questions that can guide future development.
Consequences of Non-Action:
Without direction in your learning, your progress is likely to slow.
I often reference that when someone talks about trading experience in several years, this is only meaningful if there has been continuous growth, rather than staying in the same place every year (i.e. only one year of meaningful experience)
Passive trading learning, for example, reading an article without applying, watching a webinar without engagement, or measuring without closing the circle through putting an action plan together for your development, can all lead to stagnation.
It is fair to suggest that taking shortcuts in trading learning is likely to translate directly into shortcuts in result success.
Active, focused development is essential for sustained improvement.
Are You Ready for Action?
Stephen Covey’s The 7 Habits of Highly Effective People presented a timeless model for self-development and purposeful living.
When applied to trading, these same habits form a powerful framework for consistency, focus, and growth.
Trading is a pursuit that demands both technical skill and emotional strength. Success is rarely about finding the perfect system, but about developing the right habits that support consistent, rational decision-making over time.
By integrating the principles of Covey’s seven habits into your trading practice, you create a foundation not only for profitability but for continual personal growth.
A market bubble occurs when asset prices rise far beyond any reasonable valuation.
It is driven by speculation, emotion, and the belief that prices will continue rising indefinitely.
For traders, the challenge is more about finding a way to manage a bubble, rather than just identifying that one exists.
By their very nature, bubbles can persist far longer than any logical analysis suggests. There are opportunities as they develop, but timing their peak is virtually impossible.
Understanding their characteristics and having a systematic way of managing bubbles in your trading strategy is worth considering for any trader.
What is a Bubble?
Market bubbles have distinct features that separate them from normal bull markets or even overvalued conditions for a particular asset:
Dramatic Price Appreciation Disconnected From Fundamentals
In a bubble, traditional valuation metrics become meaningless.
Company or asset fundamentals that usually matter to market participants are ignored in the hope of what might be.
Cash flow, profit margins, competitive positioning, and (in some cases) producing revenue may be dismissed.
Widespread Participation And "This Time Is Different" Narratives
Bubbles require mass market participation.
When every headline you see or article you read references "this time is different," or "the old rules don't apply anymore," it is a sign that the collective psychology has shifted from normal caution.
Social media may begin to explode with ever more frequent success stories, and for the individual trader, the fear of missing out becomes increasingly overwhelming.
Credit and Leverage Fuelling Demand
Bubbles are typically accompanied by easier credit conditions.
When interest rates are lowered and investors are confident in general economic conditions, any spare cash is put to work.
In stock or other market bubbles, you may see retail traders maxing out credit cards to buy call options, with the put/call ratio becoming increasingly distorted.
This leverage often amplifies the rise and the eventual fall, making the risk even more acute and potentially damaging to trader capital.
Vertical Price Charts in Final Stages
One of the telltale signs of a bubble's final phase is a parabolic price chart.
Prices seem to go up daily, and every minor pullback is short-lived (creating more buying pressure).
This is the euphoria stage. It is where the greatest danger is.
The fear of missing out on further moves is at its highest, and a logical willingness to take profit off the table diminishes in the minds of ever more excited traders.
New participants may continue to enter solely for the way the price is appreciating. Entering into the move only understanding that what they are buying is going up, so they want to join in too.
Bubble vs. Overvalued: Key Differences
Not every expensive market is a bubble. Several characteristics distinguish a bubble from a simpler and far less dangerous overvaluation:
Elevated Valuations With Reasoned Fundamental Justification
An overvalued market has stretched valuations, but can point to real supporting factors (at least to some degree).
Examples include strong earnings growth, low interest rates, disruption in service or productivity, and providing genuine temporary value.
Even if prices respond to less obvious immediate influencing factors, such as international events, policy changes, and supply issues, the fact that some factors justify continued positive sentiment (even if somewhat unfulfilled) is a positive sign.
Linear or Steady Uptrend
Overvalued markets tend to grind higher with a more sustainable trend rather than a vertical spike. There are normal corrections along the way, even if the highs and lows of a fluctuation are higher.
Reasonable Participation Levels
There is evidence of institutional investors buying on any dips, but common retracements last days or even weeks.
Retail participation exists but isn't frenzied and plastered all over social media every day or referenced in mainstream media consistently.
Some Scepticism Still Exists
There will be some legitimate and contrary opinions about valuations. Major financial media will present both bearish and bullish cases when a stock is discussed.
Trading Strategies for Potential Bubble Management
Here is the scenario: You bought early in the up move, you are now in profit, but some of the bubble signs are beginning to show up in your thinking.
Tiered Profit-Taking Strategies
Don't try to pick the top. As an alternative approach, begin to scale out systematically with partial closes. This will alleviate the potential for FOMO creeping in.
You could stage this with set points, e.g. sell 30% when you've doubled, another 30% when you've tripled, 20% when conditions clearly show evidence of entering bubble territory and, having banked a substantial profit already, you keep the final 20% with a trailing stop for the final run if it happens.
Trailing Stops With Wider Bands to Accommodate Volatility
Let’s assume you see the merit in some form of trial stop. In bubble conditions, normal stop distances will get you whipsawed out. Use percentage-based trailing stops or ATR multiples with enough room to accommodate bigger intraday moves.
For example, if your norm is to trail your stop 1.5 x ATR behind price at the end of every candle, then in increasingly volatile conditions during a parabolic move, consider 2,5 x ATR to allow room to move while still offering protection against price collapse.
Reduce Position Sizing and Leverage
The temptation in bubbles is to maximise gains by increasing your margin and entering more and more positions in one asset.
High leverage and significant single asset exposure in bubble conditions is a potential death sentence to trading capital.
Recognising the added risks you are contemplating before entry is critical. Combining this with an approach that reduces position sizing and increases margin requirements is consistent with good trading practice as risk increases.
Planned and Rigid Exits
Before buying, you should have already made decisions on what exit approaches you should take and the parameters at which they will be executed,
Having the exit plan as you enter can limit the chance of getting trapped by greed. Neglecting this and focusing on the opportunity alone can be disastrous.
Never Assume You Can Time the Top
It is usually a big mistake if you believe you will recognise the exact top and exit perfectly. Let’s be frank, even if you hit it lucky once, you won't be able to every time — no one does.
Recognise Behavioural Biases That May Affect Your Judgment
Bubbles can create powerful psychological forces.
Anchoring bias may mean that you fixate on peak prices. Confirmation bias makes you seek information supporting your bullish view and ignore opposing evidence. Recency bias makes you believe the recent trend will continue indefinitely.
The indisputable key to any bias management is awareness and honesty that some markets may just not be for you (or if they are, to proceed with extreme and continuous caution).
Psychological Preparation for Rapid Reversals
Mentally rehearse the worst scenario and clarity of planned action, e.g., “if it drops 10% in three days, I will ….”.
Having thought through your response and armed with unambiguous exits in advance will make execution easier when emotions run high and begin to dominate.
Final Thoughts
Extreme valuations, little fundamental underpinning, parabolic price action, and universal bullishness should be part of your bubble identification checklist and flag that your bubble action plan should be implemented.
If you are already in, or tempted to be so, then approach bubbles with honesty, awareness of your trading self and extraordinary discipline to follow through, as predicting what and when things may dramatically turn is close to impossible.
Never forget you are not smarter than the market, but you can (potentially) be smarter than many traders by planning and doing the right thing.
Os mercados avançam para a próxima semana com dados de inflação na Austrália e no Japão, juntamente com elevadas tensões geopolíticas que continuam a influenciar os preços da energia e um sentimento de risco mais amplo.
Índice de Preços ao Consumidor (CPI) da Austrália: Os dados de inflação podem influenciar a Banco da Reserva da Austrália (RBA)) trajetória política, com o dólar australiano (AUD) e os rendimentos locais sensíveis a qualquer surpresa.
Cluster de dados do Japão: O IPC de Tóquio (preliminar) mais a produção industrial e as vendas no varejo fornecem um pulso de inflação e atividade que pode moldar as expectativas de normalização do Banco do Japão (BoJ).
CPI da zona do euro e da Alemanha: As leituras instantâneas da inflação testarão a narrativa da desinflação e influenciarão as expectativas temporais de redução das taxas do BCE.
Petróleo e geopolítica: O petróleo Brent registrou seu maior fechamento desde 8 de agosto de 2025 em meio a novas tensões no Oriente Médio, reforçando o risco de inflação impulsionado pela energia.
CPI da Austrália: as expectativas do RBA mudarão?
A próxima divulgação do IPC da Austrália será acompanhada de perto em busca de sinais sobre se a inflação está se estabilizando ou se mostrando mais persistente do que o esperado.
Uma impressão mais forte do que o esperado pode estar associada a rendimentos mais altos e a um AUD mais firme à medida que as expectativas da taxa se ajustam. Um resultado mais suave poderia apoiar as expectativas de uma postura política mais estável.
Datas importantes
Taxa de inflação (MoM): 11h30 de quarta-feira, 25 de fevereiro (AEDT)
CPI: 11h30 de quarta-feira, 25 de fevereiro (AEDT)
Os lançamentos do final de semana do Japão combinam o CPI de Tóquio (preliminar) com a produção industrial e as vendas no varejo, oferecendo uma leitura mais ampla sobre as pressões de preços e a demanda doméstica.
O IPC de Tóquio é frequentemente visto como um sinal oportuno para a dinâmica da inflação nacional e o debate do BoJ. A produção industrial e os gastos de varejo adicionam contexto à atividade.
Surpresas nesse cluster podem gerar movimentos bruscos no JPY, especialmente se os resultados mudarem as percepções sobre o ritmo e a persistência da normalização do BoJ.
Datas importantes
CPI de Tóquio: 10h30 de sexta-feira, 27 de fevereiro (AEDT)
Produção industrial: 10h50 de sexta-feira, 27 de fevereiro (AEDT)
Vendas no varejo: 10h50 de sexta-feira, 27 de fevereiro (AEDT)
Monitor
Sensibilidade do JPY às surpresas da inflação
O rendimento dos títulos se move em resposta aos dados da atividade
Reações patrimoniais se as expectativas do impulso de crescimento mudarem
Fluxos de energia e refúgios seguros
Os preços do petróleo subiram para o maior fechamento desde 8 de agosto de 2025, em meio a novas tensões no Oriente Médio.
Reportagens recentes sobre o aumento da atividade militar regional e manchetes sobre risco de transporte marítimo perto do Estreito de Ormuz reforçaram a segurança energética como foco de mercado. O Estreito de Ormuz continua sendo um ponto de estrangulamento amplamente vigiado para os fluxos globais de energia.
Os preços mais altos do petróleo podem alimentar as expectativas de inflação e influenciar os rendimentos dos títulos. Ao mesmo tempo, a incerteza geopolítica pode apoiar o USD por meio da demanda por refúgios seguros e do posicionamento da taxa relativa.
Monitor
Níveis de preços do petróleo Brent
Força do USD em relação às principais moedas
Movimentos de rendimento à medida que os prêmios de risco de inflação se ajustam
As leituras instantâneas da inflação da Alemanha e da zona do euro (IHPC) em geral testarão se a tendência de desinflação da região permanece intacta.
A divulgação da Alemanha pode influenciar as expectativas antes do valor agregado da zona do euro. Se a inflação central se mostrar estável, as expectativas sobre o momento e o ritmo da possível flexibilização do Banco Central Europeu poderão mudar.
Datas importantes
Alemanha - Taxa de Inflação: 12h de sábado, 28 de fevereiro (AEDT)
Monitor
Volatilidade do EUR em torno das divulgações de inflação
De disruptores tecnológicos a empreiteiros de defesa, algumas das empresas mais comentadas do mercado iniciam sua jornada pública por meio de uma oferta pública inicial (IPO). Para os negociadores, essas listagens públicas iniciais podem representar um ambiente de negociação único, mas também um período de maior incerteza.
Fatos rápidos
Um IPO é quando uma empresa privada lista suas ações em uma bolsa de valores pública pela primeira vez.
Os IPOs podem oferecer aos negociantes acesso antecipado a empresas de alto crescimento, mas apresentam alta volatilidade e histórico de preços limitado.
Uma vez listados, os negociantes podem ganhar exposição a ações de IPO por meio de compras diretas de ações ou derivativos, como contratos por diferença (CFDs).
O que é uma oferta pública inicial (IPO)?
Um IPO é quando uma empresa oferece suas ações ao público pela primeira vez.
Antes de realizar um IPO, as ações da empresa normalmente são detidas apenas por fundadores, primeiros funcionários e investidores privados. A abertura de capital torna as ações disponíveis para compra por qualquer pessoa.
Dependendo do tamanho da empresa, ela geralmente listará suas ações públicas na bolsa de valores local (por exemplo, a ASX na Austrália). No entanto, algumas empresas de grande avaliação optam por listar apenas em uma bolsa de valores global, como a Nasdaq, independentemente de onde sua sede principal esteja localizada.
Para os traders, os IPOs geralmente são a primeira oportunidade de ganhar exposição às ações de uma empresa. Eles podem criar um ambiente único com maior volatilidade e liquidez, mas também acarretam riscos elevados, devido ao histórico limitado de preços e à sensibilidade às oscilações de sentimento.
Por que as empresas se tornam públicas?
O maior fator para realizar um IPO é acessar mais capital. Listar em uma bolsa pública significa que a empresa pode levantar fundos significativos com a venda de ações.
Ele também fornece liquidez para os acionistas existentes. Fundadores, primeiros funcionários e investidores privados geralmente vendem uma parte de suas participações existentes no mercado aberto, obtendo os retornos de seus anos de apoio.
Além dos benefícios monetários, abrir o capital significa que as empresas podem usar suas ações como moeda para aquisições e oferecer remuneração baseada em ações para atrair talentos. E uma avaliação pública fornece uma referência transparente, que é útil para posicionamento estratégico e arrecadação de fundos futura.
No entanto, ele vem com vantagens e desvantagens. As empresas públicas devem cumprir as obrigações contínuas de divulgação e apresentação de relatórios, e a pressão dos acionistas públicos pode se tornar uma barreira ao progresso a longo prazo se muitas se concentrarem no desempenho de curto prazo.
Embora as especificidades variem de acordo com a jurisdição, passar de uma empresa privada para uma listagem pública geralmente envolve as seguintes etapas:
1. Preparação
A empresa primeiro seleciona o subscritor (normalmente um banco de investimento) para gerenciar a oferta. Juntos, eles avaliam as finanças, a estrutura corporativa e o posicionamento de mercado da empresa para determinar a melhor abordagem para abrir o capital. É a fase de planejamento pesado para garantir que a empresa esteja realmente pronta para abrir o capital.
2. Registro
Depois que tudo estiver preparado, os subscritores conduzem uma verificação completa da devida diligência e, em seguida, apresentam os documentos de divulgação necessários ao regulador relevante. Esses documentos fornecem uma divulgação detalhada ao regulador sobre a empresa, sua administração e sua proposta de oferta. Na Austrália, geralmente é um prospecto apresentado à ASIC; nos EUA, uma declaração de registro apresentada à SEC.
3. turnê
Os executivos da empresa e os subscritores apresentarão então o caso de investimento a investidores institucionais e analistas de mercado em um “roadshow”. Esta vitrine foi projetada para avaliar a demanda pelas ações e ajudar a gerar juros. Os investidores institucionais podem registrar seu interesse e avaliação do IPO, o que ajuda a informar o preço inicial.
4. Preços
Com base no feedback do roadshow e nas condições atuais do mercado, os subscritores definem o preço final das ações e determinam o número de ações a serem emitidas. As ações são alocadas no “mercado primário” aos investidores que participam da oferta (antes que as ações sejam listadas publicamente no mercado secundário). Esse processo define o preço pré-mercado, o que efetivamente determina a avaliação pública inicial da empresa.
5. Listando
No dia da listagem, as ações da empresa começam a ser negociadas na bolsa de valores escolhida, abrindo oficialmente o mercado secundário. Para a maioria dos negociantes, esse é o primeiro ponto em que eles podem negociar as ações, diretamente ou por meio de derivativos, como Compartilhe CFDs.
6. Pós-IPO
Uma vez listada, a empresa fica sujeita a requisitos rigorosos de relatórios e divulgação. Ela deve se comunicar regularmente com os acionistas, publicar seus resultados financeiros e cumprir os padrões de governança da bolsa na qual está listada.
Riscos e benefícios do IPO para comerciantes
Como os traders participam dos IPOs?
Para a maioria dos traders, a participação em um IPO ocorre quando as ações são listadas e começam a ser negociadas no mercado secundário.
Uma vez que as ações estão ativas na bolsa, os investidores podem comprar as ações físicas diretamente por meio de uma corretora ou bolsa on-line, ou podem usar derivativos como Compartilhe CFDs assumir uma posição sobre o preço sem possuir o ativo subjacente.
Os primeiros dias de negociação de IPO tendem a ser altamente voláteis. Os comerciantes devem garantir que tomaram medidas apropriadas de gerenciamento de risco para ajudar a se proteger contra possíveis oscilações bruscas de preços.
A linha de fundo
Os IPOs marcam quando uma empresa se torna investível para o público. Eles podem oferecer acesso antecipado a empresas de alto crescimento e criar um ambiente de negociação exclusivo, impulsionado pela elevada volatilidade e pelo interesse do mercado.
Para os negociadores, entender como o processo funciona, o que impulsiona os preços e o desempenho pós-IPO e como avaliar as recompensas potenciais em relação aos riscos de negociar ações recém-listadas é essencial antes de assumir uma posição.
2026 não está dando aos investidores muito espaço para respirar. Parece que os mercados podem ter superado em grande parte a ideia de que os cortes nas taxas estão chegando e entraram em um ano em que a inflação pode ser mais difícil de controlar do que muitos esperavam.
A inflação de bens aumentou, enquanto a inflação de serviços permanece relativamente estável devido às contínuas pressões sobre os custos de mão de obra. Os custos de moradia, particularmente os aluguéis, também continuam sendo uma fonte importante de pressão inflacionária.
O RBA está tentando manter a credibilidade na inflação sem empurrar a economia para o outro lado.
Dados-chave
O CPI ainda está por aí 3,8 por cento (acima da meta), os salários ainda estão subindo cerca de 0,8 por cento ao longo do trimestre, e o desemprego está por aí 4,1 por cento.
Com base nos preços implícitos no mercado, os aumentos das taxas não são esperados em breve, portanto, a forma como o RBA explica sua decisão pode importar quase tanto quanto a decisão em si. Se o tom mudar as expectativas, essas expectativas podem movimentar os mercados.
O que este manual aborda
Este é um manual para semanas com muito RBA em 2026. Ele aborda o que observar em todos os setores, lista os principais gatilhos e explica quais indicadores podem mudar o sentimento.
Principais indicadores econômicos, fevereiro de 2026 | ABS/RBA
1. Bancos e finanças: como as decisões do RBA fluem para empréstimos e devedores
Os bancos são onde o RBA aparece mais rapidamente na economia australiana. As taxas podem atingir os mutuários rapidamente e alimentar os custos de financiamento e o sentimento.
Em fases mais apertadas, as margens podem melhorar no início, mas isso pode mudar se os custos de financiamento aumentarem mais rapidamente ou se a qualidade do crédito começar a enfraquecer. O equilíbrio entre essas forças é o que mais importa.
Se os bancos entrarem em uma semana de decisão do RBA, isso pode significar que o mercado pensa melhor para sustentar os lucros por mais tempo. Se eles se venderem, isso pode significar que o mercado pensa mais alto por mais tempo e prejudica os mutuários. Você pode obter duas leituras diferentes do mesmo título.
O que assistir
A forma da curva de rendimento: Uma curva mais íngreme pode ajudar nas margens, enquanto uma curva invertida pode sinalizar estresse de crescimento.
Competição de depósitos: Ele pode reduzir discretamente as margens, mesmo quando as principais taxas parecem favoráveis.
Redação do RBA sobre estabilidade financeira, amortecedores domésticos e resiliência. Frases pequenas podem mudar a história do risco.
Gatilho potencial
Se o RBA parecer mais agressivo do que o esperado, os bancos podem reagir mais cedo, à medida que os mercados reavaliam as expectativas de crescimento e risco de crédito. Às vezes, o primeiro movimento pode definir o tom da sessão.
Principais riscos
Os custos de financiamento aumentam mais rápido do que os rendimentos dos empréstimos: Pode apontar para pressão de margem.
Rigor claro nas condições de crédito: O aumento dos atrasos ou o estresse de refinanciamento podem mudar a narrativa rapidamente.
O setor financeiro é o maior setor no índice S&P/ASX 200 | S&P Global
2. Discricionariedade do consumidor e varejo: onde taxas mais altas atingem os gastos das famílias
Quando a política é rígida, a discricionariedade do consumidor se torna um teste vivo da resiliência familiar. É aqui que os custos diários mais altos geralmente aparecem mais rapidamente.
Grandes chamadas sobre o consumidor podem parecer óbvias até que os dados parem de ser copiadas. Quando isso acontece, a narrativa pode mudar rapidamente.
O que assistir
Salários versus inflação: A renda real empurra ou arrasta.
Sinais de parto precoce: As horas trabalhadas podem diminuir antes que o desemprego aumente.
Relatando dicas da temporada: Descontos, repasse de custos e pressão de margem podem indicar o quanto a demanda realmente está sobrecarregada.
Gatilho potencial
Se o tom do RBA for mais agressivo do que o esperado, o setor pode ser sensível às expectativas de taxas. Qualquer movimento inicial pode não persistir, e a ação subsequente do preço pode depender dos dados recebidos e do posicionamento
Principais riscos
Uma rápida reviravolta no mercado de trabalho.
Novos choques no custo de vida, especialmente energia ou habitação, que atingem os gastos rapidamente.
3. Recursos: o que observar quando as tarifas, a geopolítica e as políticas mudam
Os recursos podem servir como uma leitura sobre o crescimento global, mas os movimentos cambiais e o tom do banco central podem mudar a forma como essa história chega à Austrália.
Em 2026, as tarifas e a geopolítica também podem criar movimentos mais nítidos do que o normal, de modo que o risco de lacuna pode estar no topo do ciclo normal.
O RBA ainda é importante por meio de dois canais: o dólar australiano e o apetite geral pelo risco. Ambos podem reavaliar o setor rapidamente, mesmo quando os preços das commodities não mudaram muito.
O que assistir
O pulso do crescimento global: Expectativas de demanda industrial e sinais vinculados à China.
O dólar australiano: O movimento pós-decisão pode se tornar um segundo fator para o setor.
Liderança setorial: A forma como o comércio de recursos versus o mercado mais amplo pode sinalizar o regime atual.
Gatilho potencial
Se o tom do RBA se tornar mais restritivo enquanto o crescimento global permanecer estável, os recursos poderão se manter melhor do que outras partes do mercado. Fluxos de caixa fortes podem ser mais importantes, e o ângulo real dos ativos pode atrair compradores.
Principais riscos
Em um evento real de estresse, as correlações podem aumentar e o posicionamento defensivo pode falhar.
Se a política se tornar um susto de crescimento, o ciclo pode assumir o controle e o setor pode desaparecer rapidamente.
Os materiais (recursos) superaram outros setores da ASX em relação ao ano anterior | Índice de mercado
4. Defensivos, produtos básicos e cuidados de saúde de qualidade
Os defensivos devem ser o canto mais calmo do mercado quando todo o resto parece confuso. Em 2026, eles ainda têm uma grande fraqueza: taxas de desconto.
Defensivos de qualidade podem atrair influxos quando o crescimento parece instável, mas algumas ações de crescimento defensivo ainda são negociadas como ativos de longa duração. Eles podem ser atingidos quando os rendimentos aumentam, mesmo que o negócio pareça sólido. Isso significa que os lucros podem permanecer estáveis enquanto as avaliações ainda mudam.
O que assistir
Força relativa: Qual o desempenho dos defensivos durante as semanas do RBA em relação ao mercado mais amplo.
Idioma de orientação: Comentários sobre pressão de custos, poder de precificação e se os volumes estão se mantendo.
Comportamento de rendimento: O aumento dos rendimentos pode superar a oferta de qualidade e reduzir os múltiplos.
Gatilho potencial
Se o RBA parecer agressivo e os cíclicos começarem a oscilar, os defensivos podem atrair influxos relativos, mas isso pode depender de os rendimentos permanecerem contidos. Se os rendimentos aumentarem drasticamente, as defensivas de longa duração ainda podem diminuir.
Principais riscos
Inflação de custos que reduz as margens e enfraquece a história defensiva.
O setor de saúde teve um desempenho inferior ao S&P/ASX 200 desde o final da pandemia | Índice de mercado
5. Ativos tangíveis, ouro e ações de ouro
Em 2026, os ativos tangíveis podem ter menos a ver com a história simples de cobertura da inflação e mais com o risco de cauda e a incerteza política.
Quando a confiança diminui, os ativos tangíveis geralmente recebem mais atenção. Eles não são movidos por um fator, e o ouro ainda pode cair se os principais fatores correrem contra ele.
O que assistir
Direção real do rendimento: Molda o custo de oportunidade de guardar ouro.
Direção do dólar americano: Um importante canal de preços para ouro.
Ações de ouro versus ouro à vista: Os mineradores adicionam alavancagem operacional e também aumentam o risco de custo.
Gatilho potencial
Se o mercado começar a questionar o controle da inflação ou a credibilidade da política, a narrativa dos ativos tangíveis pode se fortalecer. Se o RBA permanecer restritivo enquanto a desinflação continuar, o ouro pode perder urgência e o dinheiro pode se transformar em outras negociações.
Principais riscos
Os rendimentos reais aumentam significativamente, o que pode pressionar o ouro.
A aglomeração e o posicionamento relaxam, o que pode causar recuos bruscos.
Gráfico 5G S&P/ASX All Ordinaries Gold versus Spot Gold (XAUUSD) | TradingView
6. Encanamento do mercado, câmbio, volatilidade e dispersão das taxas
Em algumas semanas do RBA, o primeiro movimento aparece nas taxas e no dólar australiano, e as ações seguem posteriormente por meio da rotação do setor, em vez de um movimento limpo do índice.
Quando a orientação muda, o RBA pode mudar a forma como os mercados se movem juntos. Você pode acabar com um índice plano enquanto os setores oscilam fortemente em direções opostas.
O que assistir
Tarifas de front-end: A velocidade de reprecificação logo após a decisão pode revelar a verdadeira surpresa.
Reação AUD: A direção e o acompanhamento geralmente moldam o próximo movimento em ações e recursos.
Volatilidade implícita versus realizada: Pode mostrar se o mercado pagou muito ou pouco pelo evento.
Inclinação das opções: Pode refletir a demanda por proteção negativa versus perseguição positiva.
Comportamento precoce da fita: Os primeiros 5 a 15 minutos podem ser confusos e podem ser revertidos.
Gatilho potencial
Se a decisão for esperada, mas a declaração for agressiva, o front-end pode ser reavaliado primeiro e o AUD pode seguir em frente. A volatilidade percebida ainda pode aumentar mesmo que o índice mal se mova, pois o mercado reescreve a trajetória e gira as posições sob a superfície.
Principais riscos
Uma verdadeira surpresa que supera as opções implícitas e cria lacunas.
Manchetes macro concorrentes que dominam a fita e abafam o sinal RBA.
Liquidez reduzida que cria sinais falsos, falhas e uma execução pior do que os modelos supõem.
Taxa de juros australiana e volatilidade da taxa de câmbio 1970-2020 | SUTIÃ
7. Cestas temáticas
As cestas temáticas podem permitir que os comerciantes expressem um regime macro e, ao mesmo tempo, reduzir o risco de um único nome. Eles também introduzem seus próprios riscos, especialmente em torno de eventos.
O que assistir
O que a cesta contém: Metodologia, regras de reequilíbrio, concentração oculta.
Liquidez e spreads: Especialmente em torno de janelas de eventos.
Rastreamento versus narrativa: Se o “tema” se comporta como o driver de macro.
Gatilho potencial
Se a linguagem do RBA reforçar um regime “restritivo e incerto”, cestas temáticas vinculadas a valor, qualidade ou ativos tangíveis podem atrair atenção, especialmente se os índices gerais ficarem instáveis.
Principais riscos
Inversão do tema quando as expectativas macro mudam.
Risco de liquidez em janelas de eventos, onde os spreads podem aumentar substancialmente.
O objetivo desse manual não é prever o título exato; é saber onde os efeitos de segunda ordem geralmente ocorrem e ter uma pequena lista de verificação pronta antes que a decisão seja tomada.
Manter esses gatilhos e riscos em vista pode ajudar alguns traders a estruturar seu monitoramento em torno das decisões do RBA ao longo de 2026.
Perguntas frequentes
Por que o “tom” importa tanto em 2026?
Porque os mercados geralmente pré-avaliam a decisão. As informações incrementais são uma orientação sobre se o RBA parece confortável, preocupado ou aberto a se mover novamente.
Quais são os sinais mais rápidos logo após uma decisão?
Alguns traders consideram as taxas iniciais, o AUD e a liderança do setor como indicadores iniciais, mas esses sinais podem ser ruidosos e influenciados pelo posicionamento e pela liquidez.
Por que os REITs são chamados de negociações de duração?
Porque grande parte de sua avaliação pode ser sensível às taxas de desconto e aos custos de financiamento. Quando os rendimentos se movem, as avaliações podem ser reavaliadas rapidamente.
Os defensivos estão sempre mais seguros perto do RBA?
Nem sempre. Se os rendimentos aumentarem, as defensivas de longa duração ainda podem ser reduzidas, mesmo com ganhos estáveis.
Por que os ativos tangíveis continuam aparecendo nas narrativas de 2026?
Porque eles podem atuar como uma proteção quando a confiança na credibilidade da política oscila, mas também acarretam riscos de aglomeração e de rendimento real.