Position Sizing for ASX Share CFDs ( Free calculator download )
Mike Smith
14/4/2021
•
0 min read
Share this post
Copy URL
Position sizing is simply the number of contracts that you choose to enter for any specific trade. It is this, combined with the movement in price (either positively or negatively) from entry to exit in your trade, that determines your final dollar result for any specific trade. As this result impacts on your trading capital, position sizing, along with appropriate exit decisions and actions, are THE two key factors in both risk management and taking profit.
It is good trading practice to have a “tolerable risk level”, i.e. what you are prepared to lose on a single trade. This, as we have covered in First Steps, is usually expressed as a percentage of your total trading capital (somewhere between 1-4% are commonly used). For example, If your chosen risk level is 3% and the capital in your account is $5000, this means that you would be prepared to risk $150 on one trade.
Why use formal position sizing? A formal position sizing system aims to answer the question “how many lots do I enter to keep any loss within my tolerable risk level if my stop loss is triggered?”. As we enter a trade, we ALL position size, but we have a choice as to how we action this.
We can: Guess. Use a dollar level i.e. when it hits this we are out (you can retrospectively modify a stop level on a trade chart on your trading platform). Use a technical level as a stop loss and work out how many contracts we can enter based on the Pip movement between entry and stop.
Logically, “3” would seem the most robust AND this should be calculated BEFORE entering a trade. So how do I position size? Accepting that the third of the options above is theoretically the optimum method, the process is: a.
What is my “tolerable risk level” in dollar terms? b. What is the desired technical entry and stop loss price levels? c. What is the dollar difference between entry and stop loss exit? d.
Divide ”a” (your tolerable risk level) by “c” to get an estimated position size. If your account is in Australian dollars the calculation is easier than trading either many index CFDs (except for the ASX200) or Forex as there is no need to add a further calculation to convert a profit/loss back into your account currency. Other position sizing issues to consider: Position sizing can only make a difference to your risk management if you adhere to your pre-planned exit strategy.
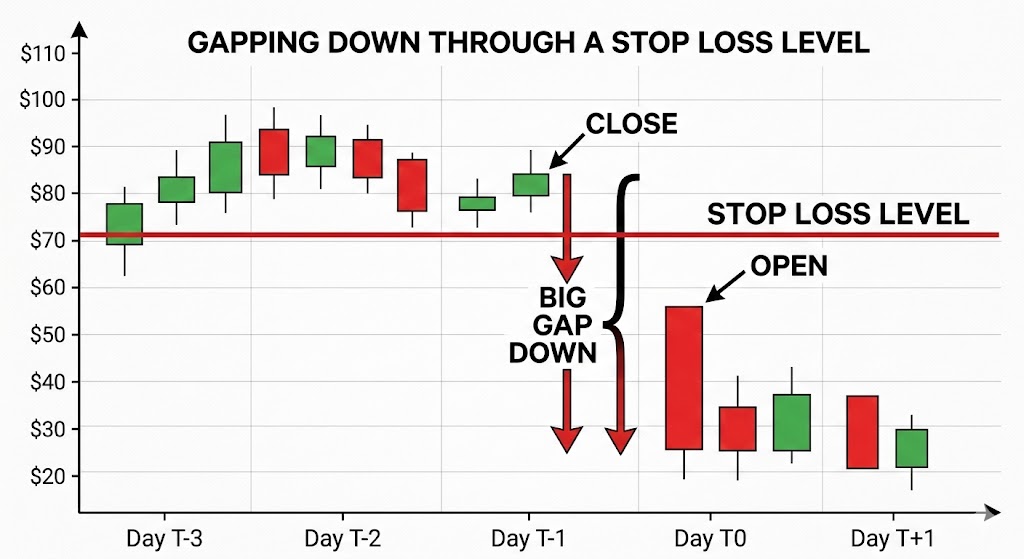
Be aware of gapping on market open from previous close price. This is at its potentially most severe subsequent to a company’s earnings report release and so you may want to consider avoiding this situation as part of your risk management plan. Once you have mastered basic position sizing, consider whether different market conditions or situations would merit a different tolerable risk level on which to base your position sizing calculations. e.g. a major economic news release increased general market volatility.
In such situations it may be that you enter a smaller position initially and then accumulate into the position if it goes in your desired direction. There is a FREE DOWNLOAD of an excel-based “indicative CFD position size calculator” you are welcome to use to assist you in this important part of trading entry. Feel free to use, but please pay attention to the notes.
Click on the link below. CFD position size calculator v2 Please feel free to connect with the team with any questions you have about share CFDs and how you can add this to your trading.
By
Mike Smith
Mike Smith (MSc, PGdipEd)
Client Education and Training
The information provided is of general nature only and does not take into account your personal objectives, financial situations or needs. Before acting on any information provided, you should consider whether the information is suitable for you and your personal circumstances and if necessary, seek appropriate professional advice. All opinions, conclusions, forecasts or recommendations are reasonably held at the time of compilation but are subject to change without notice. Past performance is not an indication of future performance. Go Markets Pty Ltd, ABN 85 081 864 039, AFSL 254963 is a CFD issuer, and trading carries significant risks and is not suitable for everyone. You do not own or have any interest in the rights to the underlying assets. You should consider the appropriateness by reviewing our TMD, FSG, PDS and other CFD legal documents to ensure you understand the risks before you invest in CFDs.
A volatilidade tem um jeito de aparecer sem ser convidada.
Um dia, o ASX está flutuando silenciosamente... e no outro, os requisitos de margem aumentam, as paradas não são preenchidas onde o esperado e os portfólios abrem com lacunas desconfortáveis da noite para o dia.
Se você está procurando por respostas, não está sozinho. Algumas das perguntas mais pesquisadas sobre volatilidade entre os negociadores australianos estão relacionadas a chamadas de margem, derrapagens, lacunas noturnas, fundos negociados em bolsa (ETFs) alavancados e ferramentas como o Average True Range (ATR).
Aqui está o que está acontecendo.
Por que isso importa agora
Os mercados globais se tornaram mais sensíveis às taxas de juros, dados de inflação, geopolítica e fluxos impulsionados pela tecnologia. Quando a liquidez diminui e a incerteza aumenta, as oscilações de preços aumentam. Isso é volatilidade.
E a volatilidade não afeta apenas a direção dos preços, ela muda a forma como as negociações são executadas, quanto capital é necessário e como o risco se comporta sob a superfície.
Tradução: A volatilidade não se trata apenas de movimentos maiores, mas sim de movimentos mais rápidos e menor liquidez - é aí que a mecânica da negociação é mais importante.
Por que meu corretor aumentou os requisitos de margem?
Uma das perguntas mais pesquisadas sobre volatilidade é por que os requisitos de margem aumentam sem aviso prévio.
Quando os mercados se tornam instáveis, os corretores podem aumentar os requisitos de margem em contratos por diferença (CFDs) e outros produtos alavancados. Grandes oscilações de preço podem aumentar o risco de contas entrarem em patrimônio líquido negativo, portanto, aumentar os requisitos de margem reduz a alavancagem disponível e pode ajudar a gerenciar a exposição em condições extremas.
O que isso pode significar na prática
-Uma chamada de margem pode ocorrer mesmo que o preço não tenha se movido significativamente. -A alavancagem efetiva pode cair rapidamente. -As posições podem precisar ser reduzidas em curto prazo.
Os ajustes de margem geralmente são uma resposta à mudança do risco de mercado, não uma decisão aleatória. Em mercados altamente voláteis, é prudente presumir que as configurações de margem podem mudar rapidamente, portanto, muitos negociadores optam por revisar os tamanhos das posições e os buffers disponíveis à luz desse risco.
O que é deslizamento e por que meu batente não preencheu meu preço?
Outro tópico pesquisado com frequência é o deslizamento.
A derrapagem pode ocorrer quando uma ordem de parada é acionada e executada no próximo preço disponível. O resultado pode depender do tipo de pedido, da liquidez do mercado e das lacunas. Em mercados calmos, a diferença pode ser pequena, enquanto em mercados rápidos, os preços podem ultrapassar o nível de parada.
Ilustração da diferença de preço em relação ao nível de stop-loss | GO Markets
Os drivers comuns incluem
-Principais divulgações econômicas ou de resultados. - Liquidez escassa. - Pisos de parada lotados. - Sessões noturnas.
As ordens de stop-loss geralmente priorizam a execução em vez da certeza do preço e, durante períodos de alta volatilidade, essa distinção se torna importante. Ajustar o tamanho da posição e colocar paradas com referência ao movimento típico de preços pode ser mais eficaz do que simplesmente apertar as paradas em condições instáveis.
Como faço para gerenciar lacunas noturnas no ASX?
A Austrália negocia enquanto os Estados Unidos dormem e vice-versa. Essa diferença de fuso horário é, infelizmente, uma das razões pelas quais o risco de lacuna noturna é frequentemente pesquisado pelos comerciantes australianos. Se os mercados dos EUA caírem drasticamente, o ASX poderá abrir em baixa na manhã seguinte, sem oportunidade de sair entre o fechamento e a abertura.
Exemplos de abordagens de gerenciamento de risco que os traders do mercado podem usar incluem
-Cobertura de índices usando futuros ASX 200 ou CFDs*. -Cobertura parcial durante eventos de alto risco. -Reduzir a exposição antes dos principais anúncios macro.
O hedge pode compensar parte de um movimento, mas introduz um risco básico, pois as ações individuais podem não se mover de acordo com o índice mais amplo.
Não há proteção perfeita, apenas compensações entre custo, complexidade e redução de riscos.
*Os CFDs são instrumentos complexos e apresentam um alto risco de perda de dinheiro devido à alavancagem.
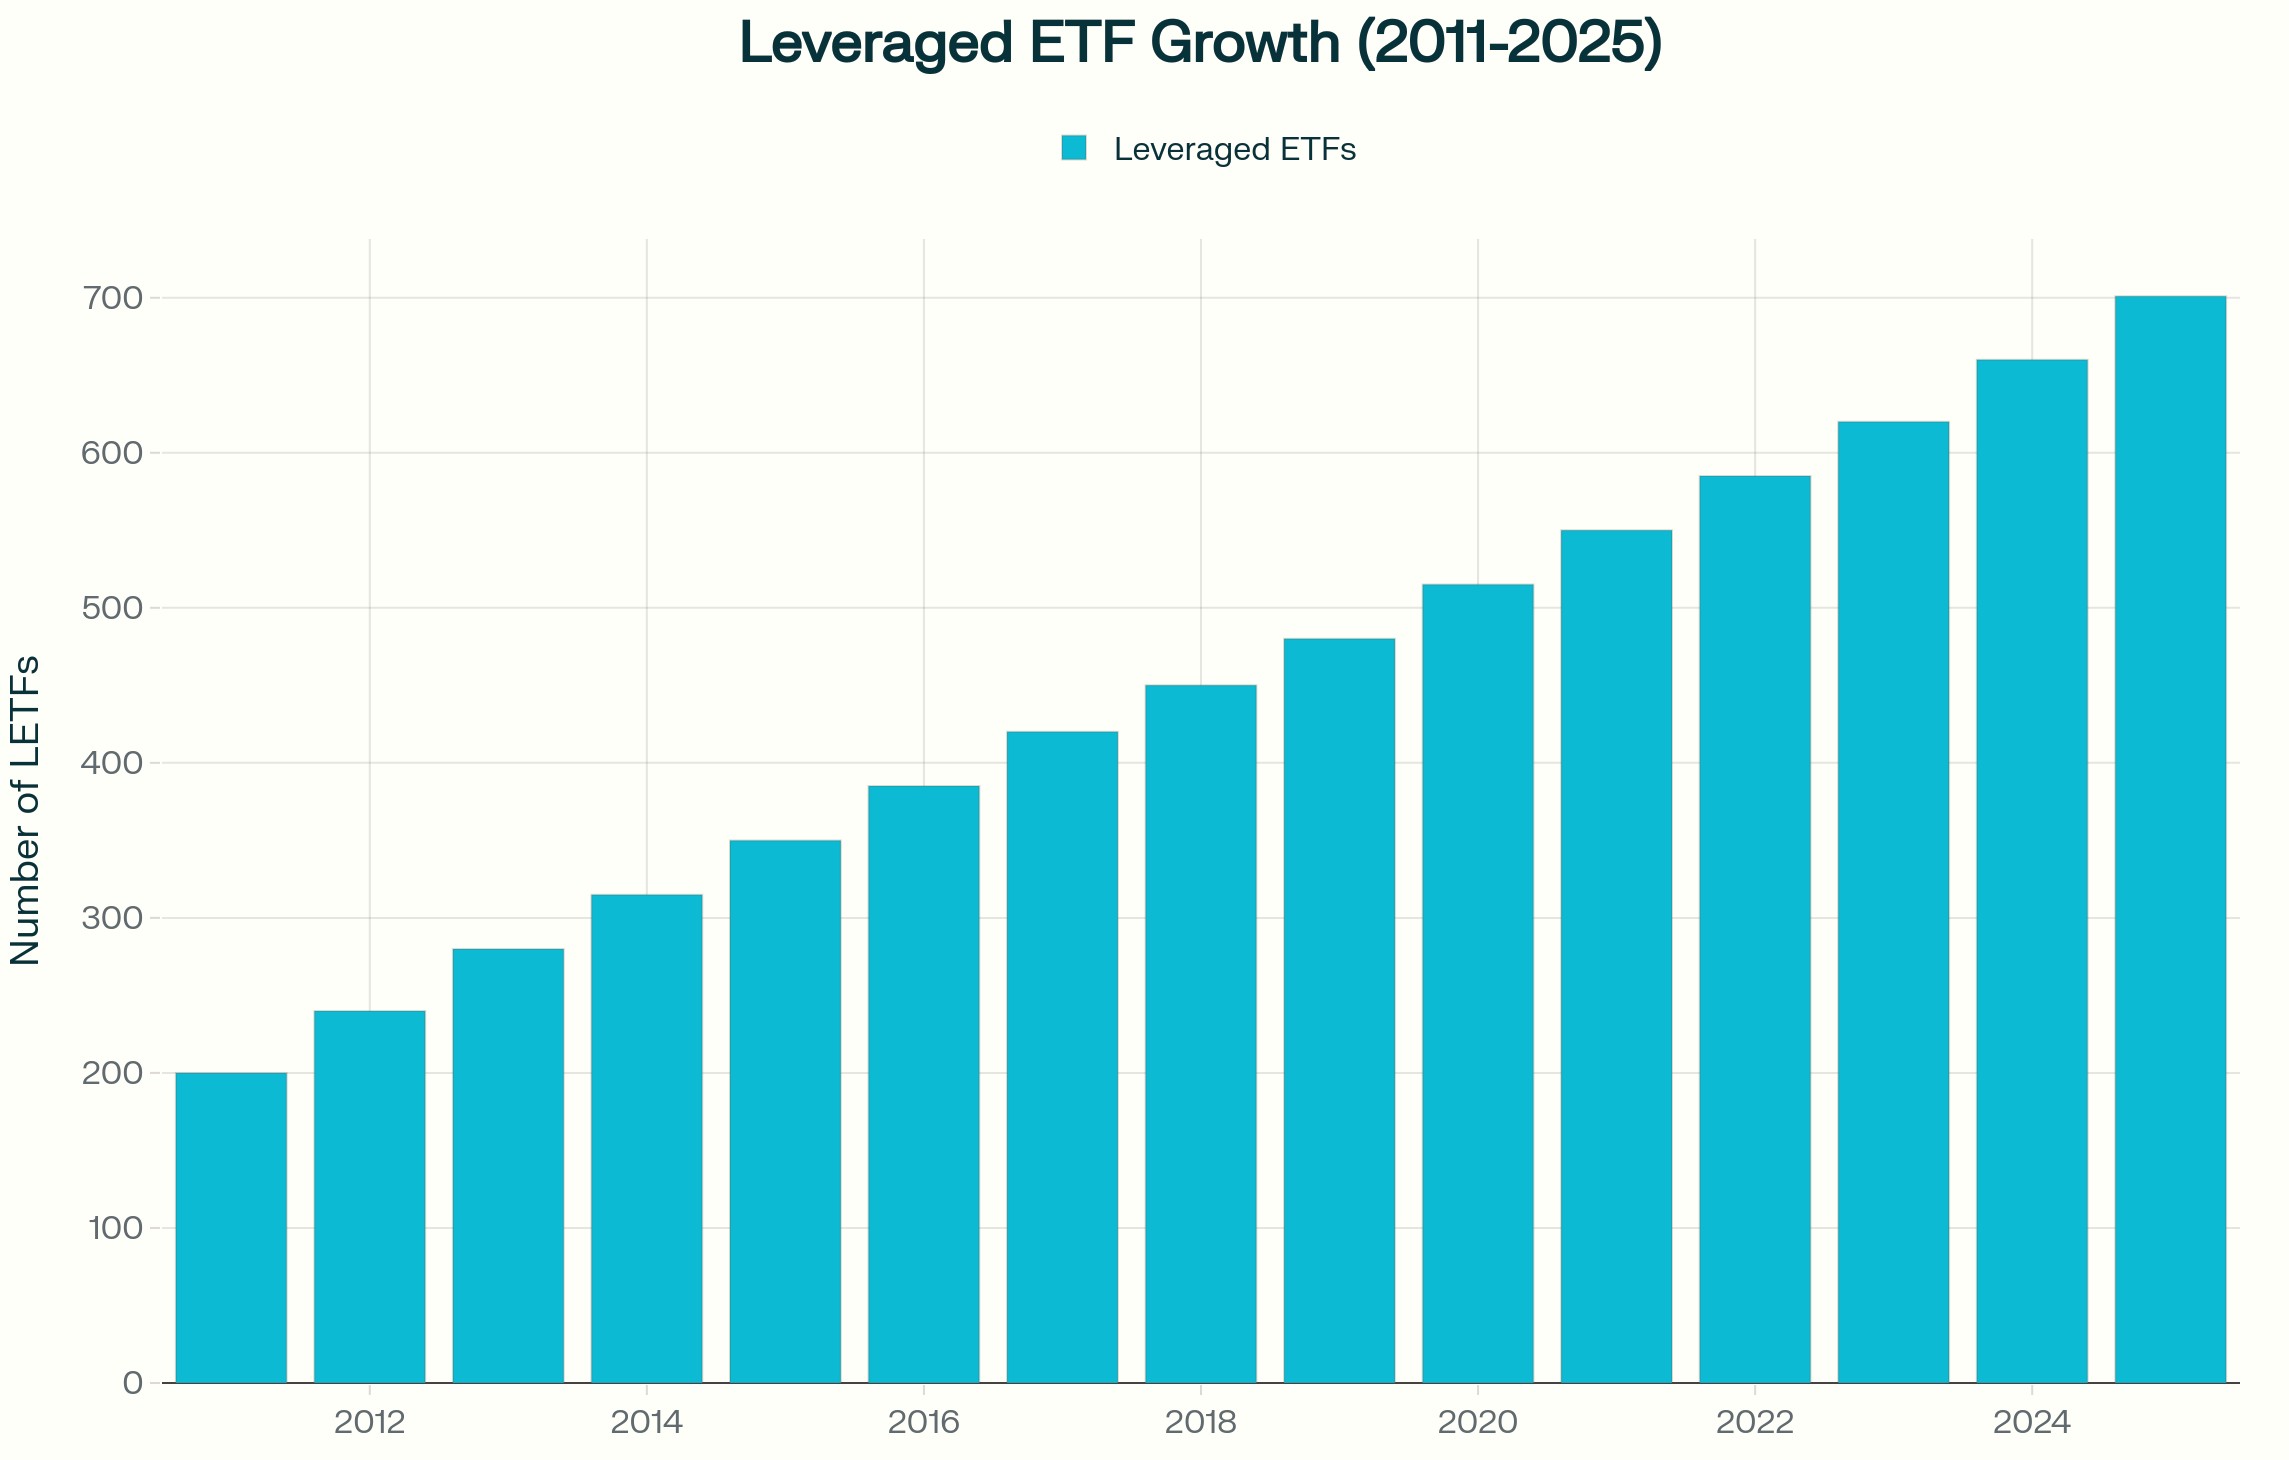
Quais são os principais riscos dos ETFs alavancados ou inversos em mercados voláteis?
Os ETFs alavancados e inversos são frequentemente pesquisados durante períodos de maior volatilidade.
Embora esses produtos normalmente sejam reinicializados diariamente, eles visam gerar um múltiplo do retorno diário do índice, não seu retorno de longo prazo. Em um mercado volátil e lateral, a composição diária pode corroer o valor, mesmo que o índice termine próximo ao nível inicial.
Crescimento alavancado do ETF (2011—2025) | Fonte: Investing.com
Isso ocorre porque os ganhos e as perdas se acumulam de forma assimétrica. Uma queda de 10 por cento exige um ganho de mais de 10 por cento para se recuperar. Quando esse efeito é multiplicado diariamente, os resultados podem divergir materialmente do índice subjacente ao longo do tempo.
Esses instrumentos podem ser usados taticamente por alguns participantes do mercado. Eles geralmente não são projetados como ferramentas de hedge de longo prazo e entender sua estrutura é essencial antes de usá-los em uma estratégia.
Como o ATR pode ser usado para informar o posicionamento da parada??
O intervalo médio real (ATR) é um indicador comumente usado para medir a volatilidade.
O ATR estima o quanto um ativo normalmente se move em um determinado período, incluindo lacunas. Em vez de definir um stop em uma porcentagem arbitrária, alguns traders fazem referência ao ATR e colocam os stops em um múltiplo, como duas ou três vezes o ATR, para refletir as condições prevalecentes.
Quando a volatilidade aumenta, o ATR se expande e isso pode implicar paradas maiores ou tamanhos de posição menores para que o risco geral permaneça constante. A mudança é deixar de perguntar: “Até onde estou disposto a perder?” a perguntar: “O que é um movimento normal nas condições atuais?”
Considerações práticas em mercados voláteis
Durante períodos de elevada volatilidade, os traders podem considerar
Permitindo a possibilidade de mudanças de margem
Dimensionar posições de forma conservadora se a volatilidade aumentar
Reconhecendo que as ordens de stop-loss não garantem um preço de saída específico
Analisando a exposição antes de grandes eventos econômicos
Entendendo a mecânica diária de redefinição de ETFs alavancados
Usando medidas de volatilidade, como ATR, para informar o posicionamento da parada
Manter amortecedores de caixa adequados
A volatilidade não recompensa apenas a previsão. A preparação e a conscientização sobre os riscos podem ajudar os negociadores a entender os riscos potenciais, mas os resultados permanecem imprevisíveis.
O que isso significa para os comerciantes australianos
Os mercados australianos enfrentam considerações estruturais específicas em comparação com os mercados asiático e americano. O risco de lacuna noturna é influenciado pelo horário de negociação dos EUA e índices pesados de recursos, como o ASX, podem responder rapidamente aos movimentos dos preços das commodities e aos dados da China. A exposição cambial, incluindo movimentos de AUD e dólar americano (USD), pode adicionar outra camada de variabilidade.
A volatilidade não é uniforme entre as regiões. Ele se comporta de maneira diferente dependendo da estrutura do mercado e da profundidade da liquidez.
Perguntas frequentes sobre volatilidade
O que causa picos repentinos na volatilidade do mercado? Decisões sobre taxas de juros, dados de inflação, desenvolvimentos geopolíticos, surpresas de lucros e restrições de liquidez são gatilhos comuns.
Por que os corretores aumentam a margem em mercados voláteis? Reduzir a exposição à alavancagem e gerenciar o risco quando as oscilações de preço aumentam.
As ordens de stop-loss podem falhar durante a volatilidade? Eles podem sofrer derrapagens se os mercados ultrapassarem o nível de parada, o que significa que a execução pode ocorrer a um preço pior do que o esperado. Em mercados rápidos ou ilíquidos, essa diferença pode ser significativa.
Os ETFs alavancados são adequados para cobertura de longo prazo? Eles geralmente são estruturados para exposição de curto prazo devido a reinicializações diárias. Se eles são apropriados depende de seus objetivos, situação financeira e tolerância ao risco.
Como a volatilidade pode ser medida antes de fazer uma negociação? Ferramentas como ATR, indicadores de volatilidade implícitos e análise de intervalo histórico podem ajudar a quantificar as condições prevalecentes.
Aviso de risco: períodos de maior volatilidade podem levar a movimentos rápidos de preços, mudanças de margem e execução a preços diferentes dos esperados. Ferramentas de gerenciamento de risco, como ordens de stop-loss e indicadores de volatilidade, podem ajudar na avaliação das condições do mercado, mas não podem eliminar o risco de perda, especialmente ao usar produtos alavancados.
Every trader has had that moment where a seemingly perfect trade goes astray.
You see a clean chart on the screen, showing a textbook candle pattern; it seems as though the market planets have aligned, and so you enthusiastically jump into your trade.
But before you even have time to indulge in a little self-praise at a job well done, the market does the opposite of what you expected, and your stop loss is triggered.
This common scenario, which we have all unfortunately experienced, raises the question: What separates these “almost” trades from the truly higher-probability setups?
The State of Alignment
A high-probability setup isn’t necessarily a single signal or chart pattern. It is the coming together of several factors in a way that can potentially increase the likelihood of a successful trade.
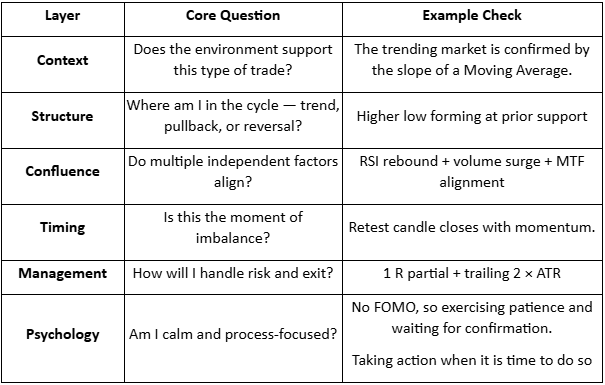
When combined, six interconnected layers can come together to form the full “anatomy” of a higher-probability trading setup:
Context
Structure
Confluence
Timing
Management
Psychology
When more of these factors are in place, the greater the (potential) probability your trade will behave as expected.
Market Context
When we explore market context, we are looking at the underlying background conditions that may help some trading ideas thrive, and contribute to others failing.
Regime Awareness
Every trading strategy you choose to create has a natural set of market circumstances that could be an optimum trading environment for that particular trading approach.
For example:
Trending regimes may favour momentum or breakout setups.
Ranging regimes may suit mean-reversion or bounce systems.
High-volatility regimes create opportunity but demand wider stops and quicker management.
Investing time considering the underlying market regime may help avoid the temptation to force a trending system into a sideways market.
Simply looking at the slope of a 50-period moving average or the width of a Bollinger Band can suggest what type of market is currently in play.
Sentiment Alignment
If risk sentiment shifts towards a specific (or a group) of related assets, the technical picture is more likely to change to match that.
For example, if the USD index is broadly strengthening as an underlying move, then looking for long trades in EURUSD setups may end up fighting headwinds.
Setting yourself some simple rules can help, as trading against a potential tidal wave of opposite price change in a related asset is not usually a strong foundation on which to base a trading decision.
Key Reference Zones
Context also means the location of the current price relative to levels or previous landmarks.
Some examples include:
Weekly highs/lows
Prior session ranges, e.g. the Asian high and low as we move into the European session
Major “round” psychological numbers (e.g., 1.10, 1000)
A long trading setup into these areas of market importance may result in an overhead resistance, or a short trade into a potential area of support may reduce the probability of a continuation of that price move before the trade even starts.
Market Structure
Structure is the visual rhythm of price that you may see on the chart. It involves the sequences of trader impulses and corrections that end up defining the overall direction and the likelihood of continuation:
Uptrend: Higher highs (HH) and higher lows (HL)
Downtrend: Lower highs (LH) and lower lows (LL)
Transition: Break in structure often followed by a retest of previous levels.
A pullback in an uptrend followed by renewed buying pressure over a previous price swing high point may well constitute a higher-probability buy than a random candle pattern in the middle of nowhere.
Compression and Expansion
Markets move through cycles of energy build-up and release. It is a reflection of the repositioning of asset holdings, subtle institutional accumulation, or a response to new information, and may all result in different, albeit temporary, broad price scenarios.
Compression: Evidenced by a tightening range, declining ATR, smaller candles, and so suggesting a period of indecision or exhaustion of a previous price move,
Expansion: Evidenced by a sudden breakout, larger candle bodies, and a volume spike, is suggestive of a move that is now underway.
A breakout that clears a liquidity zone often runs further, as ‘trapped’ traders may further fuel the move as they scramble to reposition.
A setup aligned with such liquidity flows may carry a higher probability than one trading directly into it.
Confluence
Confluence is the art of layering independent evidence to create a whole story. Think of it as a type of “market forensics” — each piece of confirmation evidence may offer a “better hand’ or further positive alignment for your idea.
There are three noteworthy types of confluence:
Technical Confluence – Multiple technical tools agree with your trading idea:
Moving average alignment (e.g., 20 EMA above 50 EMA) for a long trade
A Fibonacci retracement level is lining up with a previously identified support level.
Momentum is increasing on indicators such as the MACD.
Multi-Timeframe Confluence – Where a lower timeframe setup is consistent with a higher timeframe trend. If you have alignment of breakout evidence across multiple timeframes, any move will often be strengthened by different traders trading on different timeframes, all jumping into new trades together.
3. Volume Confluence – Any directional move, if supported by increasing volume, suggests higher levels of market participation. Whereas falling volume may be indicative of a lesser market enthusiasm for a particular price move.
Confluence is not about clutter on your chart. Adding indicators, e.g., three oscillators showing the same thing, may make your chart look like a work of art, but it offers little to your trading decision-making and may dilute action clarity.
Think of it this way: Confluence comes from having different dimensions of evidence and seeing them align. Price, time, momentum, and participation (which is evidenced by volume) can all contribute.
Timing & Execution
An alignment in context and structure can still fail to produce a desired outcome if your timing is not as it should be. Execution is where higher probability traders may separate themselves from hopeful ones.
Entry Timing
Confirmation: Wait for the candle to close beyond the structure or level. Avoid the temptation to try to jump in early on a premature breakout wick before the candle is mature.
Retests: If the price has retested and respected a breakout level, it may filter out some false breaks that we will often see.
Then act: Be patient for the setup to complete. Talking yourself out of a trade for the sake of just one more candle” confirmation may, over time, erode potential as you are repeatedly late into trades.
Session & Liquidity Windows
Markets breathe differently throughout the day as one session rolls into another. Each session's characteristics may suit different strategies.
For example:
London Open: Often has a volatility surge; Range breaks may work well.
New York Overlap: Often, we will see some continuation or reversal of morning trends.
Asian Session: A quieter session where mean-reversion or range trading approaches may do well
Trade Management
Managing the position well after entry can turn probability into realised profit, or if mismanaged, can result in losses compounding or giving back unrealised profit to the market.
Pre-defined Invalidation
Asking yourself before entry: “What would the market have to do to prove me wrong?” could be an approach worth trying.
This facilitates stops to be placed logically rather than emotionally. If a trade idea moves against your original thinking, based on a change to a state of unalignment, then considering exit would seem logical.
Scaling & Partial Exits
High-probability trade entries will still benefit from dynamic exit approaches that may involve partial position closes and adaptive trailing of your initial stop.
Trader Psychology
One of the most important and overlooked components of a higher-probability setup is you.
It is you who makes the choices to adopt these practices, and you who must battle the common trading “demons” of fear, impatience, and distorted expectation.
Let's be real, higher-probability trades are less common than many may lead you to believe.
Many traders destroy their potential to develop any trading edge by taking frequent low-probability setups out of a desire to be “in the market.”
It can take strength to be inactive for periods of time and exercise that patience for every box to be ticked in your plan before acting.
Measure “You” performance
Each trade you take becomes data and can provide invaluable feedback. You can only make a judgment of a planned strategy if you have followed it to the letter.
Discipline in execution can be your greatest ally or enemy in determining whether you ultimately achieve positive trading outcomes.
Bringing It All Together – The Setup Blueprint
Final Thoughts
Higher-probability setups are not found but are constructed methodically.
A trader who understands the “higher-probability anatomy” is less likely to chase trades or feel the need to always be in the market. They will see merit in ticking all the right boxes and then taking decisive action when it is time to do so.
It is now up to you to review what you have in place now, identify gaps that may exist, and commit to taking action!
One of the most impactful books I’ve ever read is “The 7 Habits of Highly Effective People: Powerful Lessons in Personal Change” by Stephen Covey.
When it was first published in 1989, it quickly became one of the most influential works in business and personal development literature, and retained its place on bestseller lists for the next couple of decades.
The compelling, comprehensive, and structured framework for personal growth presented in the book has undoubtedly inspired many to rethink how they organise their lives and priorities, both professionally and personally.
Although its lessons were originally designed for self-improvement and positive structured growth, the underlying principles are universal, making them easily transferable to many areas of life, including trading.
In this article, you will explore how each of Covey’s seven original habits can be reframed within a trading context, in an attempt to offer a structure that may help guide you to becoming the best trader you can be.
1. Be Proactive
Being proactive means recognising that we have the power to choose our responses and to shape outcomes through appropriate preparation with subsequent planned reactions.
In a Trading Context:
For traders, this means anticipating potential problems before they arise and putting measures in place to better mitigate risk.
Rather than waiting for issues to unfold, the proactive trader identifies potential areas of concern and ensures that they have access to the right tools, resources, and people to prepare effectively, whatever the market may throw at them.
What This Means for You:
Being proactive may involve seeking out quality education and services, maintaining access to accurate and timely market information, continually assessing risk and opportunity, and having systems to manage those risks within defined limits.
Consequences of Non-Action:
Inadequate preparation and a lack of defined systems often lead to poor trading decisions and less-than-desired outcomes.
Failing to assess risk properly can result in significant and often avoidable losses.
By contrast, a proactive approach builds resilience and confidence, ensuring that when challenges arise, your response is measured and less emotionally driven by what is happening on the screen in front of you.
2. Begin with the End in Mind
Covey's second habit is about defining purpose. It suggests that effective people are more likely to achieve what is possible if they start with a clear understanding of their destination, so every action aligns with that ultimate vision.
In a Trading Context:
Ask yourself: What is my true purpose for trading?
Many traders may instinctively answer “to make money,” but money is surely only a vehicle to achieve something else in your world for you and those you care about, not a purpose per se.
You need to clarify what trading success really means for you.
Is it a greater degree of financial independence through increased income or capital growth, the freedom of having more time, achieving a personal challenge of becoming an effective trader, or a combination of any of these?
What This Means to You:
Try framing your purpose as, “I must become a better trader so that I can…” and complete a list with your genuine reasons for tackling the market and its challenges.
This helps you establish meaningful short-term development goals that keep you moving toward your vision. Keep that purpose visible, as a note near your trading screen that reminds you why you are doing this.
Consequences of Non-Action:
Traders with a clearly defined purpose are more likely to stay disciplined and consistent.
Those without one often drift, chasing short-term gains without direction. There is ample evidence that formalising your development in whatever context through goal setting can significantly increase the likelihood of success. Why would trading be any different?
Surely the bottom-line question to ask yourself is, “Am I willing to risk my potential by trading without purpose?”
3. Put First Things First
This habit is about time management and prioritisation. This involves focusing your efforts and energy on what truly matters. As part of the exploration of this concept, Covey emphasised distinguishing between what is important and what is merely urgent.
In a Trading Context:
Trading demands commitment, learning, and reflection.
It is not just about screen time but about using that time effectively.
Managing activities to ensure your effort is spent wisely on planning, measuring, journaling and performance evaluation, and refining systems, accordingly, are all critical to sustaining both improvements in results and balance.
What This Means to You:
Traders often believe they need to spend more time trading when what they really need is to focus on better time allocation.
It is logical to suggest that prioritising activities that can often contribute directly to improvement, such as system testing, reviewing performance, analysing results, and refining your strategy, is worthwhile.
These high-value tasks can help traders focus their time more deliberately and systematically.
Consequences of Non-Action:
If you fail to control your trading time effectively, you will be more likely to spend much of it on low-impact activities that produce little progress.
Over time, this not only hurts your results but also reduces the real “hourly value” of your trading effort.
In business terms, and of course, you should be treating your trading as you would any business activity; poor prioritisation can inflate your costs and diminish your potential trading outcomes.
4. Think Win: Win
Covey's fourth habit encouraged an attitude of mutual benefit, where seeking solutions that facilitate positive outcomes for all parties.
In a Trading Context:
In trading, this concept must be adapted to suggest that developing a mindset that recognises every well-executed plan as a win, even when an individual trade results in a loss.
Some trading ideas will simply not work out, and so some losses are inevitable, but if they remain within defined limits, they should not be viewed as failures but rather as a successful adherence to a trading plan. In the aim of developing consistency in action, and the widely held belief that this is one of the cornerstones of effective trading, then it surely is a win to fulfil this.
So, in simple terms, the real “win” lies in a combination of maintaining discipline, following your system, and controlling risk beyond just looking at the P/L of a single trade.
What This Means to You:
Building and trading clear, unambiguous systems that you follow consistently has got to be the goal.
This process produces reliable data that you can later analyse and subsequently use to refine specific strategies and personal performance.
When you do this, every outcome, whether profit or loss, can serve as valuable feedback.
For example, a controlled loss that fits your plan is proof that your system works and that you are protecting your capital.
Alternatively, a trailing stop strategy, which means you exit trades in a timely way and give less profit back to the market, provides positive feedback that your system has merit in achieving outcomes.
Consequences of Non-Action:
Without this mindset shift, traders can become emotionally reactive, interpreting normal drawdowns as personal defeats.
This fosters loss aversion and other biases that can erode decision-making quality if left unchecked. Through the process of redefining “winning,” you are potentially safeguarding both your capital and, importantly, your trading confidence (a key component of trading discipline).
5. Seek First to Understand and Then Take Action
Covey's fifth habit emphasises empathy, the act of listening and aiming to fully understand before responding. In trading, this principle translates to understanding the market environment before taking any action.
In a Trading Context:
Many traders act impulsively, driven by excitement or fear, which often results in entering trades without taking into account the full context of what is happening in the market, and/or the potential short-term influences on sentiment that may increase risk.
This “minimalisation bias,” defined as acting on limited information, will rarely produce consistent results. Instead, adopt a process that begins with observation and comprehension.
What This Means to You:
Establishing a daily pre-trading routine is critical. This may include a review of key markets, sentiment indicators, and potential catalysts for change, such as imminent key data releases. Understanding what the market is telling you before you decide what to do is the aim of having this sort of daily agenda.
This approach may not only improve trade selection but also enable you to get into a state of psychological readiness that can facilitate decision-making quality throughout the session.
Consequences of Non-Action:
Failing to prepare for the trading day ahead can mean not only exposing yourself to unnecessary risk but also arguably being more likely to miss potential opportunities.
A trader who acts without understanding is vulnerable both psychologically and financially. Conversely, being forewarned is being forearmed. When you aim to understand markets first before any type of trading activity, your actions are more likely to be deliberate, grounded, and more effective.
6. Synergise
Synergy in Covey's model means valuing differences and combining the strengths of those around you to create outcomes greater than the sum of their parts.
In a Trading Context:
In trading, synergy refers to the integration of multiple systems and disciplines that work together. This includes your plan, your record keeping and performance management processes, your time management, and your emotional balance.
No single system is enough; success comes from the synergy of elements that support and inform one another.
What This Means to You:
Integrating learning and measurement is an integral part of your trading development process. Journaling, for example, allows you to assess not only your technical performance but also your behavioural consistency.
This self-awareness allows you to refine your plan and so helps you operate with greater confidence.
The synergy between rational analysis and emotional composure is what is more likely to lead to consistently sound trading decisions.
Consequences of Non-Action:
When logic and emotion are out of balance, decision-making will inevitably suffer.
If your systems are incomplete, ambiguous, or poorly connected to the reality of your current level of understanding, competence and confidence, your results are likely to be inconsistent. Building synergy across all areas of your trading practice, including that of evaluation and development in critical trading areas, will help create cohesion, efficiency, and better performance.
7. Sharpen the Saw
Covey's final habit focuses on continuous learning and refinement, including maintaining and improving the tools at your disposal and skills and knowledge that allow you to perform effectively.
In a Trading Context:
In trading, this translates to creating a plan to achieve ongoing, purposeful learning.
Even small insights can make a large difference in results. Effective traders continually refine their knowledge, ask new questions, and apply lessons from experience.
What This Means to You:
Trading learning can, of course, take many forms. Discovering new indicators that may offer some confluence to price action, testing different strategies, exploring new markets, or simply understanding more about yourself as a trader.
There is little doubt that active participation in learning keeps you engaged, adaptable and sharp. Even making sure you ask at least one question at a seminar or webinar or making a simple list at the end of each session of the "3 things I learned", can be invaluable in developing momentum for your growth as a trader.
Your record-keeping and performance metrics should generate fresh questions that can guide future development.
Consequences of Non-Action:
Without direction in your learning, your progress is likely to slow.
I often reference that when someone talks about trading experience in several years, this is only meaningful if there has been continuous growth, rather than staying in the same place every year (i.e. only one year of meaningful experience)
Passive trading learning, for example, reading an article without applying, watching a webinar without engagement, or measuring without closing the circle through putting an action plan together for your development, can all lead to stagnation.
It is fair to suggest that taking shortcuts in trading learning is likely to translate directly into shortcuts in result success.
Active, focused development is essential for sustained improvement.
Are You Ready for Action?
Stephen Covey’s The 7 Habits of Highly Effective People presented a timeless model for self-development and purposeful living.
When applied to trading, these same habits form a powerful framework for consistency, focus, and growth.
Trading is a pursuit that demands both technical skill and emotional strength. Success is rarely about finding the perfect system, but about developing the right habits that support consistent, rational decision-making over time.
By integrating the principles of Covey’s seven habits into your trading practice, you create a foundation not only for profitability but for continual personal growth.
As ações de defesa da ASX estão de volta em mais listas de observação e, de acordo com o Instituto Internacional de Pesquisa da Paz de Estocolmo (SIPRI), os gastos militares globais atingiram aproximadamente USD 2,718 trilhões em 2024, um aumento de 9,4% em termos reais.
As configurações atuais de defesa da Austrália estão definidas na Estratégia Nacional de Defesa de 2024 e nos documentos de planejamento de investimento relacionados, que descrevem as prioridades de financiamento de capacidades de longo prazo. Além disso, Canberra apontou um investimento de capacidade de 330 bilhões de dólares australianos até 2034, incluindo financiamento adicional para combatentes de superfície, preparação, ataques de longo alcance e sistemas autônomos.
Aqui está a parte que a maioria das pessoas perde: nem todas as ações de defesa da ASX são negociadas da mesma forma. Alguns ficam perto da construção naval. Alguns são nomes de contra-drones e alguns são operadores menores e de alto risco, onde um contrato pode importar muito mais do que o mercado supõe.
Esses cinco nomes não são uma lista de compras, mas sim uma lista prática para investidores que tentam entender onde o impulso de compras pode realmente aparecer no ASX.
1) Austal (ASX: ASB)
A Austal é uma das empresas listadas na ASX mais diretamente expostas ao gasoduto de construção naval da Austrália, embora a execução do contrato, as margens e o prazo de entrega continuem sendo variáveis importantes.
Eles não estão apenas ganhando contratos aleatórios; eles assinaram um grande acordo legal (o Acordo Estratégico de Construção Naval) que os torna parceiros oficiais para construir a próxima geração de navios militares de médio porte da Austrália na Austrália Ocidental.
Em fevereiro de 2026, o governo deu luz verde à Austal para um projeto de 4 bilhões de dólares. Isso não é para apenas um navio, é para 8 navios “Landing Craft Heavy”. São enormes navios de transporte (cerca de 100 metros de comprimento) projetados para transportar tanques pesados e equipamentos diretamente para a praia. Mas aqui está a parte que a maioria das pessoas perde: a construção naval é uma maratona, não um sprint.
Como você pode ver no cronograma de entrega, embora a construção comece em 2026, o navio final não será entregue até 2038. Para um investidor, isso significa que a Austal tem um fluxo de renda “garantido” para os próximos 12 anos, mas ele precisa ser muito bom em gerenciar seus custos durante esse longo período para realmente obter lucro.
2) DroneShield (ASX: DRO)
Se você já viu imagens de pequenos drones interrompendo campos de batalha modernos, o DroneShield está construindo parte do “botão de desligamento”. Seu foco é a tecnologia de combate a drones, incluindo sistemas que detectam, interrompem ou derrotam drones usando guerra eletrônica, sensores e ferramentas baseadas em software, em vez de depender apenas de munições tradicionais.
No início de 2026, a DroneShield deixou de ser uma startup promissora e entrou em uma fase comercial muito maior. Ela registrou uma receita do ano fiscal de 2025 de A $216,5 milhões, um aumento de 276% em relação ao ano fiscal de 2024, e disse que iniciou o ano fiscal de 2026 com A $103,5 milhões em receita comprometida.
Um ponto que o mercado pode ignorar é a camada de software no modelo. A DroneShield registrou receita de A $11,6 milhões em software como serviço (SaaS) no ano fiscal de 2025 e disse que está trabalhando para que o SaaS represente 30% da receita em cinco anos. Seu modelo de assinatura inclui atualizações de software para sistemas implantados, o que adiciona um fluxo crescente de receita recorrente junto com as vendas de hardware.
Entre as ações de defesa da ASX, a DroneShield é uma das formas mais diretas de seguir o tema Counter-UAS. É também um dos nomes em que o sentimento pode oscilar rapidamente, porque as histórias de crescimento podem aumentar e diminuir quando o tempo do pedido muda.
A EOS constrói tanto o “cérebro” quanto o “músculo” para plataformas militares. É mais conhecido por sistemas de armas remotas, que permitem aos operadores controlar torres armadas de dentro de veículos protegidos, e por sistemas de laser de alta energia voltados para a defesa contra drones. A EOS disse que seu acúmulo incondicional atingiu cerca de A $459,1 milhões no início de 2026, após uma série de vitórias de contratos até 2025. Isso aponta para uma base muito maior de trabalho seguro, embora o tempo de entrega e a conversão de receita ainda sejam importantes.
A EOS assinou um contrato de €71,4 milhões, cerca de A $125 milhões, com um cliente europeu para um sistema de armas a laser de alta energia de 100 quilowatts. A EOS afirma que o sistema foi projetado para um baixo custo por tiro e pode acionar até 20 drones por minuto. O governo australiano reservou A $1,3 bilhão em 10 anos para a aquisição de capacidade de combate a drones, e a EOS divulgou que fez parte de uma equipe bem-sucedida de licitação do LAND 156. Isso não garante receita futura, mas dá suporte à visibilidade de médio prazo em um mercado que a empresa já tem como alvo.
A EOS parece uma história de recuperação, mas que ainda depende da execução. A empresa se reorientou em torno de sistemas de armas remotas, sistemas de combate a drones e lasers, todas áreas vinculadas a maiores gastos com defesa. A questão principal é se ela pode continuar convertendo o acúmulo e o pipeline em receita gerada e, ao mesmo tempo, manter a disciplina do balanço patrimonial.
4) Codan (ASX: CDA)
Às vezes, a Codan fica de fora das listas casuais de ações de defesa porque é mais diversificada. Isso pode ser um descuido. Em seus resultados do primeiro semestre do ano fiscal de 26, a Codan disse que sua empresa de comunicações projeta comunicações de missão crítica para os mercados globais de segurança pública e militar. A receita de comunicações aumentou 19% para A $221,8 milhões. A empresa também disse que a DTC gerou um forte crescimento da demanda de defesa e sistemas não tripulados, com a receita de sistemas não tripulados aumentando 68%, para A $73 milhões. Codan disse que cerca de metade dessa receita não tripulada estava vinculada a aplicações de defesa operacional em zonas de conflito.
É aqui que a história se torna mais matizada. Em uma cesta de ações de defesa da ASX, a Codan pode oferecer um perfil diferente, com menos sensibilidade pura às manchetes, maior diversificação operacional e exposição significativa a comunicações militares e sistemas não tripulados, sem ser um nome de tema único. Essa diversificação também pode significar que as ações nem sempre são negociadas como um nome de defesa puro.
A HighCom está no final especulativo desta lista e deve ser rotulada dessa forma. A empresa afirma que seus dois negócios contínuos são a HighCom Armor, que fornece proteção balística, e a HighCom Technology, que fornece e mantém sistemas aéreos não tripulados de pequeno e médio porte, sistemas aéreos contra-não tripulados e suporte relacionado de engenharia, integração, manutenção e logística para o ADF e outras forças armadas regionais alinhadas.
No primeiro semestre do ano fiscal de 26, a receita de operações contínuas caiu 59% para A $10,9 milhões, enquanto o EBITDA passou para uma perda de A $5,4 milhões em relação ao lucro de A $1,9 milhão no ano anterior. A HighCom também divulgou A $5,1 milhões em receita de tecnologia HighCom, incluindo A $3,5 milhões de peças de reposição para pequenos sistemas aéreos não tripulados (SUAS) e A $1,6 milhão de serviços de sustentação fornecidos ao Departamento de Defesa da Austrália.
Então, sim, a HighCom é uma das ações de defesa ASX mais sensíveis financeiramente no conselho. Mas também é o tipo de nome menor que pode mostrar como as compras se transformam em equipamentos de suporte, sustentação e proteção especializados.
Principais observações do mercado
Acompanhe os marcos do programa, não apenas as manchetes políticas. A adjudicação de contratos, o início da fabricação, os cronogramas de entrega e o trabalho de manutenção geralmente importam mais do que um único dia de anúncio.
Separe a exposição pura da exposição diversificada. O DroneShield e o EOS estão mais próximos de temas concentrados de tecnologia de defesa, enquanto o Codan traz exposição às comunicações em um mix de negócios mais amplo.
Assista aos temas de capacidade soberana na Austrália. A Austal e a EOS estão vinculadas à fabricação local, à integração e às cadeias de suprimentos australianas, o que apóia o tema mais amplo de capacidade soberana desse grupo.
Preste atenção aos balanços e à conversão de caixa. O ímpeto de compras pode ser real mesmo quando o tempo fica confuso. A última metade da HighCom é um lembrete disso.
As manchetes de defesa podem parecer imediatas. Os ganhos geralmente não são. O principal trabalho naval da Austal se estende até a próxima década. Os contratos EOS são entregues ao longo de vários anos. O fluxo de pedidos da DroneShield parece forte, mas a empresa ainda separa a receita comprometida de uma oportunidade mais ampla de pipeline. HighCom mostra o outro lado da moeda. A exposição à aquisição não se traduz automaticamente em uma execução financeira tranquila.
As referências a ações de defesa listadas na ASX são apenas informações gerais, não uma recomendação para comprar, vender ou manter qualquer título ou CFD. Essas ações podem ser altamente voláteis e sensíveis ao prazo do contrato, à política governamental, à geopolítica, ao risco de execução e às condições do mercado. Expectativas de backlog, pipeline e receita não são garantias de desempenho futuro.
Três bancos centrais estão decidindo as taxas simultaneamente, o petróleo Brent está oscilando em torno de USD 100 o barril e uma guerra no Oriente Médio está reescrevendo as perspectivas de inflação em tempo real. O que quer que aconteça nesta semana pode definir o tom dos mercados para o resto de 2026.
Fatos rápidos
O Banco da Reserva da Austrália (RBA) anuncia sua próxima decisão sobre a taxa de caixa na terça-feira, com os mercados agora precificando 66% de chance de um segundo aumento para 4,1%.
Alguns analistas alertaram que a guerra do Irã pode empurrar a inflação dos EUA para 3,5% até o final do ano e atrasar os cortes nas taxas do Fed até setembro, tornando o gráfico de pontos do FOMC desta semana o mais observado em anos.
O petróleo Brent está flertando com USD 100 o barril depois que o Irã lançou o que a mídia estatal descreveu como sua “operação mais intensa desde o início da guerra”.
RBA: A Austrália voltará a caminhar?
O RBA elevou a taxa de caixa pela primeira vez em dois anos para 3,85% em sua reunião de fevereiro, depois que a inflação aumentou materialmente no segundo semestre de 2025.
A questão agora é se ele se move novamente antes mesmo de ver a próxima impressão trimestral do IPC, que só deve ser divulgada em 29 de abril.
O vice-governador Andrew Hauser reconheceu antes da reunião que os formuladores de políticas enfrentam uma decisão genuinamente dividida, moldada por sinais econômicos conflitantes em casa e pela crescente instabilidade no exterior.
Atualmente, os mercados financeiros atribuem cerca de 66% de probabilidade a outro aumento, com um aumento de maio considerado praticamente certo, independentemente do que aconteça na segunda-feira.
Datas importantes
Decisão sobre a taxa de caixa do RBA: Terça-feira, 17 de março, 14h30 AEDT
Conferência de imprensa do governador Bullock: Terça-feira, 17 de março, 15:30 AEDT
Monitor
Qualquer referência de Bullock a novas subidas será provável em maio
FOMC: É provável que todos os olhos estejam voltados para o gráfico de pontos
O FOMC se reúne de 17 a 18 de março, com a declaração de política agendada para 14h ET em 18 de março e a coletiva de imprensa do presidente Jerome Powell às 14h30. O CME FedWatch mostra uma probabilidade de 99% de que o Fed mantenha taxas de 3,50% a 3,75%.
A ação real está no Resumo das Projeções Econômicas (SEP) e no gráfico de pontos. O ponto médio atual mostra um corte de 25 pontos base para 2026. Se passar para dois cortes, isso é dovish e otimista para ativos de risco. Se mudar para zero cortes ou adicionar um aumento da taxa à projeção, os mercados poderão reagir na outra direção.
Para complicar ainda mais as coisas, o mandato de Powell como presidente do Federal Reserve expira em 23 de maio de 2026. Kevin Warsh é o principal candidato para substituí-lo, visto como mais agressivo em política monetária. Qualquer comentário de Powell sobre essa transição poderia movimentar os mercados independentemente da decisão de taxa em si.
Data chave
Decisão de taxa do FOMC + Gráfico de SEP/ponto: Quinta-feira, 19 de março, 4:00 AEDT
Conferência de imprensa de Powell: Quinta-feira, 19 de março, 4h30 AEDT
Monitor
A linguagem de Powell sobre petróleo e inflação tarifária.
Reação de rendimento do Tesouro em 2 anos.
A reprecificação do CME FedWatch para qualquer mudança na probabilidade de redução de setembro.
Banco do Japão: um maior aperto pode ser antecipado
O BOJ se reúne de 18 a 19 de março, com a decisão prevista para quinta-feira de manhã, horário de Tóquio. A taxa de política atual está em 0,75% (uma alta de 30 anos), e a reunião de janeiro de 2026 resultou na suspensão de uma votação de 8 a 1.
O governador Ueda classificou a reunião de março como “ao vivo”, observando que o cronograma para um maior aperto poderia ser “antecipado” se as negociações salariais de primavera da Shunto produzirem resultados mais fortes do que o esperado.
Esses resultados devem começar a chegar durante a semana, tornando-os a contribuição crítica para a decisão do BOJ. Nomura espera que os aumentos salariais da Shunto em 2026 cheguem em torno de 5,0%, incluindo a antiguidade, com um crescimento do salário base de aproximadamente 3,4%. Se os resultados confirmarem essa trajetória, o argumento de uma alta em março se fortalece consideravelmente.
A complicação é o cenário global. O Japão importa cerca de 90% de suas necessidades de energia, e o petróleo em torno de USD 100 por barril está elevando os custos de importação e ameaçando aumentar a pressão inflacionária. Um aumento do BOJ em um choque global do petróleo seria uma medida excepcionalmente ousada.
A maioria dos participantes do mercado ainda deseja aguardar esta reunião, com abril ou julho vistos como o momento mais provável para o próximo movimento.
Data chave
Decisão sobre a taxa de política do BOJ (atualmente 0,75%): Quinta-feira, 19 de março, manhã AEDT
Monitor
Os resultados salariais de Shunto são o principal gatilho para um aumento em março.
Linguagem da conferência de imprensa de Ueda e orientação futura em abril e julho.
O petróleo Brent atingiu brevemente USD 119,50 por barril no início da semana, antes de cair 17% para menos de USD 80, depois se recuperando para USD 95 em sinais mistos de Washington sobre o Estreito de Ormuz.
Na quinta-feira, o Brent estava de volta com mais de USD 100 quando o Irã lançou novos ataques contra o transporte comercial e a liberação da reserva da AIE não trouxe alívio significativo.
No cenário em que um conflito mais longo inflige danos à infraestrutura de energia, analistas estimam que o IPC pode subir para 3,5% até o final de 2026, com os preços da gasolina se aproximando de USD 5 por galão no segundo trimestre.
Para esta semana, o petróleo atua como uma macro metavariável. Cada manchete geopolítica, sinal de cessar-fogo, ataque de petroleiro, liberação de reserva e comentário de Trump poderiam movimentar ações, títulos e moedas em tempo real.
Monitor
Qualquer retomada do fluxo de petroleiros do Estreito de Ormuz.
Os ataques dos EUA e Israel contra o Irã lançados em 28 de fevereiro fizeram com que o petróleo Brent passasse de USD 119 o barril, o ouro acima de USD 5.200 e ações de defesa para recordes históricos.
Nesse contexto, os investidores estão se concentrando em um pequeno grupo de nomes vinculados a commodities que podem permanecer sensíveis a novos movimentos em petróleo, GNL e ouro. A questão chave é se o choque se mostra sustentado ou se um cessar-fogo, a normalização do transporte marítimo ou uma ação política removem parte do prêmio de risco geopolítico.
1. ExxonMobil (NYSE: XOM)
A ExxonMobil tem sido uma das mais claras beneficiárias do aumento de preços. As ações atingiram um recorde de USD 159,60 no início de março e subiram aproximadamente 28% no acumulado do ano.
A empresa produz 4,7 milhões de barris de óleo equivalente por dia, tem um ponto de equilíbrio na Bacia do Permiano de cerca de USD 35/barril e está comprometida com USD 20 bilhões em recompras até 2026.
O Wells Fargo elevou sua meta de preço para USD 183 de USD 156 após a escalada, enquanto o consenso mais amplo dos analistas está em torno de USD 140 a $144. No entanto, a XOM já está negociando acima de muitas metas consensuais, e a interrupção de sua parceira de GNL, a QatarEnergy, representa um obstáculo operacional de curto prazo.
O que assistir
Se as interrupções do Ormuz persistem além de 4 a 6 semanas.
A liberação emergencial do estoque do G7 ou um cessar-fogo confiável podem reduzir o prêmio de risco de guerra.
Quaisquer ajustes nas metas de consenso dos analistas.
A Chevron atingiu uma nova alta de 52 semanas de USD 196,76 no início de março e aumentou aproximadamente 24% no acumulado do ano.
O ponto de equilíbrio do Brent da empresa para dividendos e despesas de capital é de cerca de USD 50/barril. Isso significa que, com os preços atuais do petróleo acima de USD 90, ele está gerando um fluxo de caixa livre significativo.
No entanto, a Chevron interrompeu temporariamente as operações em um campo de gás na costa de Israel após a atividade de mísseis na região, e desde então as ações recuaram mais de 1%, já que o conflito afeta diretamente suas operações.
O que assistir
Atualizações operacionais diretas dos ativos da Chevron no Oriente Médio e em Israel.
Quaisquer novas paradas que possam pesar na produção de curto prazo.
Participação de petróleo bruto acima de USD 90, o que mantém a Chevron gerando fluxo de caixa livre significativo.
3. Woodside Energy (ASX: WDS/NYSE: WDS)
Com o Catar interrompendo a produção após ataques de drones iranianos, compradores na Ásia e na Europa estão lutando por suprimentos alternativos. A Woodside, como uma das maiores produtoras e exportadoras de GNL da Austrália, está fora da zona de conflito e está bem posicionada para se beneficiar da demanda redirecionada.
Os analistas alertam que a substituição real leva tempo devido às restrições de envio e contrato, o que significa que o aumento do preço pode ser mais durável do que uma simples negociação à vista. Os preços do gás de referência europeu TTF subiram mais de 50% em uma semana, ampliando o ambiente de margem para produtores de GNL fora do Oriente Médio.
O que assistir
O ritmo e o cronograma de qualquer reinício da produção de GNL do Catar.
Se a QatarEnergy permanecer off-line por semanas, a Woodside poderá começar a recontratar compradores europeus a preços spot elevados.
Uma alta do dólar australiano pode ser um obstáculo que vale a pena acompanhar os ganhos denominados em USD.
4. Cheniere Energy (NYSE: GNL)
Juntamente com a Woodside, Cheniere é a beneficiária mais direta dos EUA da interrupção do GNL no Catar. Como maior exportador de GNL dos Estados Unidos, viu força intradiária no início da semana do conflito.
A produção doméstica de energia dos EUA protegeu os consumidores americanos do pior choque, mas o prêmio de exportação aumentou à medida que compradores europeus e asiáticos pagam pelo fornecimento fora do Golfo.
O comércio é “geopoliticamente sensível” e qualquer resolução pode reverter a vantagem rapidamente. Mas enquanto a infraestrutura de gás de Hormuz e do Golfo permanecer comprometida, Cheniere está posicionada para se beneficiar estruturalmente.
O que assistir
Qualquer avanço diplomático que reabra as rotas marítimas do Golfo.
Anúncios de novos contratos de aquisição de longo prazo assinados a preços elevados atuais.
O ouro subiu 5,2% em uma única sessão em 1º de março, atingindo USD 5.246/onça, à medida que os mercados buscavam ativos seguros. A Newmont, a maior produtora de ouro do mundo, viu suas reservas efetivamente reavaliadas a esses preços.
Ele está em alta junto com o ganho de 24% do ouro no acumulado do ano, e seus custos totais de sustentação permanecem praticamente fixos.
No entanto, as mineradoras de ouro se venderam drasticamente em 4 de março, e a Newmont caiu quase 8% em uma única sessão, à medida que uma desalavancagem mais ampla do risco atingiu as ações de metais preciosos.
As ações se recuperaram desde então, mas a volatilidade continua alta. Para investidores de longa duração, analistas observam que jurisdições de mineração “seguras”, como Canadá, Austrália e Nevada, estão cobrando novos prêmios à medida que a instabilidade no Oriente Médio aumenta o valor do fornecimento geopoliticamente seguro.
O que assistir
Se o ouro pode se manter acima de USD 5.000/onça.
Um conflito prolongado pode acelerar um ciclo de fusões e aquisições em mineradores de ouro juniores.
Um cessar-fogo ou um amplo evento de desalavancagem de ações como o principal risco a ser monitorado.
A Lockheed Martin atingiu um novo recorde histórico de USD 676,70 em 3 de março, um aumento de mais de 4% no dia. Seus caças F-35, munições guiadas com precisão, sistemas THAAD e artilharia de foguetes HIMARS são fundamentais para a campanha aérea em andamento.
O Departamento de Defesa dos EUA está se movendo para reabastecer os estoques de munições, e a ambição declarada de Trump de aumentar o orçamento de defesa dos EUA para USD 1,5 trilhão até 2027 acrescenta um vento favorável estrutural de longo prazo além do conflito imediato.
As ações de defesa estão subindo em meio aos preços clássicos de risco geopolítico, mas os investidores devem observar que o fluxo real de contratos leva tempo para se traduzir em lucros, e as avaliações já refletem um otimismo considerável.
O que assistir
O ritmo das ordens de reabastecimento de munições do Departamento de Defesa dos EUA.
A rapidez com que as vitórias de contratos se traduzem em crescimento da carteira de pedidos.
Barrick está acompanhando a corrida histórica do ouro ao lado da Newmont, com as ações subindo acentuadamente no acumulado do ano. Ela tem uma capitalização de mercado de aproximadamente USD 78 bilhões e está relatando projeções recordes de fluxo de caixa livre, já que seus custos totais de sustentação permanecem bem abaixo dos preços à vista atuais.
Como a Newmont, ela experimentou uma forte liquidação em uma única sessão de mais de 8% durante o evento mais amplo de desalavancagem de 4 de março, antes de se recuperar parcialmente.
Empresas de royalties e streaming, como a Wheaton Precious Metals (WPM), estão sendo preferidas por alguns investidores como uma forma mais protegida contra a inflação de acessar o ouro, dada sua menor exposição aos custos operacionais. Mas a Barrick continua sendo uma das maiores mineradoras de ouro listadas do mundo, com ganhos altamente sensíveis às mudanças no preço do ouro
O que assistir
A capacidade do ouro de se manter acima de USD 5.000/onça.
Qualquer Barrick avança em direção a aquisições de mineradores juniores.
Inflação dos custos de energia, já que o aumento dos preços dos combustíveis pode começar a reduzir as margens operacionais das mineradoras.


.jpg)
.jpg)


