Trading Share CFDs gives you exposure to the movement of underlying shares. There are a few issues that are specific to Share CFDs and differ from for example trading Forex or commodity CFDS. One of these issues is that of company dividends.
This article aims to clarify the potential impact of dividends of the CFD trader. How do dividends work? One of the attractive things as a shareholder is the receipt of company dividends.
Many Australian companies pay such dividends twice a year, calculated at X cents/per share multiplied by the number of shares held. The key date in respect of dividend entitlement is the ex-dividend date, with eligibility for the dividend being dependent upon you holding a position in that share before trading commencing on the “ex-dividend” date. These dates, and the dividend amount per share, are pre-determined by the company and are made available in the public domain (usually confirmed in company reports) and are available across many financial websites.
Also, important to understand is this dividend is “priced in” to the share already the underlying share price is expected to open at closing price minus the dividend paid (of course there are other factors pre-open e.g., economic news overnight, which will also impact but in this article we are focusing on the dividend impact). Hence if the dividend per share is 20c then we would expect the underlying share to open 20 cents lower. CFDs and dividends As a CFD trader, you do not own the underlying asset (in this case the shares), rather you have a contract based on the movement of such and hence you will not be able to receive any benefits of “franking credits’ for tax purposes.
However, there is an adjustment made on your CFD account position relating to dividend. Whether this adjustment is shown as a credit or a debit will be dependent on the direction of your trade. Long trades will attract a credit and short trades a debit adjustment.
A dividend trading strategy There are some traders of shares, options and CFDs that look to develop a specific trading strategy for dividends and CFDs. Generally, this involves entering a long position prior to the ex-dividend date and subsequently selling afterwards looking for either a small drop less than the dividend adjustment or a recovery or greater move higher than the price prior to the ex-dividend date. Theoretically, the reverse could also be the case in that a short trade is entered, with the perception that many will sell after the ex-dividend date, once a dividend has been received, to the extent that this drop will exceed the dividend adjusted debit to the CFD position.
In either case, if you are considering these somewhat advanced strategies, logically you have tested a system which not only identifies potential situations but guides your entry and exit timing and decision-making. Further discussion on this may be included in a further article. We trust that has clarified the dividend treatment of Share CFDs and of course please contact our team with any further questions you may have, or if learning to trade share CFDs could be for you.
By
Mike Smith
Mike Smith (MSc, PGdipEd)
Client Education and Training
The information provided is of general nature only and does not take into account your personal objectives, financial situations or needs. Before acting on any information provided, you should consider whether the information is suitable for you and your personal circumstances and if necessary, seek appropriate professional advice. All opinions, conclusions, forecasts or recommendations are reasonably held at the time of compilation but are subject to change without notice. Past performance is not an indication of future performance. Go Markets Pty Ltd, ABN 85 081 864 039, AFSL 254963 is a CFD issuer, and trading carries significant risks and is not suitable for everyone. You do not own or have any interest in the rights to the underlying assets. You should consider the appropriateness by reviewing our TMD, FSG, PDS and other CFD legal documents to ensure you understand the risks before you invest in CFDs.
As ações de defesa da ASX estão de volta em mais listas de observação e, de acordo com o Instituto Internacional de Pesquisa da Paz de Estocolmo (SIPRI), os gastos militares globais atingiram aproximadamente USD 2,718 trilhões em 2024, um aumento de 9,4% em termos reais.
As configurações atuais de defesa da Austrália estão definidas na Estratégia Nacional de Defesa de 2024 e nos documentos de planejamento de investimento relacionados, que descrevem as prioridades de financiamento de capacidades de longo prazo. Além disso, Canberra apontou um investimento de capacidade de 330 bilhões de dólares australianos até 2034, incluindo financiamento adicional para combatentes de superfície, preparação, ataques de longo alcance e sistemas autônomos.
Aqui está a parte que a maioria das pessoas perde: nem todas as ações de defesa da ASX são negociadas da mesma forma. Alguns ficam perto da construção naval. Alguns são nomes de contra-drones e alguns são operadores menores e de alto risco, onde um contrato pode importar muito mais do que o mercado supõe.
Esses cinco nomes não são uma lista de compras, mas sim uma lista prática para investidores que tentam entender onde o impulso de compras pode realmente aparecer no ASX.
1) Austal (ASX: ASB)
A Austal é uma das empresas listadas na ASX mais diretamente expostas ao gasoduto de construção naval da Austrália, embora a execução do contrato, as margens e o prazo de entrega continuem sendo variáveis importantes.
Eles não estão apenas ganhando contratos aleatórios; eles assinaram um grande acordo legal (o Acordo Estratégico de Construção Naval) que os torna parceiros oficiais para construir a próxima geração de navios militares de médio porte da Austrália na Austrália Ocidental.
Em fevereiro de 2026, o governo deu luz verde à Austal para um projeto de 4 bilhões de dólares. Isso não é para apenas um navio, é para 8 navios “Landing Craft Heavy”. São enormes navios de transporte (cerca de 100 metros de comprimento) projetados para transportar tanques pesados e equipamentos diretamente para a praia. Mas aqui está a parte que a maioria das pessoas perde: a construção naval é uma maratona, não um sprint.
Como você pode ver no cronograma de entrega, embora a construção comece em 2026, o navio final não será entregue até 2038. Para um investidor, isso significa que a Austal tem um fluxo de renda “garantido” para os próximos 12 anos, mas ele precisa ser muito bom em gerenciar seus custos durante esse longo período para realmente obter lucro.
2) DroneShield (ASX: DRO)
Se você já viu imagens de pequenos drones interrompendo campos de batalha modernos, o DroneShield está construindo parte do “botão de desligamento”. Seu foco é a tecnologia de combate a drones, incluindo sistemas que detectam, interrompem ou derrotam drones usando guerra eletrônica, sensores e ferramentas baseadas em software, em vez de depender apenas de munições tradicionais.
No início de 2026, a DroneShield deixou de ser uma startup promissora e entrou em uma fase comercial muito maior. Ela registrou uma receita do ano fiscal de 2025 de A $216,5 milhões, um aumento de 276% em relação ao ano fiscal de 2024, e disse que iniciou o ano fiscal de 2026 com A $103,5 milhões em receita comprometida.
Um ponto que o mercado pode ignorar é a camada de software no modelo. A DroneShield registrou receita de A $11,6 milhões em software como serviço (SaaS) no ano fiscal de 2025 e disse que está trabalhando para que o SaaS represente 30% da receita em cinco anos. Seu modelo de assinatura inclui atualizações de software para sistemas implantados, o que adiciona um fluxo crescente de receita recorrente junto com as vendas de hardware.
Entre as ações de defesa da ASX, a DroneShield é uma das formas mais diretas de seguir o tema Counter-UAS. É também um dos nomes em que o sentimento pode oscilar rapidamente, porque as histórias de crescimento podem aumentar e diminuir quando o tempo do pedido muda.
A EOS constrói tanto o “cérebro” quanto o “músculo” para plataformas militares. É mais conhecido por sistemas de armas remotas, que permitem aos operadores controlar torres armadas de dentro de veículos protegidos, e por sistemas de laser de alta energia voltados para a defesa contra drones. A EOS disse que seu acúmulo incondicional atingiu cerca de A $459,1 milhões no início de 2026, após uma série de vitórias de contratos até 2025. Isso aponta para uma base muito maior de trabalho seguro, embora o tempo de entrega e a conversão de receita ainda sejam importantes.
A EOS assinou um contrato de €71,4 milhões, cerca de A $125 milhões, com um cliente europeu para um sistema de armas a laser de alta energia de 100 quilowatts. A EOS afirma que o sistema foi projetado para um baixo custo por tiro e pode acionar até 20 drones por minuto. O governo australiano reservou A $1,3 bilhão em 10 anos para a aquisição de capacidade de combate a drones, e a EOS divulgou que fez parte de uma equipe bem-sucedida de licitação do LAND 156. Isso não garante receita futura, mas dá suporte à visibilidade de médio prazo em um mercado que a empresa já tem como alvo.
A EOS parece uma história de recuperação, mas que ainda depende da execução. A empresa se reorientou em torno de sistemas de armas remotas, sistemas de combate a drones e lasers, todas áreas vinculadas a maiores gastos com defesa. A questão principal é se ela pode continuar convertendo o acúmulo e o pipeline em receita gerada e, ao mesmo tempo, manter a disciplina do balanço patrimonial.
4) Codan (ASX: CDA)
Às vezes, a Codan fica de fora das listas casuais de ações de defesa porque é mais diversificada. Isso pode ser um descuido. Em seus resultados do primeiro semestre do ano fiscal de 26, a Codan disse que sua empresa de comunicações projeta comunicações de missão crítica para os mercados globais de segurança pública e militar. A receita de comunicações aumentou 19% para A $221,8 milhões. A empresa também disse que a DTC gerou um forte crescimento da demanda de defesa e sistemas não tripulados, com a receita de sistemas não tripulados aumentando 68%, para A $73 milhões. Codan disse que cerca de metade dessa receita não tripulada estava vinculada a aplicações de defesa operacional em zonas de conflito.
É aqui que a história se torna mais matizada. Em uma cesta de ações de defesa da ASX, a Codan pode oferecer um perfil diferente, com menos sensibilidade pura às manchetes, maior diversificação operacional e exposição significativa a comunicações militares e sistemas não tripulados, sem ser um nome de tema único. Essa diversificação também pode significar que as ações nem sempre são negociadas como um nome de defesa puro.
A HighCom está no final especulativo desta lista e deve ser rotulada dessa forma. A empresa afirma que seus dois negócios contínuos são a HighCom Armor, que fornece proteção balística, e a HighCom Technology, que fornece e mantém sistemas aéreos não tripulados de pequeno e médio porte, sistemas aéreos contra-não tripulados e suporte relacionado de engenharia, integração, manutenção e logística para o ADF e outras forças armadas regionais alinhadas.
No primeiro semestre do ano fiscal de 26, a receita de operações contínuas caiu 59% para A $10,9 milhões, enquanto o EBITDA passou para uma perda de A $5,4 milhões em relação ao lucro de A $1,9 milhão no ano anterior. A HighCom também divulgou A $5,1 milhões em receita de tecnologia HighCom, incluindo A $3,5 milhões de peças de reposição para pequenos sistemas aéreos não tripulados (SUAS) e A $1,6 milhão de serviços de sustentação fornecidos ao Departamento de Defesa da Austrália.
Então, sim, a HighCom é uma das ações de defesa ASX mais sensíveis financeiramente no conselho. Mas também é o tipo de nome menor que pode mostrar como as compras se transformam em equipamentos de suporte, sustentação e proteção especializados.
Principais observações do mercado
Acompanhe os marcos do programa, não apenas as manchetes políticas. A adjudicação de contratos, o início da fabricação, os cronogramas de entrega e o trabalho de manutenção geralmente importam mais do que um único dia de anúncio.
Separe a exposição pura da exposição diversificada. O DroneShield e o EOS estão mais próximos de temas concentrados de tecnologia de defesa, enquanto o Codan traz exposição às comunicações em um mix de negócios mais amplo.
Assista aos temas de capacidade soberana na Austrália. A Austal e a EOS estão vinculadas à fabricação local, à integração e às cadeias de suprimentos australianas, o que apóia o tema mais amplo de capacidade soberana desse grupo.
Preste atenção aos balanços e à conversão de caixa. O ímpeto de compras pode ser real mesmo quando o tempo fica confuso. A última metade da HighCom é um lembrete disso.
As manchetes de defesa podem parecer imediatas. Os ganhos geralmente não são. O principal trabalho naval da Austal se estende até a próxima década. Os contratos EOS são entregues ao longo de vários anos. O fluxo de pedidos da DroneShield parece forte, mas a empresa ainda separa a receita comprometida de uma oportunidade mais ampla de pipeline. HighCom mostra o outro lado da moeda. A exposição à aquisição não se traduz automaticamente em uma execução financeira tranquila.
As referências a ações de defesa listadas na ASX são apenas informações gerais, não uma recomendação para comprar, vender ou manter qualquer título ou CFD. Essas ações podem ser altamente voláteis e sensíveis ao prazo do contrato, à política governamental, à geopolítica, ao risco de execução e às condições do mercado. Expectativas de backlog, pipeline e receita não são garantias de desempenho futuro.
Em 28 de fevereiro de 2026, quando o ataque conjunto dos EUA e Israel começou, os números nas telas começaram a se mover de uma forma que parecia clínica, mesmo quando a realidade no terreno, com as trágicas mortes de vítimas civis no Irã, parecia tudo menos isso. Os mercados, como dizem, não têm uma bússola moral, mas sim uma máquina de pesagem e, neste momento, estão avaliando a transição de toda a economia global de um modelo “just-in-time” para um ciclo “just-in-case”.
O que os mercados estavam sinalizando
Em 2 de março, a fita de índice permaneceu cautelosa enquanto a defesa aumentava. Historicamente, os conflitos podem acelerar o reabastecimento e os pedidos, mas o tamanho (e a rapidez) ainda depende de orçamentos, aprovações e gargalos de entrega.
Os vencedores
1. Hanwha Aerospace (012450.KS)
Hanwha é um dos nomes mais negociados vinculados ao tema “K-Defense”, uma empresa cada vez mais vista pelo mercado como fornecedora escalável de um ciclo global cada vez mais apertado de artilharia e munições. Capacidade e credibilidade de entrega.
Quando o reabastecimento se torna urgente, a capacidade de produzir em grande escala geralmente é tão importante quanto a própria plataforma. A demanda de exportação vinculada a sistemas como o K9 Thunder e o Chunmoo reforçou a narrativa de um fluxo de pedidos durável, mesmo quando os resultados ainda dependem de orçamentos, aprovações e prazos de entrega.
Principais coisas que podem mover o sentimento: atualizações do livro de pedidos, ritmo de produção e quaisquer anúncios de exportação subsequentes.
2. Northrop Grumman (NOC)
A Northrop se concentrou à medida que os investidores reavaliaram a exposição à modernização estratégica e a grandes programas de longa duração. Os mercados de defesa, muitas vezes vistos como essenciais, podem persistir em todos os ciclos. É menos sobre um quarto e mais sobre se o ímpeto permanece estável se as prioridades de modernização permanecerem em vigor (e se os cronogramas mudam se não mudarem).
Variáveis-chave que podem mover o sentimento: Ritmo de aquisição, prazo do contrato e linguagem de financiamento relacionada ao programa.
3. Corporação RTX (RTX)
O RTX voltou ao centro da fita quando os investidores avaliaram um ciclo de reabastecimento de interceptores e a economia da defesa aérea de alto ritmo. O desgaste é caro e, quando as taxas de uso aumentam, os governos normalmente precisam reabastecer os estoques e, em muitos casos, financiar a expansão da produção, o que pode aumentar o atraso e aumentar a visibilidade da receita.
Variáveis-chave que podem mover o sentimento: Pedidos de reabastecimento, indicadores de expansão da fabricação e produtividade de entrega.
4. Lockheed Martin (LMT)
A Lockheed chamou a atenção quando os mercados se concentraram na demanda por defesa antimísseis e na questão que cada mesa de compras enfrenta em um ambiente de alto ritmo: com que rapidez os estoques podem ser reconstruídos? Se a utilização permanecer elevada, os vencedores tendem a ser os empreiteiros mais bem posicionados para escalar a produção e entregar de forma confiável. A exposição à defesa antimísseis da Lockheed a mantém intimamente ligada a essa narrativa de reabastecimento.
Variáveis-chave que podem mover o sentimento: sinais de rampa de produção, economia unitária e cadência de pedidos orientada pelo orçamento.
5. Sistemas BAE (BA.L)
Com um acúmulo de 83,6 bilhões de libras e um papel central no programa submarino AUKUS, a BAE entrou em foco quando partes da Europa sinalizaram maiores ambições de gastos com defesa. As ações subiram 6,11% para uma alta de 52 semanas em meio a uma rotação “sem risco”, com os comerciantes observando os marcos do AUKUS e as aquisições europeias de defesa aérea e antimísseis, incluindo o “Sky Shield”.
Variáveis-chave que podem mover o sentimento: Um potencial catalisador é qualquer aumento claro nos gastos alemães que eleve o fluxo de pedidos nas unidades europeias da BAE, enquanto os principais riscos incluem um forte aumento nos rendimentos do ouro do Reino Unido, uma nova volatilidade da libra esterlina ou uma “ameaça de paz” na obtenção de lucros.
800
Os perdedores: nem todo 'estoque de guerra' sobe
6. Ambiente aeroportuário (AVAV)
A AeroVironment subiu 18% na abertura antes de cair 17% no período intradiário após relatos de que a Força Espacial dos EUA estava reabrindo um contrato de USD 1,4 bilhão. A medida destaca como os processos de aquisição e o risco do contrato podem impulsionar a volatilidade, mesmo em ambientes temáticos favoráveis.
7. Defesa de Kratos (KTOS)
Kratos aborda o tema de drones e munições vadiadoras, que ganhou atenção à medida que o conflito no Oriente Médio se intensificava. As ações ainda foram vendidas após os lucros, destacando um risco comum do setor de defesa. A Kratos anunciou uma grande oferta complementar de ações na faixa de USD 1,2 bilhão a USD 1,4 bilhão. A medida fortalece o balanço patrimonial e pode apoiar futuros investimentos em programas.
Para negociadores focados em narrativas de “prêmio de conflito” de curto prazo, a diluição pode alterar rapidamente a configuração. Mesmo quando as condições de demanda parecem favoráveis, o mercado pode reavaliar as ações se cada acionista finalmente possuir uma parte menor do negócio.
8. Máquinas intuitivas (LUNR)
Alguns nomes especulativos de tecnologia espacial ficaram para trás, pois os investidores pareciam favorecer empresas com receitas mais estabelecidas vinculadas à defesa.
9. Boeing (BA)
A Boeing caiu cerca de 2,5% na sessão. Embora sua divisão de defesa seja significativa, seus negócios comerciais podem ser mais sensíveis à demanda da aviação, às interrupções no espaço aéreo e às mudanças no preço do petróleo.
10. Spirit AeroSystems (SPR)
A Spirit AeroSystems permanece intimamente ligada ao ciclo global de produção de aeronaves como uma importante fornecedora de aeroestruturas.Resultados recentes mostraram perdas crescentes, apesar do aumento das vendas, refletindo os aumentos contínuos dos custos de produção nos principais programas de aeronaves. Essas pressões pesaram sobre a confiança dos investidores nas perspectivas de curto prazo. A aquisição planejada pela Boeing pode, em última análise, remodelar a posição da empresa na cadeia de suprimentos, mas o risco de execução e a estabilidade da produção permanecem fundamentais na forma como o mercado precifica as ações.
O que assistir a seguir
Escalação versus redução da escalada: Uma mudança em direção à diplomacia ou às discussões sobre o cessar-fogo pode mudar rapidamente o sentimento em relação às ações de defesa.
Petróleo e transporte marítimo: Os picos de energia podem restringir as condições financeiras e pressionar setores cíclicos.
Orçamentos e prêmios: Às vezes, os movimentos de preços podem preceder as decisões do contrato, com clareza chegando quando os prêmios são finalizados.
Capacidade de produção: Empresas com histórico comprovado de produção e entrega geralmente atraem a maior atenção dos investidores.
Restrições da cadeia de suprimentos: Terras raras, propulsão e eletrônicos continuam sendo possíveis gargalos que podem limitar a rapidez com que a produção cresce.
A lente de longo prazo
O conflito de 2026 no Irã é, antes de tudo, uma tragédia humana. Para os mercados, isso também pode representar uma mudança na forma como os gastos com segurança nacional são priorizados dentro das estruturas fiscais. Se os gastos com defesa permanecerem elevados em um horizonte de vários anos, empresas com capacidade de fabricação escalável e tecnologias integradas poderão atrair a atenção contínua dos investidores. Dito isso, os mercados se movem em ciclos. Os temas estruturais podem persistir, mas também podem ser reavaliados rapidamente quando as suposições mudam. Manter-se analítico e consciente dos riscos continua sendo fundamental.
As referências a empresas, setores ou movimentos de mercado específicos são fornecidas apenas para comentários gerais do mercado e não constituem uma recomendação, oferta ou solicitação para comprar ou vender qualquer produto financeiro. As reações do mercado a eventos geopolíticos ou macroeconômicos podem ser voláteis e imprevisíveis, e os resultados podem diferir materialmente das expectativas.
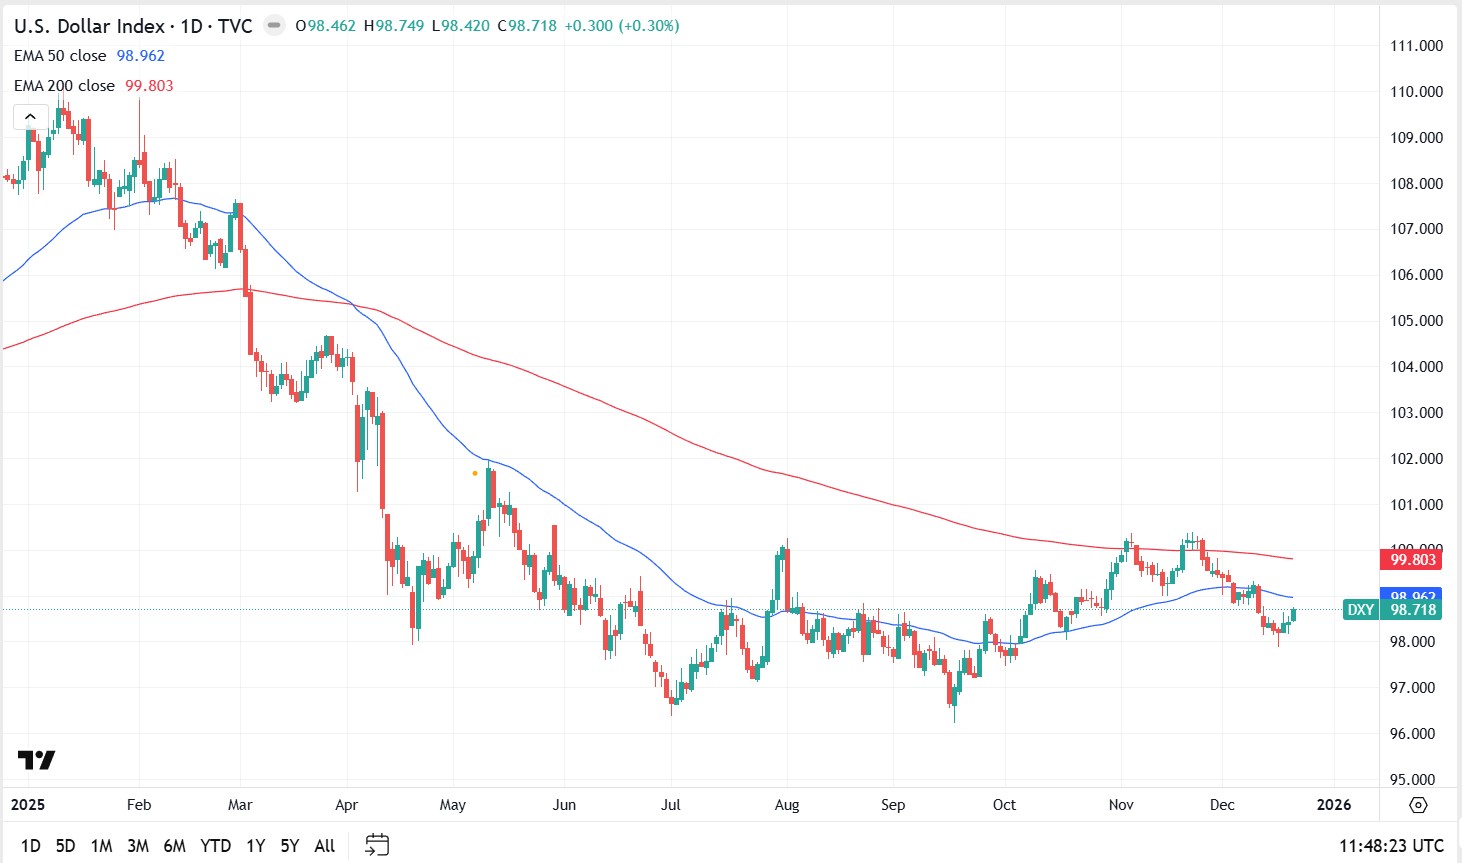
2025 has seen a material decline in the fortunes of the greenback. A technical structure breakdown early in the year was followed by a breach of the 200-day moving average (MA) at the end of Q1. The index then entered correction territory, printing a three-year low at the end of Q2.
Since then, we have seen attempts to build a technical base, including a re-test of the end-of-June lows in mid-September. However, buying pressure has not been strong enough to push price back above the technically critical and psychologically important 100 level.
What the levels suggest from here
As things stand, the index remains more than 10% lower for 2025. On this technical view, the index may revisit the 96 area. However, technical levels can fail and outcomes depend on multiple factors.
US dollar index
Source: TradingView
The key question for 2026
The key question remains: are we likely to see further losses in the early part of next year and beyond, or will current support hold?
We cannot assess the US dollar in isolation and any outlook is shaped by internal and global factors, not least its relative strength versus other major currencies. Many of these drivers are interrelated, but four potential headwinds stand out for any US dollar recovery. Collectively, they may keep downside pressure in play.
Four headwinds for any US dollar recovery
1. The US dollar as a safe-haven trade
One scenario where US dollar support has historically been evident is during major global events, slowdowns and market shocks. However, the more muted response of the US dollar during risk-off episodes this year suggests a shift away from the historical norm, with fewer sustained US dollar rallies.
Instead, throughout 2025, some investors appearedto favour gold, and at other times, FX and even equities, rather than into the US dollar. If this change in behaviour persists through 2026, it could make recovery harder, even if global economic pressure builds over the year ahead.
2. US versus global trade
Trade policy is harder to measure objectively, and outcomes can be difficult to predict. That said, trade battles driven by tariffs on US imports are often viewed as an additional potential drag on the US dollar.
The impact may be twofold if additional strain is placed on the US economy through:
a slowdown in global trade volumes as impacted countries seek alternative trade relationships, with supply chain distortions that may not favour US growth
pressure on US corporate profit margins as tariffs lift costs for importers
3. Removal of quantitative tightening
The Fed formally halted its balance sheet reduction, quantitative tightening (QT), as of 1 December 2025, ending a program that shrank assets by roughly US$2.4 trillion since mid-2022.
Traditionally, ending QT is seen as marginally negative for the US dollar because it stops the withdrawal of liquidity, can ease global funding conditions, and may reduce the scarcity that can support dollar demand. Put simply, more dollars in the system can soften the currency’s support at the margin, although outcomes have varied historically and often depend on broader financial conditions.
4. Interest rate differential
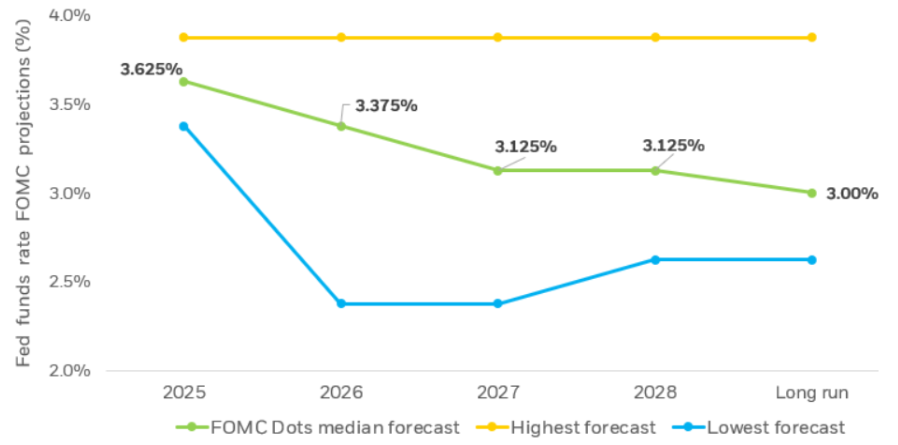
Interest rate differential (IRD) is likely to be a primary driver of US dollar strength, or otherwise, in the months ahead. The latest FOMC meeting delivered the expected 0.25% cut, with attention on guidance for what may come next.
Even after a softer-than-expected CPI print, markets have been reluctant to price aggressive near-term easing. At the time of writing, less than a 20% chance of a January cut is priced in, and it may be March before we see the next move.
The Fed is balancing sticky inflation against a jobs market under pressure, with the headline rate back at levels last seen in 2012. The practical takeaway is that a more accommodative stance may add to downward pressure on the US dollar.
Current expectations imply around two rate cuts through 2026, with the potential for further easing beyond that, broadly consistent with the median projections shown in the chart below. These are forecasts rather than guarantees, and they can shift as economic data and policy guidance evolve.
Source: US Federal Reserve, Summart of Economic Projections
As ações de defesa da ASX estão de volta em mais listas de observação e, de acordo com o Instituto Internacional de Pesquisa da Paz de Estocolmo (SIPRI), os gastos militares globais atingiram aproximadamente USD 2,718 trilhões em 2024, um aumento de 9,4% em termos reais.
As configurações atuais de defesa da Austrália estão definidas na Estratégia Nacional de Defesa de 2024 e nos documentos de planejamento de investimento relacionados, que descrevem as prioridades de financiamento de capacidades de longo prazo. Além disso, Canberra apontou um investimento de capacidade de 330 bilhões de dólares australianos até 2034, incluindo financiamento adicional para combatentes de superfície, preparação, ataques de longo alcance e sistemas autônomos.
Aqui está a parte que a maioria das pessoas perde: nem todas as ações de defesa da ASX são negociadas da mesma forma. Alguns ficam perto da construção naval. Alguns são nomes de contra-drones e alguns são operadores menores e de alto risco, onde um contrato pode importar muito mais do que o mercado supõe.
Esses cinco nomes não são uma lista de compras, mas sim uma lista prática para investidores que tentam entender onde o impulso de compras pode realmente aparecer no ASX.
1) Austal (ASX: ASB)
A Austal é uma das empresas listadas na ASX mais diretamente expostas ao gasoduto de construção naval da Austrália, embora a execução do contrato, as margens e o prazo de entrega continuem sendo variáveis importantes.
Eles não estão apenas ganhando contratos aleatórios; eles assinaram um grande acordo legal (o Acordo Estratégico de Construção Naval) que os torna parceiros oficiais para construir a próxima geração de navios militares de médio porte da Austrália na Austrália Ocidental.
Em fevereiro de 2026, o governo deu luz verde à Austal para um projeto de 4 bilhões de dólares. Isso não é para apenas um navio, é para 8 navios “Landing Craft Heavy”. São enormes navios de transporte (cerca de 100 metros de comprimento) projetados para transportar tanques pesados e equipamentos diretamente para a praia. Mas aqui está a parte que a maioria das pessoas perde: a construção naval é uma maratona, não um sprint.
Como você pode ver no cronograma de entrega, embora a construção comece em 2026, o navio final não será entregue até 2038. Para um investidor, isso significa que a Austal tem um fluxo de renda “garantido” para os próximos 12 anos, mas ele precisa ser muito bom em gerenciar seus custos durante esse longo período para realmente obter lucro.
2) DroneShield (ASX: DRO)
Se você já viu imagens de pequenos drones interrompendo campos de batalha modernos, o DroneShield está construindo parte do “botão de desligamento”. Seu foco é a tecnologia de combate a drones, incluindo sistemas que detectam, interrompem ou derrotam drones usando guerra eletrônica, sensores e ferramentas baseadas em software, em vez de depender apenas de munições tradicionais.
No início de 2026, a DroneShield deixou de ser uma startup promissora e entrou em uma fase comercial muito maior. Ela registrou uma receita do ano fiscal de 2025 de A $216,5 milhões, um aumento de 276% em relação ao ano fiscal de 2024, e disse que iniciou o ano fiscal de 2026 com A $103,5 milhões em receita comprometida.
Um ponto que o mercado pode ignorar é a camada de software no modelo. A DroneShield registrou receita de A $11,6 milhões em software como serviço (SaaS) no ano fiscal de 2025 e disse que está trabalhando para que o SaaS represente 30% da receita em cinco anos. Seu modelo de assinatura inclui atualizações de software para sistemas implantados, o que adiciona um fluxo crescente de receita recorrente junto com as vendas de hardware.
Entre as ações de defesa da ASX, a DroneShield é uma das formas mais diretas de seguir o tema Counter-UAS. É também um dos nomes em que o sentimento pode oscilar rapidamente, porque as histórias de crescimento podem aumentar e diminuir quando o tempo do pedido muda.
A EOS constrói tanto o “cérebro” quanto o “músculo” para plataformas militares. É mais conhecido por sistemas de armas remotas, que permitem aos operadores controlar torres armadas de dentro de veículos protegidos, e por sistemas de laser de alta energia voltados para a defesa contra drones. A EOS disse que seu acúmulo incondicional atingiu cerca de A $459,1 milhões no início de 2026, após uma série de vitórias de contratos até 2025. Isso aponta para uma base muito maior de trabalho seguro, embora o tempo de entrega e a conversão de receita ainda sejam importantes.
A EOS assinou um contrato de €71,4 milhões, cerca de A $125 milhões, com um cliente europeu para um sistema de armas a laser de alta energia de 100 quilowatts. A EOS afirma que o sistema foi projetado para um baixo custo por tiro e pode acionar até 20 drones por minuto. O governo australiano reservou A $1,3 bilhão em 10 anos para a aquisição de capacidade de combate a drones, e a EOS divulgou que fez parte de uma equipe bem-sucedida de licitação do LAND 156. Isso não garante receita futura, mas dá suporte à visibilidade de médio prazo em um mercado que a empresa já tem como alvo.
A EOS parece uma história de recuperação, mas que ainda depende da execução. A empresa se reorientou em torno de sistemas de armas remotas, sistemas de combate a drones e lasers, todas áreas vinculadas a maiores gastos com defesa. A questão principal é se ela pode continuar convertendo o acúmulo e o pipeline em receita gerada e, ao mesmo tempo, manter a disciplina do balanço patrimonial.
4) Codan (ASX: CDA)
Às vezes, a Codan fica de fora das listas casuais de ações de defesa porque é mais diversificada. Isso pode ser um descuido. Em seus resultados do primeiro semestre do ano fiscal de 26, a Codan disse que sua empresa de comunicações projeta comunicações de missão crítica para os mercados globais de segurança pública e militar. A receita de comunicações aumentou 19% para A $221,8 milhões. A empresa também disse que a DTC gerou um forte crescimento da demanda de defesa e sistemas não tripulados, com a receita de sistemas não tripulados aumentando 68%, para A $73 milhões. Codan disse que cerca de metade dessa receita não tripulada estava vinculada a aplicações de defesa operacional em zonas de conflito.
É aqui que a história se torna mais matizada. Em uma cesta de ações de defesa da ASX, a Codan pode oferecer um perfil diferente, com menos sensibilidade pura às manchetes, maior diversificação operacional e exposição significativa a comunicações militares e sistemas não tripulados, sem ser um nome de tema único. Essa diversificação também pode significar que as ações nem sempre são negociadas como um nome de defesa puro.
A HighCom está no final especulativo desta lista e deve ser rotulada dessa forma. A empresa afirma que seus dois negócios contínuos são a HighCom Armor, que fornece proteção balística, e a HighCom Technology, que fornece e mantém sistemas aéreos não tripulados de pequeno e médio porte, sistemas aéreos contra-não tripulados e suporte relacionado de engenharia, integração, manutenção e logística para o ADF e outras forças armadas regionais alinhadas.
No primeiro semestre do ano fiscal de 26, a receita de operações contínuas caiu 59% para A $10,9 milhões, enquanto o EBITDA passou para uma perda de A $5,4 milhões em relação ao lucro de A $1,9 milhão no ano anterior. A HighCom também divulgou A $5,1 milhões em receita de tecnologia HighCom, incluindo A $3,5 milhões de peças de reposição para pequenos sistemas aéreos não tripulados (SUAS) e A $1,6 milhão de serviços de sustentação fornecidos ao Departamento de Defesa da Austrália.
Então, sim, a HighCom é uma das ações de defesa ASX mais sensíveis financeiramente no conselho. Mas também é o tipo de nome menor que pode mostrar como as compras se transformam em equipamentos de suporte, sustentação e proteção especializados.
Principais observações do mercado
Acompanhe os marcos do programa, não apenas as manchetes políticas. A adjudicação de contratos, o início da fabricação, os cronogramas de entrega e o trabalho de manutenção geralmente importam mais do que um único dia de anúncio.
Separe a exposição pura da exposição diversificada. O DroneShield e o EOS estão mais próximos de temas concentrados de tecnologia de defesa, enquanto o Codan traz exposição às comunicações em um mix de negócios mais amplo.
Assista aos temas de capacidade soberana na Austrália. A Austal e a EOS estão vinculadas à fabricação local, à integração e às cadeias de suprimentos australianas, o que apóia o tema mais amplo de capacidade soberana desse grupo.
Preste atenção aos balanços e à conversão de caixa. O ímpeto de compras pode ser real mesmo quando o tempo fica confuso. A última metade da HighCom é um lembrete disso.
As manchetes de defesa podem parecer imediatas. Os ganhos geralmente não são. O principal trabalho naval da Austal se estende até a próxima década. Os contratos EOS são entregues ao longo de vários anos. O fluxo de pedidos da DroneShield parece forte, mas a empresa ainda separa a receita comprometida de uma oportunidade mais ampla de pipeline. HighCom mostra o outro lado da moeda. A exposição à aquisição não se traduz automaticamente em uma execução financeira tranquila.
As referências a ações de defesa listadas na ASX são apenas informações gerais, não uma recomendação para comprar, vender ou manter qualquer título ou CFD. Essas ações podem ser altamente voláteis e sensíveis ao prazo do contrato, à política governamental, à geopolítica, ao risco de execução e às condições do mercado. Expectativas de backlog, pipeline e receita não são garantias de desempenho futuro.
Três bancos centrais estão decidindo as taxas simultaneamente, o petróleo Brent está oscilando em torno de USD 100 o barril e uma guerra no Oriente Médio está reescrevendo as perspectivas de inflação em tempo real. O que quer que aconteça nesta semana pode definir o tom dos mercados para o resto de 2026.
Fatos rápidos
O Banco da Reserva da Austrália (RBA) anuncia sua próxima decisão sobre a taxa de caixa na terça-feira, com os mercados agora precificando 66% de chance de um segundo aumento para 4,1%.
Alguns analistas alertaram que a guerra do Irã pode empurrar a inflação dos EUA para 3,5% até o final do ano e atrasar os cortes nas taxas do Fed até setembro, tornando o gráfico de pontos do FOMC desta semana o mais observado em anos.
O petróleo Brent está flertando com USD 100 o barril depois que o Irã lançou o que a mídia estatal descreveu como sua “operação mais intensa desde o início da guerra”.
RBA: A Austrália voltará a caminhar?
O RBA elevou a taxa de caixa pela primeira vez em dois anos para 3,85% em sua reunião de fevereiro, depois que a inflação aumentou materialmente no segundo semestre de 2025.
A questão agora é se ele se move novamente antes mesmo de ver a próxima impressão trimestral do IPC, que só deve ser divulgada em 29 de abril.
O vice-governador Andrew Hauser reconheceu antes da reunião que os formuladores de políticas enfrentam uma decisão genuinamente dividida, moldada por sinais econômicos conflitantes em casa e pela crescente instabilidade no exterior.
Atualmente, os mercados financeiros atribuem cerca de 66% de probabilidade a outro aumento, com um aumento de maio considerado praticamente certo, independentemente do que aconteça na segunda-feira.
Datas importantes
Decisão sobre a taxa de caixa do RBA: Terça-feira, 17 de março, 14h30 AEDT
Conferência de imprensa do governador Bullock: Terça-feira, 17 de março, 15:30 AEDT
Monitor
Qualquer referência de Bullock a novas subidas será provável em maio
FOMC: É provável que todos os olhos estejam voltados para o gráfico de pontos
O FOMC se reúne de 17 a 18 de março, com a declaração de política agendada para 14h ET em 18 de março e a coletiva de imprensa do presidente Jerome Powell às 14h30. O CME FedWatch mostra uma probabilidade de 99% de que o Fed mantenha taxas de 3,50% a 3,75%.
A ação real está no Resumo das Projeções Econômicas (SEP) e no gráfico de pontos. O ponto médio atual mostra um corte de 25 pontos base para 2026. Se passar para dois cortes, isso é dovish e otimista para ativos de risco. Se mudar para zero cortes ou adicionar um aumento da taxa à projeção, os mercados poderão reagir na outra direção.
Para complicar ainda mais as coisas, o mandato de Powell como presidente do Federal Reserve expira em 23 de maio de 2026. Kevin Warsh é o principal candidato para substituí-lo, visto como mais agressivo em política monetária. Qualquer comentário de Powell sobre essa transição poderia movimentar os mercados independentemente da decisão de taxa em si.
Data chave
Decisão de taxa do FOMC + Gráfico de SEP/ponto: Quinta-feira, 19 de março, 4:00 AEDT
Conferência de imprensa de Powell: Quinta-feira, 19 de março, 4h30 AEDT
Monitor
A linguagem de Powell sobre petróleo e inflação tarifária.
Reação de rendimento do Tesouro em 2 anos.
A reprecificação do CME FedWatch para qualquer mudança na probabilidade de redução de setembro.
Banco do Japão: um maior aperto pode ser antecipado
O BOJ se reúne de 18 a 19 de março, com a decisão prevista para quinta-feira de manhã, horário de Tóquio. A taxa de política atual está em 0,75% (uma alta de 30 anos), e a reunião de janeiro de 2026 resultou na suspensão de uma votação de 8 a 1.
O governador Ueda classificou a reunião de março como “ao vivo”, observando que o cronograma para um maior aperto poderia ser “antecipado” se as negociações salariais de primavera da Shunto produzirem resultados mais fortes do que o esperado.
Esses resultados devem começar a chegar durante a semana, tornando-os a contribuição crítica para a decisão do BOJ. Nomura espera que os aumentos salariais da Shunto em 2026 cheguem em torno de 5,0%, incluindo a antiguidade, com um crescimento do salário base de aproximadamente 3,4%. Se os resultados confirmarem essa trajetória, o argumento de uma alta em março se fortalece consideravelmente.
A complicação é o cenário global. O Japão importa cerca de 90% de suas necessidades de energia, e o petróleo em torno de USD 100 por barril está elevando os custos de importação e ameaçando aumentar a pressão inflacionária. Um aumento do BOJ em um choque global do petróleo seria uma medida excepcionalmente ousada.
A maioria dos participantes do mercado ainda deseja aguardar esta reunião, com abril ou julho vistos como o momento mais provável para o próximo movimento.
Data chave
Decisão sobre a taxa de política do BOJ (atualmente 0,75%): Quinta-feira, 19 de março, manhã AEDT
Monitor
Os resultados salariais de Shunto são o principal gatilho para um aumento em março.
Linguagem da conferência de imprensa de Ueda e orientação futura em abril e julho.
O petróleo Brent atingiu brevemente USD 119,50 por barril no início da semana, antes de cair 17% para menos de USD 80, depois se recuperando para USD 95 em sinais mistos de Washington sobre o Estreito de Ormuz.
Na quinta-feira, o Brent estava de volta com mais de USD 100 quando o Irã lançou novos ataques contra o transporte comercial e a liberação da reserva da AIE não trouxe alívio significativo.
No cenário em que um conflito mais longo inflige danos à infraestrutura de energia, analistas estimam que o IPC pode subir para 3,5% até o final de 2026, com os preços da gasolina se aproximando de USD 5 por galão no segundo trimestre.
Para esta semana, o petróleo atua como uma macro metavariável. Cada manchete geopolítica, sinal de cessar-fogo, ataque de petroleiro, liberação de reserva e comentário de Trump poderiam movimentar ações, títulos e moedas em tempo real.
Monitor
Qualquer retomada do fluxo de petroleiros do Estreito de Ormuz.
Os ataques dos EUA e Israel contra o Irã lançados em 28 de fevereiro fizeram com que o petróleo Brent passasse de USD 119 o barril, o ouro acima de USD 5.200 e ações de defesa para recordes históricos.
Nesse contexto, os investidores estão se concentrando em um pequeno grupo de nomes vinculados a commodities que podem permanecer sensíveis a novos movimentos em petróleo, GNL e ouro. A questão chave é se o choque se mostra sustentado ou se um cessar-fogo, a normalização do transporte marítimo ou uma ação política removem parte do prêmio de risco geopolítico.
1. ExxonMobil (NYSE: XOM)
A ExxonMobil tem sido uma das mais claras beneficiárias do aumento de preços. As ações atingiram um recorde de USD 159,60 no início de março e subiram aproximadamente 28% no acumulado do ano.
A empresa produz 4,7 milhões de barris de óleo equivalente por dia, tem um ponto de equilíbrio na Bacia do Permiano de cerca de USD 35/barril e está comprometida com USD 20 bilhões em recompras até 2026.
O Wells Fargo elevou sua meta de preço para USD 183 de USD 156 após a escalada, enquanto o consenso mais amplo dos analistas está em torno de USD 140 a $144. No entanto, a XOM já está negociando acima de muitas metas consensuais, e a interrupção de sua parceira de GNL, a QatarEnergy, representa um obstáculo operacional de curto prazo.
O que assistir
Se as interrupções do Ormuz persistem além de 4 a 6 semanas.
A liberação emergencial do estoque do G7 ou um cessar-fogo confiável podem reduzir o prêmio de risco de guerra.
Quaisquer ajustes nas metas de consenso dos analistas.
A Chevron atingiu uma nova alta de 52 semanas de USD 196,76 no início de março e aumentou aproximadamente 24% no acumulado do ano.
O ponto de equilíbrio do Brent da empresa para dividendos e despesas de capital é de cerca de USD 50/barril. Isso significa que, com os preços atuais do petróleo acima de USD 90, ele está gerando um fluxo de caixa livre significativo.
No entanto, a Chevron interrompeu temporariamente as operações em um campo de gás na costa de Israel após a atividade de mísseis na região, e desde então as ações recuaram mais de 1%, já que o conflito afeta diretamente suas operações.
O que assistir
Atualizações operacionais diretas dos ativos da Chevron no Oriente Médio e em Israel.
Quaisquer novas paradas que possam pesar na produção de curto prazo.
Participação de petróleo bruto acima de USD 90, o que mantém a Chevron gerando fluxo de caixa livre significativo.
3. Woodside Energy (ASX: WDS/NYSE: WDS)
Com o Catar interrompendo a produção após ataques de drones iranianos, compradores na Ásia e na Europa estão lutando por suprimentos alternativos. A Woodside, como uma das maiores produtoras e exportadoras de GNL da Austrália, está fora da zona de conflito e está bem posicionada para se beneficiar da demanda redirecionada.
Os analistas alertam que a substituição real leva tempo devido às restrições de envio e contrato, o que significa que o aumento do preço pode ser mais durável do que uma simples negociação à vista. Os preços do gás de referência europeu TTF subiram mais de 50% em uma semana, ampliando o ambiente de margem para produtores de GNL fora do Oriente Médio.
O que assistir
O ritmo e o cronograma de qualquer reinício da produção de GNL do Catar.
Se a QatarEnergy permanecer off-line por semanas, a Woodside poderá começar a recontratar compradores europeus a preços spot elevados.
Uma alta do dólar australiano pode ser um obstáculo que vale a pena acompanhar os ganhos denominados em USD.
4. Cheniere Energy (NYSE: GNL)
Juntamente com a Woodside, Cheniere é a beneficiária mais direta dos EUA da interrupção do GNL no Catar. Como maior exportador de GNL dos Estados Unidos, viu força intradiária no início da semana do conflito.
A produção doméstica de energia dos EUA protegeu os consumidores americanos do pior choque, mas o prêmio de exportação aumentou à medida que compradores europeus e asiáticos pagam pelo fornecimento fora do Golfo.
O comércio é “geopoliticamente sensível” e qualquer resolução pode reverter a vantagem rapidamente. Mas enquanto a infraestrutura de gás de Hormuz e do Golfo permanecer comprometida, Cheniere está posicionada para se beneficiar estruturalmente.
O que assistir
Qualquer avanço diplomático que reabra as rotas marítimas do Golfo.
Anúncios de novos contratos de aquisição de longo prazo assinados a preços elevados atuais.
O ouro subiu 5,2% em uma única sessão em 1º de março, atingindo USD 5.246/onça, à medida que os mercados buscavam ativos seguros. A Newmont, a maior produtora de ouro do mundo, viu suas reservas efetivamente reavaliadas a esses preços.
Ele está em alta junto com o ganho de 24% do ouro no acumulado do ano, e seus custos totais de sustentação permanecem praticamente fixos.
No entanto, as mineradoras de ouro se venderam drasticamente em 4 de março, e a Newmont caiu quase 8% em uma única sessão, à medida que uma desalavancagem mais ampla do risco atingiu as ações de metais preciosos.
As ações se recuperaram desde então, mas a volatilidade continua alta. Para investidores de longa duração, analistas observam que jurisdições de mineração “seguras”, como Canadá, Austrália e Nevada, estão cobrando novos prêmios à medida que a instabilidade no Oriente Médio aumenta o valor do fornecimento geopoliticamente seguro.
O que assistir
Se o ouro pode se manter acima de USD 5.000/onça.
Um conflito prolongado pode acelerar um ciclo de fusões e aquisições em mineradores de ouro juniores.
Um cessar-fogo ou um amplo evento de desalavancagem de ações como o principal risco a ser monitorado.
A Lockheed Martin atingiu um novo recorde histórico de USD 676,70 em 3 de março, um aumento de mais de 4% no dia. Seus caças F-35, munições guiadas com precisão, sistemas THAAD e artilharia de foguetes HIMARS são fundamentais para a campanha aérea em andamento.
O Departamento de Defesa dos EUA está se movendo para reabastecer os estoques de munições, e a ambição declarada de Trump de aumentar o orçamento de defesa dos EUA para USD 1,5 trilhão até 2027 acrescenta um vento favorável estrutural de longo prazo além do conflito imediato.
As ações de defesa estão subindo em meio aos preços clássicos de risco geopolítico, mas os investidores devem observar que o fluxo real de contratos leva tempo para se traduzir em lucros, e as avaliações já refletem um otimismo considerável.
O que assistir
O ritmo das ordens de reabastecimento de munições do Departamento de Defesa dos EUA.
A rapidez com que as vitórias de contratos se traduzem em crescimento da carteira de pedidos.
Barrick está acompanhando a corrida histórica do ouro ao lado da Newmont, com as ações subindo acentuadamente no acumulado do ano. Ela tem uma capitalização de mercado de aproximadamente USD 78 bilhões e está relatando projeções recordes de fluxo de caixa livre, já que seus custos totais de sustentação permanecem bem abaixo dos preços à vista atuais.
Como a Newmont, ela experimentou uma forte liquidação em uma única sessão de mais de 8% durante o evento mais amplo de desalavancagem de 4 de março, antes de se recuperar parcialmente.
Empresas de royalties e streaming, como a Wheaton Precious Metals (WPM), estão sendo preferidas por alguns investidores como uma forma mais protegida contra a inflação de acessar o ouro, dada sua menor exposição aos custos operacionais. Mas a Barrick continua sendo uma das maiores mineradoras de ouro listadas do mundo, com ganhos altamente sensíveis às mudanças no preço do ouro
O que assistir
A capacidade do ouro de se manter acima de USD 5.000/onça.
Qualquer Barrick avança em direção a aquisições de mineradores juniores.
Inflação dos custos de energia, já que o aumento dos preços dos combustíveis pode começar a reduzir as margens operacionais das mineradoras.