We would suggest that right now Markets are underestimating the impact of April 2 US Reciprocal Tariffs – aka Liberation Day monikered by the President.There is consistent and constant chatter around what is being referred to as The Dirty 15. This is the 15 countries the president suggests has been taking advantage of the United States of America for too long. The original thinking was The Dirty 15 for those countries with the highest levels of tariffs or some form of taxation system against US goods. However, there is also growing evidence that actually The Dirty 15 are the 15 nations that have the largest trade relations with the US.That is an entirely different thought process because those 15 countries include players like Japan, South Korea, Germany, France, the UK, Canada, Mexico and of course, Australia. Therefore, the underestimation of the impact from reciprocal tariffs could be far-reaching and much more destabilising than currently pricing.From a trading perspective, the most interesting moves in the interim appear to be commodities. Because the scale and execution of US’s reciprocal tariffs will be a critical driver of commodity prices over the coming quarter and into 2025.Based on repeated signals from President Trump and his administration, reinforced by recent remarks from US Commerce Secretary Howard Lutnick. Lutnick has indicated that headline tariffs of 15-30% could be announced on April 2, with “baseline” reciprocal tariffs likely to fall in the 15-20% range—effectively broad-based tariffs.The risk here is huge: economic downturn, possibilities of hyperinflation, the escalation of further trade tensions, goods and services bottlenecks and the loss of globalisation.This immediately brings gold to the fore because, clearly risk environment of this scale would likely mean that instead of flowing to the US dollar which would normally be the case the trade of last resort is to the inert metal.The other factor that we need to look at here is the actual end goal of the president? The answer is clearly lower oil prices—potentially through domestic oil subsidies or tax cuts—to offset inflationary pressures from tariffs and to force lower interest rates.‘Balancing the Budget’Secretary Lutnick has specified that the tariffs are expected to generate $700 billion in revenue, which therefore implies an incremental 15-20% increase in weighted-average tariffs. We can’t write off the possibility that the initial announcement may set tariffs at even higher levels to allow room for negotiation, take the recently announced 25% tariffs on the auto industry. From an Australian perspective, White House aide Peter Navarro has confirmed that each trading partner will be assigned a single tariff rate. Navarro is a noted China hawk and links Australia’s trade with China as a major reason Australia should be heavily penalised.Trump has consistently advocated for tariffs since the 1980s, and his administration has signalled that reciprocal tariffs are the baseline, citing foreign VAT and GST regimes as justification. This suggests that at least a significant portion of these tariffs may be non-negotiable. Again, this highlights why markets may have underestimated just how big an impact ‘liberation day’ could have.Now, the administration acknowledges that tariffs may cause “a little disturbance” (irony much?) and that a “period of transition” may be needed. The broader strategy appears to involve deficit reduction, followed by redistributing tariff revenue through tax cuts for households earning under $150K, as reported by the likes of Reuters on March 13.The White House has also emphasised a focus on Main Street over Wall Street, which we have highlighted previously – Trump has made next to no mention of markets in his second term. Compared to his first, where it was basically a benchmark for him.All this suggests that some downside risk in financial markets may be tolerated to advance broader economic objectives.Caveat! - a policy reversal remains possible in 2H’25, particularly if tariffs are implemented at scale and prove highly disruptive and the US consumer seizes up. Which is likely considering the players most impacted by tariffs are end users.The possible trades:With all things remaining equal, there is a bullish outlook for gold over the next three months, alongside a bearish outlook on oil over the next three to six months.Gold continues to punch to new highs, and its upward trajectory has yet to be truly tested. Having now surpassed $3,000/oz, as a reaction to the economic impact of tariffs. Further upside is expected to drive prices to $3,200/oz over the next three months on the fallout from the April 2 tariffs to come.What is also critical here is that gold investment demand remains well above the critical 70% of mine supply threshold for the ninth consecutive quarter. Historically, when investment demand exceeds this level, prices tend to rise as jewellery consumption declines and scrap supply increases.On the flip side, Brent crude prices are forecasted to decline to $60-65 per barrel 2H’25 (-15-20%). The broader price range for 2025 is expected to shift down to $60-75 per barrel, compared to the $70-90 per barrel range seen over the past three years.Now there is a caveat here: the weak oil fundamentals for 2025 are now widely known, and the physical surplus has yet to materialise – this is the risk to the bearish outlook and never write off OPEC looking to cut supply to counter the price falls.
By
Evan Lucas
The information provided is of general nature only and does not take into account your personal objectives, financial situations or needs. Before acting on any information provided, you should consider whether the information is suitable for you and your personal circumstances and if necessary, seek appropriate professional advice. All opinions, conclusions, forecasts or recommendations are reasonably held at the time of compilation but are subject to change without notice. Past performance is not an indication of future performance. Go Markets Pty Ltd, ABN 85 081 864 039, AFSL 254963 is a CFD issuer, and trading carries significant risks and is not suitable for everyone. You do not own or have any interest in the rights to the underlying assets. You should consider the appropriateness by reviewing our TMD, FSG, PDS and other CFD legal documents to ensure you understand the risks before you invest in CFDs.
As ações de defesa da ASX estão de volta em mais listas de observação e, de acordo com o Instituto Internacional de Pesquisa da Paz de Estocolmo (SIPRI), os gastos militares globais atingiram aproximadamente USD 2,718 trilhões em 2024, um aumento de 9,4% em termos reais.
As configurações atuais de defesa da Austrália estão definidas na Estratégia Nacional de Defesa de 2024 e nos documentos de planejamento de investimento relacionados, que descrevem as prioridades de financiamento de capacidades de longo prazo. Além disso, Canberra apontou um investimento de capacidade de 330 bilhões de dólares australianos até 2034, incluindo financiamento adicional para combatentes de superfície, preparação, ataques de longo alcance e sistemas autônomos.
Aqui está a parte que a maioria das pessoas perde: nem todas as ações de defesa da ASX são negociadas da mesma forma. Alguns ficam perto da construção naval. Alguns são nomes de contra-drones e alguns são operadores menores e de alto risco, onde um contrato pode importar muito mais do que o mercado supõe.
Esses cinco nomes não são uma lista de compras, mas sim uma lista prática para investidores que tentam entender onde o impulso de compras pode realmente aparecer no ASX.
1) Austal (ASX: ASB)
A Austal é uma das empresas listadas na ASX mais diretamente expostas ao gasoduto de construção naval da Austrália, embora a execução do contrato, as margens e o prazo de entrega continuem sendo variáveis importantes.
Eles não estão apenas ganhando contratos aleatórios; eles assinaram um grande acordo legal (o Acordo Estratégico de Construção Naval) que os torna parceiros oficiais para construir a próxima geração de navios militares de médio porte da Austrália na Austrália Ocidental.
Em fevereiro de 2026, o governo deu luz verde à Austal para um projeto de 4 bilhões de dólares. Isso não é para apenas um navio, é para 8 navios “Landing Craft Heavy”. São enormes navios de transporte (cerca de 100 metros de comprimento) projetados para transportar tanques pesados e equipamentos diretamente para a praia. Mas aqui está a parte que a maioria das pessoas perde: a construção naval é uma maratona, não um sprint.
Como você pode ver no cronograma de entrega, embora a construção comece em 2026, o navio final não será entregue até 2038. Para um investidor, isso significa que a Austal tem um fluxo de renda “garantido” para os próximos 12 anos, mas ele precisa ser muito bom em gerenciar seus custos durante esse longo período para realmente obter lucro.
2) DroneShield (ASX: DRO)
Se você já viu imagens de pequenos drones interrompendo campos de batalha modernos, o DroneShield está construindo parte do “botão de desligamento”. Seu foco é a tecnologia de combate a drones, incluindo sistemas que detectam, interrompem ou derrotam drones usando guerra eletrônica, sensores e ferramentas baseadas em software, em vez de depender apenas de munições tradicionais.
No início de 2026, a DroneShield deixou de ser uma startup promissora e entrou em uma fase comercial muito maior. Ela registrou uma receita do ano fiscal de 2025 de A $216,5 milhões, um aumento de 276% em relação ao ano fiscal de 2024, e disse que iniciou o ano fiscal de 2026 com A $103,5 milhões em receita comprometida.
Um ponto que o mercado pode ignorar é a camada de software no modelo. A DroneShield registrou receita de A $11,6 milhões em software como serviço (SaaS) no ano fiscal de 2025 e disse que está trabalhando para que o SaaS represente 30% da receita em cinco anos. Seu modelo de assinatura inclui atualizações de software para sistemas implantados, o que adiciona um fluxo crescente de receita recorrente junto com as vendas de hardware.
Entre as ações de defesa da ASX, a DroneShield é uma das formas mais diretas de seguir o tema Counter-UAS. É também um dos nomes em que o sentimento pode oscilar rapidamente, porque as histórias de crescimento podem aumentar e diminuir quando o tempo do pedido muda.
A EOS constrói tanto o “cérebro” quanto o “músculo” para plataformas militares. É mais conhecido por sistemas de armas remotas, que permitem aos operadores controlar torres armadas de dentro de veículos protegidos, e por sistemas de laser de alta energia voltados para a defesa contra drones. A EOS disse que seu acúmulo incondicional atingiu cerca de A $459,1 milhões no início de 2026, após uma série de vitórias de contratos até 2025. Isso aponta para uma base muito maior de trabalho seguro, embora o tempo de entrega e a conversão de receita ainda sejam importantes.
A EOS assinou um contrato de €71,4 milhões, cerca de A $125 milhões, com um cliente europeu para um sistema de armas a laser de alta energia de 100 quilowatts. A EOS afirma que o sistema foi projetado para um baixo custo por tiro e pode acionar até 20 drones por minuto. O governo australiano reservou A $1,3 bilhão em 10 anos para a aquisição de capacidade de combate a drones, e a EOS divulgou que fez parte de uma equipe bem-sucedida de licitação do LAND 156. Isso não garante receita futura, mas dá suporte à visibilidade de médio prazo em um mercado que a empresa já tem como alvo.
A EOS parece uma história de recuperação, mas que ainda depende da execução. A empresa se reorientou em torno de sistemas de armas remotas, sistemas de combate a drones e lasers, todas áreas vinculadas a maiores gastos com defesa. A questão principal é se ela pode continuar convertendo o acúmulo e o pipeline em receita gerada e, ao mesmo tempo, manter a disciplina do balanço patrimonial.
4) Codan (ASX: CDA)
Às vezes, a Codan fica de fora das listas casuais de ações de defesa porque é mais diversificada. Isso pode ser um descuido. Em seus resultados do primeiro semestre do ano fiscal de 26, a Codan disse que sua empresa de comunicações projeta comunicações de missão crítica para os mercados globais de segurança pública e militar. A receita de comunicações aumentou 19% para A $221,8 milhões. A empresa também disse que a DTC gerou um forte crescimento da demanda de defesa e sistemas não tripulados, com a receita de sistemas não tripulados aumentando 68%, para A $73 milhões. Codan disse que cerca de metade dessa receita não tripulada estava vinculada a aplicações de defesa operacional em zonas de conflito.
É aqui que a história se torna mais matizada. Em uma cesta de ações de defesa da ASX, a Codan pode oferecer um perfil diferente, com menos sensibilidade pura às manchetes, maior diversificação operacional e exposição significativa a comunicações militares e sistemas não tripulados, sem ser um nome de tema único. Essa diversificação também pode significar que as ações nem sempre são negociadas como um nome de defesa puro.
A HighCom está no final especulativo desta lista e deve ser rotulada dessa forma. A empresa afirma que seus dois negócios contínuos são a HighCom Armor, que fornece proteção balística, e a HighCom Technology, que fornece e mantém sistemas aéreos não tripulados de pequeno e médio porte, sistemas aéreos contra-não tripulados e suporte relacionado de engenharia, integração, manutenção e logística para o ADF e outras forças armadas regionais alinhadas.
No primeiro semestre do ano fiscal de 26, a receita de operações contínuas caiu 59% para A $10,9 milhões, enquanto o EBITDA passou para uma perda de A $5,4 milhões em relação ao lucro de A $1,9 milhão no ano anterior. A HighCom também divulgou A $5,1 milhões em receita de tecnologia HighCom, incluindo A $3,5 milhões de peças de reposição para pequenos sistemas aéreos não tripulados (SUAS) e A $1,6 milhão de serviços de sustentação fornecidos ao Departamento de Defesa da Austrália.
Então, sim, a HighCom é uma das ações de defesa ASX mais sensíveis financeiramente no conselho. Mas também é o tipo de nome menor que pode mostrar como as compras se transformam em equipamentos de suporte, sustentação e proteção especializados.
Principais observações do mercado
Acompanhe os marcos do programa, não apenas as manchetes políticas. A adjudicação de contratos, o início da fabricação, os cronogramas de entrega e o trabalho de manutenção geralmente importam mais do que um único dia de anúncio.
Separe a exposição pura da exposição diversificada. O DroneShield e o EOS estão mais próximos de temas concentrados de tecnologia de defesa, enquanto o Codan traz exposição às comunicações em um mix de negócios mais amplo.
Assista aos temas de capacidade soberana na Austrália. A Austal e a EOS estão vinculadas à fabricação local, à integração e às cadeias de suprimentos australianas, o que apóia o tema mais amplo de capacidade soberana desse grupo.
Preste atenção aos balanços e à conversão de caixa. O ímpeto de compras pode ser real mesmo quando o tempo fica confuso. A última metade da HighCom é um lembrete disso.
As manchetes de defesa podem parecer imediatas. Os ganhos geralmente não são. O principal trabalho naval da Austal se estende até a próxima década. Os contratos EOS são entregues ao longo de vários anos. O fluxo de pedidos da DroneShield parece forte, mas a empresa ainda separa a receita comprometida de uma oportunidade mais ampla de pipeline. HighCom mostra o outro lado da moeda. A exposição à aquisição não se traduz automaticamente em uma execução financeira tranquila.
As referências a ações de defesa listadas na ASX são apenas informações gerais, não uma recomendação para comprar, vender ou manter qualquer título ou CFD. Essas ações podem ser altamente voláteis e sensíveis ao prazo do contrato, à política governamental, à geopolítica, ao risco de execução e às condições do mercado. Expectativas de backlog, pipeline e receita não são garantias de desempenho futuro.
A última mudança no setor de petróleo colocou os nomes de energia de volta em foco. Nos últimos seis meses, a Exxon Mobil e a Baker Hughes superaram o petróleo Brent em uma base normalizada, a Chevron permaneceu amplamente construtiva, o SLB ficou atrás da commodity e o consenso dos corretores da Woodside foi mais medido.
Quando o petróleo bruto se move, o impacto raramente permanece contido na própria mercadoria. Os preços mais altos do petróleo podem afetar as expectativas de inflação, os custos de envio e as margens corporativas em toda a economia global.
O que a última jogada está mostrando
Existem três maneiras pelas quais as empresas podem se beneficiar de preços mais firmes do petróleo:
Produzindo petróleo e gás, vendendo a mercadoria a um preço mais alto
Fornecimento de serviços e equipamentos aos produtores
Transportando petróleo ao redor do mundo
Cada um dos nomes abaixo representa um desses tipos de exposição, com um perfil de risco diferente quando o petróleo bruto sobe.
1. Exxon Mobil (NYSE: XOM)
Nos últimos seis meses, a Exxon Mobil superou o petróleo Brent, com o preço de suas ações subindo quase 35% em comparação com cerca de 30% do Brent. Em 11 de março de 2026, ambos estavam sendo negociados pouco mais de 3% abaixo de seus máximos históricos, enquanto a Exxon permaneceu perto de sua alta de 52 semanas.
A Exxon Mobil é uma das maiores empresas de petróleo integradas do mundo, com exposição que abrange exploração, produção, refino e produtos químicos. Quando os preços do petróleo sobem, seus negócios upstream podem se beneficiar de margens mais amplas, enquanto sua escala e diversificação podem ajudar a amortecer partes mais fracas do ciclo.
Desempenho de 6 meses da Exxon Mobil (XOM) versus Brent Crude
O desempenho do petróleo bruto da Exxon Mobil e do Brent normalizou em seis meses, em 11 de março de 2026, no momento em que este artigo foi escrito | Fonte: Share Trader
Consenso dos analistas: compre
De acordo com dados do TradingView, o sentimento dos analistas em relação à Exxon é amplamente positivo. Dos 31 analistas acompanhados, 15 classificam a ação como Strong Buy or Buy, 13 a classificam como Hold, 1 a classifica como Sell e 2 a classificam como Strong Sell.
Essa visão positiva está ligada à força do balanço patrimonial da Exxon e à produção com margens mais altas. Os analistas mais otimistas projetam uma meta de preço de 1 ano de até USD 183,00. O preço-alvo médio é de USD 145,00, cerca de 3,6% abaixo do preço de negociação atual.
Classificações e metas de preço dos analistas da Exxon Mobil, em 11 de março de 2026 no momento em que este artigo foi escrito | Fonte: TradingView
2. Chevron (NYSE: CVX)
A Chevron é outra empresa global integrada que se beneficiou da recente alta do petróleo bruto, com suas ações sendo negociadas perto de máximos de 52 semanas. Como a Exxon, a Chevron opera em toda a cadeia de valor, incluindo produção inicial, refino e marketing.
A aquisição completa da Hess pela Chevron adiciona a Guiana e outros ativos upstream, que alguns analistas consideram favoráveis ao longo do tempo. Dito isso, o impacto nos lucros permanece sujeito aos riscos de integração, execução de projetos e preços de commodities.
Desempenho da Exxon Mobil vs Chevron, gráfico de 6 meses
A Chevron e a Exxon Mobil normalizaram o desempenho em seis meses, a partir de 11 de março de 2026, no momento em que este artigo foi escrito | Fonte: Share Trader
Consenso dos analistas: compre
A Chevron é vista de forma semelhante à Exxon, com o sentimento do corretor permanecendo amplamente construtivo. Agregados recentes do TradingView mostram 30 analistas cobrindo as ações nos últimos três meses, com 17 classificando-as como Forte Compra ou Compra, 11 em Retenção, 1 em Venda e 1 em Forte Venda.
Analistas destacaram o portfólio diversificado da Chevron e a contribuição potencial da Hess, embora a volatilidade dos preços das commodities e o risco de execução possam manter alguns mais cautelosos.
Classificações de analistas e metas de preço da Chevron, em 11 de março de 2026 no momento em que este artigo foi escrito | Fonte: TradingView
3. SLB (NYSE: SLB)
A SLB, anteriormente conhecida como Schlumberger, é uma das maiores provedoras de serviços e tecnologia de campos petrolíferos do mundo. Ela fornece ferramentas, equipamentos e software que ajudam os produtores a encontrar, perfurar e concluir poços com mais eficiência.
Nos últimos seis meses, o SLB ficou atrás do petróleo Brent, com o preço das ações sendo negociado em uma faixa mais agitada e permanecendo abaixo de seu pico recente. Isso sugere que o cenário mais forte do petróleo não se refletiu totalmente no preço das ações.
Esse padrão não é incomum em empresas de serviços de campos petrolíferos, nas quais as decisões de gastos dos clientes geralmente seguem os movimentos da mercadoria subjacente, em vez de se moverem em sintonia com eles. Qualquer reavaliação futura dependeria de fatores, incluindo gastos de capital do produtor, prazo do contrato, preços de serviços, atividade offshore e condições de mercado mais amplas. Não se deve presumir que um preço mais firme do petróleo se traduza automaticamente em um preço mais firme das ações da SLB.
SLB vs petróleo Brent, desempenho normalizado de 6 meses
O desempenho do petróleo bruto SLB e Brent normalizou em seis meses, em 11 de março de 2026 no momento em que este artigo foi escrito | Fonte: Share Trader
Consenso: Comprar
De acordo com dados do TradingView, o consenso de analistas terceirizados sobre o SLB é Buy. Dos 33 analistas que cobrem a ação, 27 a classificam como Strong Buy or Buy, 4 a classificam como Hold e 2 a classificam como Sell ou Strong Sell.
Isso indica um sentimento construtivo dos corretores, embora a diferença entre os preços do petróleo e o desempenho recente do preço das ações da SLB sugira que os investidores ainda possam querer evidências mais claras de melhorar a demanda e os preços dos serviços antes que as ações reflitam totalmente o cenário mais forte das commodities.
Classificações de analistas e metas de preço do SLB, em 11 de março de 2026 no momento em que este artigo foi escrito | Fonte: TradingView
4. Baker Hughes (NASDAQ: BKR)
A Baker Hughes é outra grande fornecedora de serviços e equipamentos para campos petrolíferos, com exposição adicional a segmentos industriais, como GNL e infraestrutura de energia. Mesmo quando os preços do petróleo não estão em níveis extremos, os avanços na tecnologia de perfuração e os menores custos de equilíbrio ajudaram a manter lucrativas muitas áreas de xisto, apoiando a demanda por seus serviços.
A empresa também foi descrita como bem posicionada por causa de seu balanço patrimonial e sua exposição à atividade contínua de exploração e produção. Em um período de preços do petróleo mais altos, ou mesmo estáveis para firmes, essa combinação de serviços e tecnologia de energia pode criar vários geradores de receita.
Nos últimos seis meses, a Baker Hughes superou materialmente o petróleo Brent de forma normalizada. O Brent foi negociado em uma faixa muito mais estreita durante a maior parte do período, antes de subir mais tarde, enquanto o BKR subiu de forma mais constante e alcançou um ganho cumulativo significativamente mais forte. Isso sugere que o preço das ações da BKR se beneficiou não apenas do cenário do petróleo, mas também do otimismo específico da empresa e do apoio mais amplo aos nomes de serviços de campos petrolíferos e tecnologia de energia.
BKR vs petróleo Brent, desempenho normalizado de 6 meses
O desempenho bruto de Baker Hughes e Brent normalizou em seis meses, em 11 de março de 2026, no momento em que este artigo foi escrito | Fonte: Share Trader
Consenso dos analistas: compre
De acordo com os dados do TradingView, a Baker Hughes é classificada como Strong Buy. Com base em 25 analistas que forneceram classificações nos últimos três meses, 16 classificaram a ação como Compra Forte, 3 a classificaram como Compra, 4 a classificaram como Manter, 1 a classificou como Venda e 1 a classificou como Forte Venda.
No geral, o sentimento dos corretores em relação à Baker Hughes é amplamente positivo, com mais de três quartos dos analistas de cobertura classificando as ações como Strong Buy ou Buy, enquanto a maioria do restante estava em espera. Essa visão solidária dos analistas parece refletir a exposição da BKR aos serviços tradicionais de campos petrolíferos e aos mercados mais amplos de energia e tecnologia industrial, incluindo a infraestrutura de GNL.
Classificações e metas de preço dos analistas da Baker Hughes, em 11 de março de 2026 no momento em que este artigo foi escrito | Fonte: TradingView
5. Woodside Energy (ASX: WDS)
A Woodside Energy apresenta à lista um produtor com sede na Austrália com exposição significativa aos mercados de GNL e petróleo. Seus lucros estão intimamente ligados aos preços realizados das commodities, o que torna as ações sensíveis às mudanças nos preços do petróleo bruto e do gás, bem como à demanda global de energia mais ampla.
Em comparação com alguns dos maiores nomes de energia dos EUA, o sentimento dos corretores em relação à Woodside parece mais moderado. Os investidores estão equilibrando a exposição global da empresa ao GNL e a alavancagem para preços de energia mais fortes contra preços mais baixos realizados recentemente, riscos de projeto e execução e pressões regulatórias e de descarbonização de longo prazo.
Consenso dos analistas: aguarde
De acordo com os dados do TradingView, a Woodside é classificada como Neutro/Hold. Dos 15 analistas, 2 a classificam como Strong Buy, 4 a classificam como Buy, 7 a classificam como Hold, 1 a classifica como Sell e 1 a classifica como Strong Sell.
O preço-alvo médio de 12 meses é de A $29,20 versus um preço atual de cerca de A $30,28, o que implica uma queda de aproximadamente 3,6%. Em relação aos maiores nomes de energia dos EUA nesta lista, isso aponta para uma visão mais cautelosa do corretor.
Classificações e metas de preço dos analistas da Woodside Energy, em 11 de março de 2026 no momento em que este artigo foi escrito | Fonte: TradingView
6. Operadores globais de petroleiros
As empresas petroleiras podem se beneficiar quando preços mais firmes do petróleo, mudanças na política da OPEP+ e tensão geopolítica aumentam os embarques de longa distância e interrompem as rotas comerciais usuais. Quando os volumes de petróleo aumentam, a demanda de “toneladas-milha” pode suportar as tarifas diárias e a lucratividade dos petroleiros, mesmo quando o mercado de energia em geral é volátil.
Consenso dos analistas: N/A
Essa é uma categoria mais ampla do setor, em vez de uma única ação negociada publicamente, portanto, não há um consenso único de corretor a ser citado. As opiniões dos analistas precisariam ser avaliadas no nível da empresa, como Frontline plc (FRO), Euronav (EURN) ou Scorpio Tankers (STNG).
De forma mais ampla, o setor é cíclico. Qualquer benefício de mercados de transporte marítimo mais apertados pode ser revertido se as rotas se normalizarem, as taxas de frete caírem ou a oferta aumentar.
Riscos e restrições
Os preços mais altos do petróleo não eliminam o risco desses nomes.
Se os preços subirem muito, muito rápido, a destruição da demanda e as respostas políticas podem pesar sobre os lucros futuros.
Decisões políticas da OPEP+ ou de outros grandes produtores podem reverter uma alta aumentando a oferta.
As empresas de serviços e petroleiros são altamente cíclicas. Quando o ciclo muda, o poder de precificação pode diminuir rapidamente.
Questões específicas da empresa, incluindo execução de projetos, preços realizados e gastos de capital, ainda são importantes.
Juntos, esses nomes podem se beneficiar de preços mais firmes do petróleo, mas também acarretam riscos setoriais, geopolíticos e de nível empresarial que merecem muita atenção.
Principais observações do mercado
A Woodside fornece exposição a GNL e petróleo, embora o sentimento atual dos corretores seja mais neutro do que o dos grandes nomes dos EUA.
Os operadores de petroleiros podem se beneficiar quando os mercados de frete se estreitam, embora esse comércio permaneça altamente cíclico e dependente da rota.
A SLB e a Baker Hughes podem se beneficiar se preços mais firmes do petróleo se traduzirem em mais atividades de perfuração e conclusão, mas a resposta do preço das ações tem sido mista.
A Exxon Mobil e a Chevron oferecem exposição direta a margens upstream mais fortes, apoiadas por operações diversificadas.
As referências neste artigo à Exxon Mobil, Chevron, SLB, Baker Hughes, Woodside, operadores de petroleiros, classificações consensuais de analistas e metas de preço estão incluídas apenas para comentários gerais do mercado e não constituem uma recomendação ou oferta em relação a qualquer produto financeiro ou título. Dados de terceiros, incluindo classificações de consenso e preços-alvo, podem mudar sem aviso prévio e não devem ser considerados isoladamente. As exposições à energia e ao transporte marítimo são cíclicas e podem ser materialmente afetadas pela volatilidade dos preços das commodities, preços realizados, mudanças na produção, execução de projetos, interrupções geopolíticas, condições do mercado de frete, desenvolvimentos regulatórios e mudanças no sentimento dos investidores. Qualquer opinião sobre os potenciais beneficiários dos preços mais altos do petróleo está sujeita a incertezas significativas.
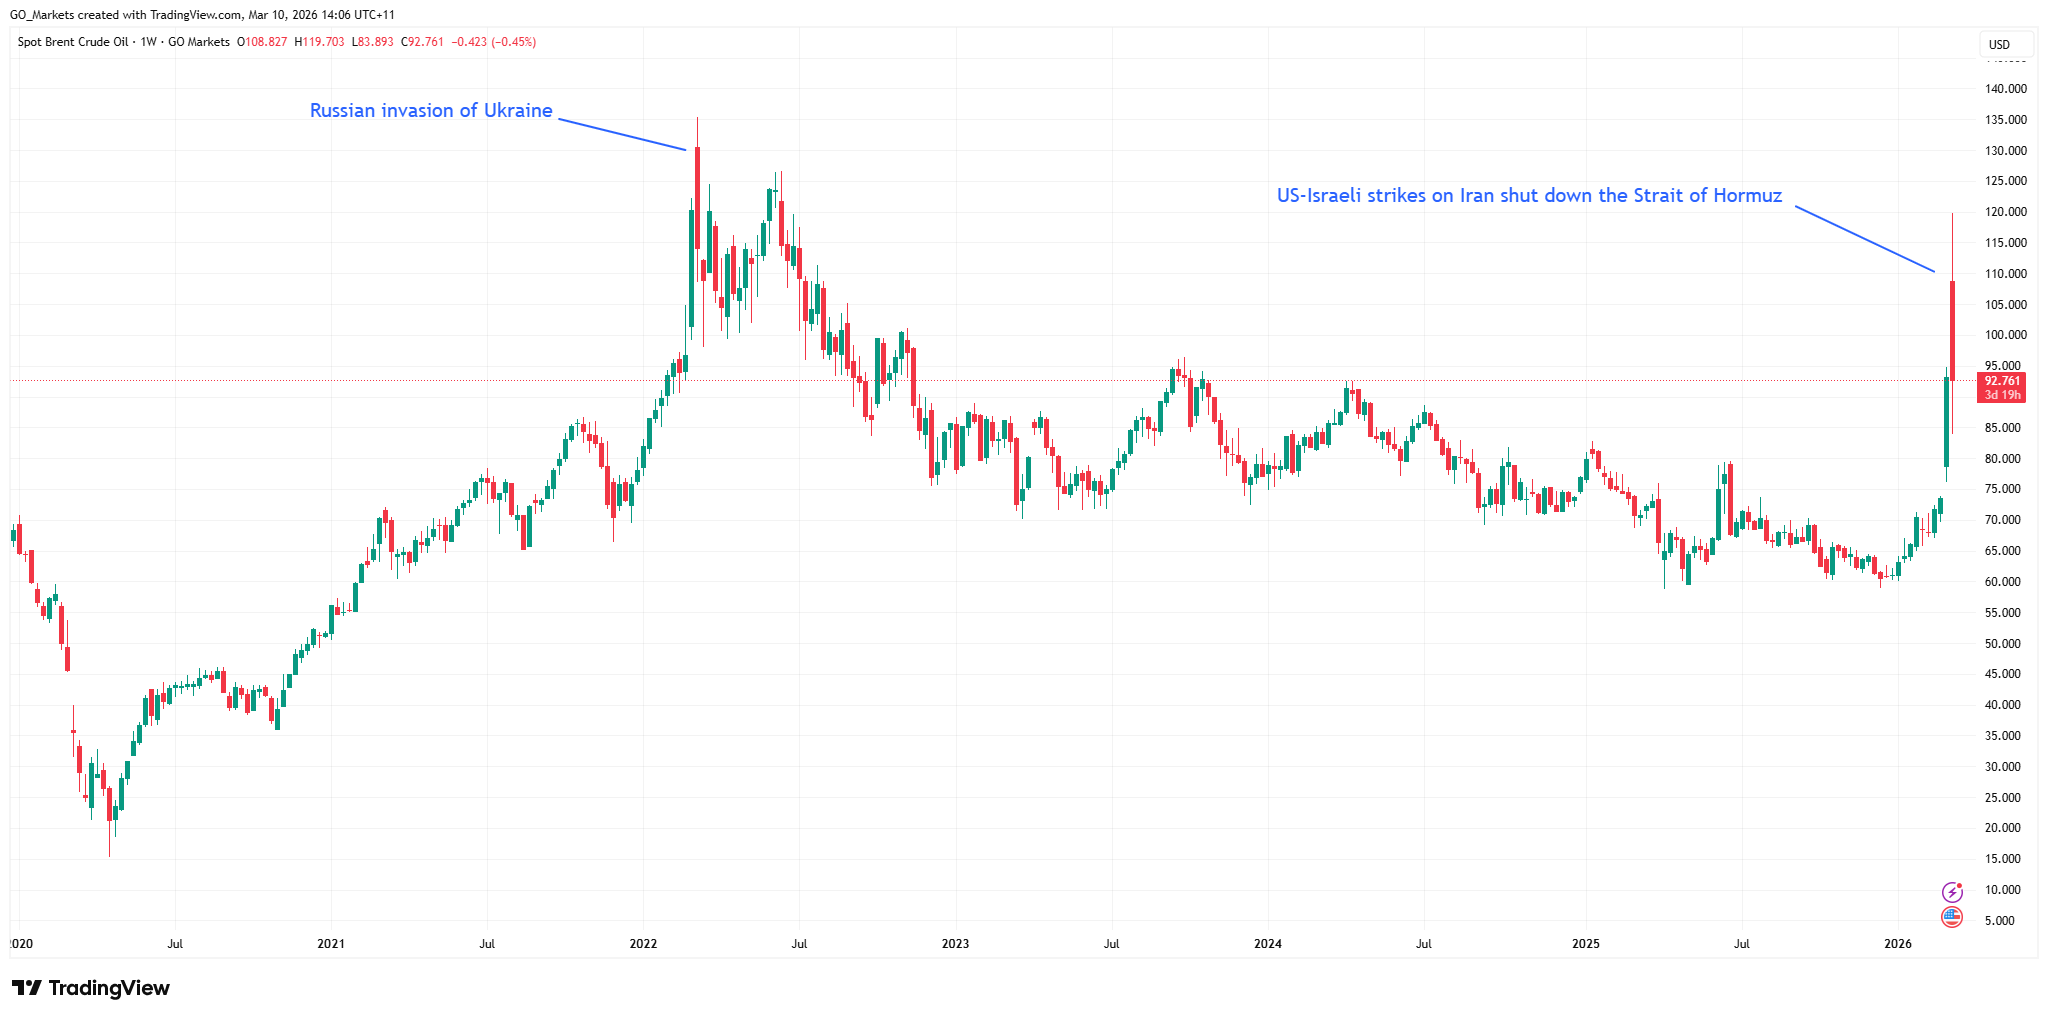
O petróleo atingiu USD 100 o barril quando os ataques dos EUA e Israel ao Irã fecharam o Estreito de Ormuz, provocando o maior pico de petróleo bruto em um único dia desde a invasão russa da Ucrânia.
Fatos rápidos
Pico intradiário do Brent Crude: USD 119,50/BBL (até 50% em 10 dias)
O tráfego relatado de embarcações pelo Estreito de Ormuz caiu para < 20% da média
Analistas estimam que até 20% dos fluxos globais de petróleo marítimos podem ser afetados se a interrupção persistir (a maior desde a crise de Suez de 1956)
Por que os preços do petróleo subiram?
Os mercados de petróleo acordaram em 9 de março de 2026 com ataques conjuntos dos EUA e Israel aos depósitos de petróleo iranianos que levaram o petróleo Brent a um pico intradiário de USD 119,50 o barril (seu nível mais alto desde o início da guerra Rússia-Ucrânia) antes de recuar perto de USD 90.
A Guarda Revolucionária do Irã ameaçou atacar qualquer petroleiro que transite pelo Estreito de Ormuz, reduzindo o tráfego de navios para quase zero.
O estreito carrega cerca de 20% do suprimento diário de petróleo marítimo do mundo, e os analistas estão descrevendo a interrupção como a maior desde a crise de Suez de 1956-57. O petróleo bruto já havia subido cerca de 16% na semana anterior às greves, à medida que os mercados se valorizavam devido à escalada das tensões.
O economista-chefe da ExxonMobil, Tyler Goodspeed, disse que a distribuição dos resultados prováveis se inclina fortemente para que o Estreito permaneça efetivamente fechado por mais tempo do que os mercados esperam atualmente.
Enquanto isso, Donald Trump minimizou a necessidade de liberar reservas estratégicas de petróleo, chamando qualquer problema de preço de curto prazo de um pequeno custo para a segurança global. O G7 está discutindo um lançamento coordenado do SPR, que brevemente reduziu os preços para USD 110 antes que as negociações no final da sessão os reduzissem após novos comentários de Trump sobre um potencialmente “fim rápido” do conflito.
Maior pico de petróleo bruto em um único dia desde 2022 | TradingView
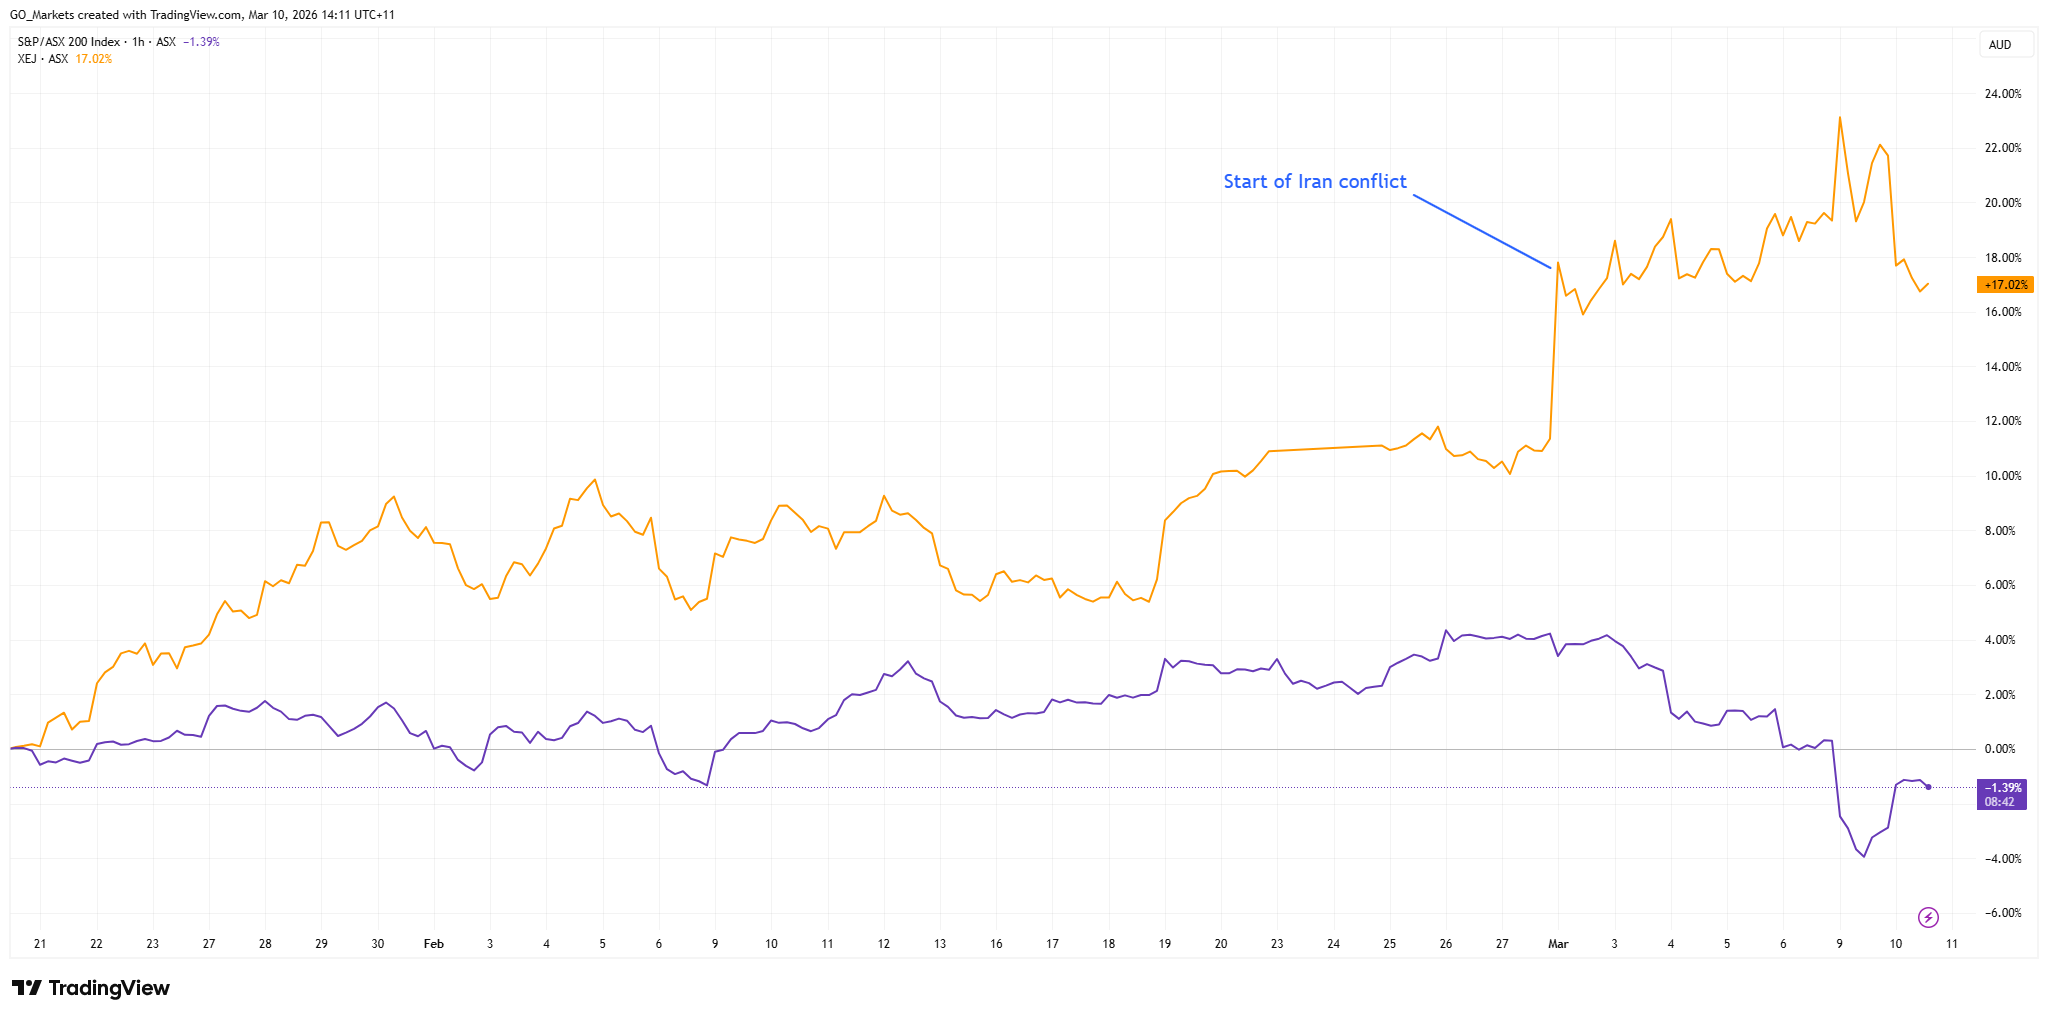
Reação do mercado
A resposta do ASX foi nitidamente dividida. O ASX 200 mais amplo caiu à medida que os investidores avaliaram a inflação e a potencial destruição da demanda, com ações de materiais como a BHP caindo perto de 6%. A energia era o único setor verde. O FMI estima que cada aumento sustentado de 10% nos preços do petróleo adiciona 0,4% à inflação global e reduz o crescimento global em 0,15%.
Se o petróleo se mantiver acima de USD 100 por um longo período, o risco de recessão nas principais economias importadoras poderá aumentar materialmente. Os investidores da ASX em energia estão navegando em um mundo onde o mesmo vento favorável para os produtores pode se tornar um obstáculo para a demanda global.
Índice de energia S&P/ASX 200 versus S&P/ASX 200 | TradingView
As 5 principais ações de energia da ASX a serem observadas
1. Grupo Woodside Energy (ASX: WDS)
A Woodside é a maior produtora de petróleo e gás listada na Austrália e costuma ser observada de perto quando os preços da energia sobem. A Woodside opera a Pluto LNG em Pilbara com uma participação de 90%, o projeto North West Shelf LNG e um crescente portfólio internacional. As ações atingiram uma nova alta de 52 semanas e subiram 33% desde janeiro.
Dividendos totalmente franqueados adicionam suporte ao rendimento; a empresa pagou recentemente um dividendo final de 83,4 centavos por ação. Para investidores cautelosos, a Woodside é um potencial ponto de entrada no setor no momento.
2. Santos Ltd (ASX: STO)
Santos é a segunda maior produtora de petróleo e gás da ASX, com uma capitalização de mercado de quase A $23 bilhões, e oferece uma história convincente de crescimento da produção, além do vento favorável de preços.
O projeto de gás Barossa enviou sua primeira carga de GNL em janeiro de 2026, e espera-se que a produção cresça cerca de 30% até 2027, à medida que Barossa e o projeto Pikka no Alasca cresçam juntos.
O CEO Kevin Gallagher vendeu A $5,6 milhões em ações no final de fevereiro para cobrir as obrigações fiscais pessoais, o que alguns investidores sinalizaram como um sinal de cautela, mas os fundamentos do crescimento permanecem intactos.
3. Karoon Energy (ASX: KAR)
Produtora de petróleo de média capitalização com 100% de participação nos campos de petróleo offshore de Bauna e Patola, na Bacia de Santos, no Brasil, além dos ativos da Who Dat no Golfo do México, foi a maior impulsionadora de todo o ASX 200 nas últimas sessões.
Com uma capitalização de mercado próxima a A $1,25 bilhão e uma relação preço/lucro (P/E) de 7, a ação é extraordinariamente sensível aos movimentos do preço do petróleo. A Karoon gerou uma margem de fluxo de caixa livre de aproximadamente 45% contra um caso base de USD 65 por barril. A preços atuais, o perfil do fluxo de caixa pode melhorar dramaticamente.
Um novo dividendo de A $0,031 por ação foi declarado junto com a orientação de produção para 2026. O risco é simétrico: se o prêmio de guerra diminuir e o petróleo voltar para meados dos anos 60, a retração pode ser tão acentuada quanto a alta.
4. Ampol Ltd (ASX: ALD)
A Ampol é a maior empresa integrada de combustível da Austrália, operando a refinaria de petróleo Lytton em Brisbane ao lado de uma rede nacional de varejo e distribuição de combustível e a Z Energy na Nova Zelândia.
Os preços mais altos do petróleo são uma faca de dois gumes para a Ampol. Eles melhoram o valor bruto do estoque e as margens de refino, mas podem reduzir a demanda do consumidor ao longo do tempo.
Uma aquisição planejada de A $1,1 bilhão da rede de combustível e conveniência da EG Australia adiciona um catalisador de crescimento estrutural independente do preço do petróleo. Um rendimento final de 100% franqueado de 3,2% também poderia fornecer suporte de renda.
5. Energia da praia (ASX: BPT)
A Beach Energy teve um desempenho inferior ao do setor de energia ASX em geral no ano passado, sobrecarregada pelos desafios de reposição de reservas e por um difícil período de lucros recentes.
No entanto, a empresa superou as estimativas semestrais do ano fiscal de 2026 em 13,5%, e a administração manteve a orientação de produção para o ano inteiro de 19,7 a 22,0 milhões de barris de óleo equivalente.
A base de ativos da Beach abrange as bacias de Cooper e Eromanga, a Bacia de Otway, o projeto de exportação de GNL Waitsia da Bacia de Perth e a Nova Zelândia.
Um rendimento de dividendos de 6,1% com vencimento em março de 2026 e o baixo beta da ação de 0,20 significam que ela poderia oferecer materialmente menos volatilidade do que seus pares.
O CEO Brett Woods sinalizou interesse em fusões e aquisições em ativos de gás da Costa Leste e uma meta de redução de 35% na intensidade de emissões até 2030. Um ambiente sustentado de alto teor de petróleo pode impedir a tendência de declínio da produção de Beach.
O que assistir a seguir
Os mercados de energia estão se movendo com base no medo e na geopolítica, e não nos fundamentos, o que significa que o comércio pode se reverter tão rápido quanto começou. A questão chave é se esse é um breve prêmio de guerra ou o início de uma ruptura estrutural sustentada.
Um fechamento prolongado da Hormuz pode elevar ainda mais o Brent e manter os estoques de energia da ASX elevados. Uma resolução diplomática rápida ou uma liberação coordenada do SPR do G7 poderiam reduzir o petróleo e reverter grande parte do movimento recente.
Sobre os dois cenários está a questão da recessão: se o petróleo se mantiver acima de USD 100 por seis a oito semanas, os mercados poderão começar a precificar as respostas do banco central e a destruição da demanda, o que pode, em última análise, pesar sobre o setor de energia, que está superando o desempenho atual.
As ações de defesa da ASX estão de volta em mais listas de observação e, de acordo com o Instituto Internacional de Pesquisa da Paz de Estocolmo (SIPRI), os gastos militares globais atingiram aproximadamente USD 2,718 trilhões em 2024, um aumento de 9,4% em termos reais.
As configurações atuais de defesa da Austrália estão definidas na Estratégia Nacional de Defesa de 2024 e nos documentos de planejamento de investimento relacionados, que descrevem as prioridades de financiamento de capacidades de longo prazo. Além disso, Canberra apontou um investimento de capacidade de 330 bilhões de dólares australianos até 2034, incluindo financiamento adicional para combatentes de superfície, preparação, ataques de longo alcance e sistemas autônomos.
Aqui está a parte que a maioria das pessoas perde: nem todas as ações de defesa da ASX são negociadas da mesma forma. Alguns ficam perto da construção naval. Alguns são nomes de contra-drones e alguns são operadores menores e de alto risco, onde um contrato pode importar muito mais do que o mercado supõe.
Esses cinco nomes não são uma lista de compras, mas sim uma lista prática para investidores que tentam entender onde o impulso de compras pode realmente aparecer no ASX.
1) Austal (ASX: ASB)
A Austal é uma das empresas listadas na ASX mais diretamente expostas ao gasoduto de construção naval da Austrália, embora a execução do contrato, as margens e o prazo de entrega continuem sendo variáveis importantes.
Eles não estão apenas ganhando contratos aleatórios; eles assinaram um grande acordo legal (o Acordo Estratégico de Construção Naval) que os torna parceiros oficiais para construir a próxima geração de navios militares de médio porte da Austrália na Austrália Ocidental.
Em fevereiro de 2026, o governo deu luz verde à Austal para um projeto de 4 bilhões de dólares. Isso não é para apenas um navio, é para 8 navios “Landing Craft Heavy”. São enormes navios de transporte (cerca de 100 metros de comprimento) projetados para transportar tanques pesados e equipamentos diretamente para a praia. Mas aqui está a parte que a maioria das pessoas perde: a construção naval é uma maratona, não um sprint.
Como você pode ver no cronograma de entrega, embora a construção comece em 2026, o navio final não será entregue até 2038. Para um investidor, isso significa que a Austal tem um fluxo de renda “garantido” para os próximos 12 anos, mas ele precisa ser muito bom em gerenciar seus custos durante esse longo período para realmente obter lucro.
2) DroneShield (ASX: DRO)
Se você já viu imagens de pequenos drones interrompendo campos de batalha modernos, o DroneShield está construindo parte do “botão de desligamento”. Seu foco é a tecnologia de combate a drones, incluindo sistemas que detectam, interrompem ou derrotam drones usando guerra eletrônica, sensores e ferramentas baseadas em software, em vez de depender apenas de munições tradicionais.
No início de 2026, a DroneShield deixou de ser uma startup promissora e entrou em uma fase comercial muito maior. Ela registrou uma receita do ano fiscal de 2025 de A $216,5 milhões, um aumento de 276% em relação ao ano fiscal de 2024, e disse que iniciou o ano fiscal de 2026 com A $103,5 milhões em receita comprometida.
Um ponto que o mercado pode ignorar é a camada de software no modelo. A DroneShield registrou receita de A $11,6 milhões em software como serviço (SaaS) no ano fiscal de 2025 e disse que está trabalhando para que o SaaS represente 30% da receita em cinco anos. Seu modelo de assinatura inclui atualizações de software para sistemas implantados, o que adiciona um fluxo crescente de receita recorrente junto com as vendas de hardware.
Entre as ações de defesa da ASX, a DroneShield é uma das formas mais diretas de seguir o tema Counter-UAS. É também um dos nomes em que o sentimento pode oscilar rapidamente, porque as histórias de crescimento podem aumentar e diminuir quando o tempo do pedido muda.
A EOS constrói tanto o “cérebro” quanto o “músculo” para plataformas militares. É mais conhecido por sistemas de armas remotas, que permitem aos operadores controlar torres armadas de dentro de veículos protegidos, e por sistemas de laser de alta energia voltados para a defesa contra drones. A EOS disse que seu acúmulo incondicional atingiu cerca de A $459,1 milhões no início de 2026, após uma série de vitórias de contratos até 2025. Isso aponta para uma base muito maior de trabalho seguro, embora o tempo de entrega e a conversão de receita ainda sejam importantes.
A EOS assinou um contrato de €71,4 milhões, cerca de A $125 milhões, com um cliente europeu para um sistema de armas a laser de alta energia de 100 quilowatts. A EOS afirma que o sistema foi projetado para um baixo custo por tiro e pode acionar até 20 drones por minuto. O governo australiano reservou A $1,3 bilhão em 10 anos para a aquisição de capacidade de combate a drones, e a EOS divulgou que fez parte de uma equipe bem-sucedida de licitação do LAND 156. Isso não garante receita futura, mas dá suporte à visibilidade de médio prazo em um mercado que a empresa já tem como alvo.
A EOS parece uma história de recuperação, mas que ainda depende da execução. A empresa se reorientou em torno de sistemas de armas remotas, sistemas de combate a drones e lasers, todas áreas vinculadas a maiores gastos com defesa. A questão principal é se ela pode continuar convertendo o acúmulo e o pipeline em receita gerada e, ao mesmo tempo, manter a disciplina do balanço patrimonial.
4) Codan (ASX: CDA)
Às vezes, a Codan fica de fora das listas casuais de ações de defesa porque é mais diversificada. Isso pode ser um descuido. Em seus resultados do primeiro semestre do ano fiscal de 26, a Codan disse que sua empresa de comunicações projeta comunicações de missão crítica para os mercados globais de segurança pública e militar. A receita de comunicações aumentou 19% para A $221,8 milhões. A empresa também disse que a DTC gerou um forte crescimento da demanda de defesa e sistemas não tripulados, com a receita de sistemas não tripulados aumentando 68%, para A $73 milhões. Codan disse que cerca de metade dessa receita não tripulada estava vinculada a aplicações de defesa operacional em zonas de conflito.
É aqui que a história se torna mais matizada. Em uma cesta de ações de defesa da ASX, a Codan pode oferecer um perfil diferente, com menos sensibilidade pura às manchetes, maior diversificação operacional e exposição significativa a comunicações militares e sistemas não tripulados, sem ser um nome de tema único. Essa diversificação também pode significar que as ações nem sempre são negociadas como um nome de defesa puro.
A HighCom está no final especulativo desta lista e deve ser rotulada dessa forma. A empresa afirma que seus dois negócios contínuos são a HighCom Armor, que fornece proteção balística, e a HighCom Technology, que fornece e mantém sistemas aéreos não tripulados de pequeno e médio porte, sistemas aéreos contra-não tripulados e suporte relacionado de engenharia, integração, manutenção e logística para o ADF e outras forças armadas regionais alinhadas.
No primeiro semestre do ano fiscal de 26, a receita de operações contínuas caiu 59% para A $10,9 milhões, enquanto o EBITDA passou para uma perda de A $5,4 milhões em relação ao lucro de A $1,9 milhão no ano anterior. A HighCom também divulgou A $5,1 milhões em receita de tecnologia HighCom, incluindo A $3,5 milhões de peças de reposição para pequenos sistemas aéreos não tripulados (SUAS) e A $1,6 milhão de serviços de sustentação fornecidos ao Departamento de Defesa da Austrália.
Então, sim, a HighCom é uma das ações de defesa ASX mais sensíveis financeiramente no conselho. Mas também é o tipo de nome menor que pode mostrar como as compras se transformam em equipamentos de suporte, sustentação e proteção especializados.
Principais observações do mercado
Acompanhe os marcos do programa, não apenas as manchetes políticas. A adjudicação de contratos, o início da fabricação, os cronogramas de entrega e o trabalho de manutenção geralmente importam mais do que um único dia de anúncio.
Separe a exposição pura da exposição diversificada. O DroneShield e o EOS estão mais próximos de temas concentrados de tecnologia de defesa, enquanto o Codan traz exposição às comunicações em um mix de negócios mais amplo.
Assista aos temas de capacidade soberana na Austrália. A Austal e a EOS estão vinculadas à fabricação local, à integração e às cadeias de suprimentos australianas, o que apóia o tema mais amplo de capacidade soberana desse grupo.
Preste atenção aos balanços e à conversão de caixa. O ímpeto de compras pode ser real mesmo quando o tempo fica confuso. A última metade da HighCom é um lembrete disso.
As manchetes de defesa podem parecer imediatas. Os ganhos geralmente não são. O principal trabalho naval da Austal se estende até a próxima década. Os contratos EOS são entregues ao longo de vários anos. O fluxo de pedidos da DroneShield parece forte, mas a empresa ainda separa a receita comprometida de uma oportunidade mais ampla de pipeline. HighCom mostra o outro lado da moeda. A exposição à aquisição não se traduz automaticamente em uma execução financeira tranquila.
As referências a ações de defesa listadas na ASX são apenas informações gerais, não uma recomendação para comprar, vender ou manter qualquer título ou CFD. Essas ações podem ser altamente voláteis e sensíveis ao prazo do contrato, à política governamental, à geopolítica, ao risco de execução e às condições do mercado. Expectativas de backlog, pipeline e receita não são garantias de desempenho futuro.
Três bancos centrais estão decidindo as taxas simultaneamente, o petróleo Brent está oscilando em torno de USD 100 o barril e uma guerra no Oriente Médio está reescrevendo as perspectivas de inflação em tempo real. O que quer que aconteça nesta semana pode definir o tom dos mercados para o resto de 2026.
Fatos rápidos
O Banco da Reserva da Austrália (RBA) anuncia sua próxima decisão sobre a taxa de caixa na terça-feira, com os mercados agora precificando 66% de chance de um segundo aumento para 4,1%.
Alguns analistas alertaram que a guerra do Irã pode empurrar a inflação dos EUA para 3,5% até o final do ano e atrasar os cortes nas taxas do Fed até setembro, tornando o gráfico de pontos do FOMC desta semana o mais observado em anos.
O petróleo Brent está flertando com USD 100 o barril depois que o Irã lançou o que a mídia estatal descreveu como sua “operação mais intensa desde o início da guerra”.
RBA: A Austrália voltará a caminhar?
O RBA elevou a taxa de caixa pela primeira vez em dois anos para 3,85% em sua reunião de fevereiro, depois que a inflação aumentou materialmente no segundo semestre de 2025.
A questão agora é se ele se move novamente antes mesmo de ver a próxima impressão trimestral do IPC, que só deve ser divulgada em 29 de abril.
O vice-governador Andrew Hauser reconheceu antes da reunião que os formuladores de políticas enfrentam uma decisão genuinamente dividida, moldada por sinais econômicos conflitantes em casa e pela crescente instabilidade no exterior.
Atualmente, os mercados financeiros atribuem cerca de 66% de probabilidade a outro aumento, com um aumento de maio considerado praticamente certo, independentemente do que aconteça na segunda-feira.
Datas importantes
Decisão sobre a taxa de caixa do RBA: Terça-feira, 17 de março, 14h30 AEDT
Conferência de imprensa do governador Bullock: Terça-feira, 17 de março, 15:30 AEDT
Monitor
Qualquer referência de Bullock a novas subidas será provável em maio
FOMC: É provável que todos os olhos estejam voltados para o gráfico de pontos
O FOMC se reúne de 17 a 18 de março, com a declaração de política agendada para 14h ET em 18 de março e a coletiva de imprensa do presidente Jerome Powell às 14h30. O CME FedWatch mostra uma probabilidade de 99% de que o Fed mantenha taxas de 3,50% a 3,75%.
A ação real está no Resumo das Projeções Econômicas (SEP) e no gráfico de pontos. O ponto médio atual mostra um corte de 25 pontos base para 2026. Se passar para dois cortes, isso é dovish e otimista para ativos de risco. Se mudar para zero cortes ou adicionar um aumento da taxa à projeção, os mercados poderão reagir na outra direção.
Para complicar ainda mais as coisas, o mandato de Powell como presidente do Federal Reserve expira em 23 de maio de 2026. Kevin Warsh é o principal candidato para substituí-lo, visto como mais agressivo em política monetária. Qualquer comentário de Powell sobre essa transição poderia movimentar os mercados independentemente da decisão de taxa em si.
Data chave
Decisão de taxa do FOMC + Gráfico de SEP/ponto: Quinta-feira, 19 de março, 4:00 AEDT
Conferência de imprensa de Powell: Quinta-feira, 19 de março, 4h30 AEDT
Monitor
A linguagem de Powell sobre petróleo e inflação tarifária.
Reação de rendimento do Tesouro em 2 anos.
A reprecificação do CME FedWatch para qualquer mudança na probabilidade de redução de setembro.
Banco do Japão: um maior aperto pode ser antecipado
O BOJ se reúne de 18 a 19 de março, com a decisão prevista para quinta-feira de manhã, horário de Tóquio. A taxa de política atual está em 0,75% (uma alta de 30 anos), e a reunião de janeiro de 2026 resultou na suspensão de uma votação de 8 a 1.
O governador Ueda classificou a reunião de março como “ao vivo”, observando que o cronograma para um maior aperto poderia ser “antecipado” se as negociações salariais de primavera da Shunto produzirem resultados mais fortes do que o esperado.
Esses resultados devem começar a chegar durante a semana, tornando-os a contribuição crítica para a decisão do BOJ. Nomura espera que os aumentos salariais da Shunto em 2026 cheguem em torno de 5,0%, incluindo a antiguidade, com um crescimento do salário base de aproximadamente 3,4%. Se os resultados confirmarem essa trajetória, o argumento de uma alta em março se fortalece consideravelmente.
A complicação é o cenário global. O Japão importa cerca de 90% de suas necessidades de energia, e o petróleo em torno de USD 100 por barril está elevando os custos de importação e ameaçando aumentar a pressão inflacionária. Um aumento do BOJ em um choque global do petróleo seria uma medida excepcionalmente ousada.
A maioria dos participantes do mercado ainda deseja aguardar esta reunião, com abril ou julho vistos como o momento mais provável para o próximo movimento.
Data chave
Decisão sobre a taxa de política do BOJ (atualmente 0,75%): Quinta-feira, 19 de março, manhã AEDT
Monitor
Os resultados salariais de Shunto são o principal gatilho para um aumento em março.
Linguagem da conferência de imprensa de Ueda e orientação futura em abril e julho.
O petróleo Brent atingiu brevemente USD 119,50 por barril no início da semana, antes de cair 17% para menos de USD 80, depois se recuperando para USD 95 em sinais mistos de Washington sobre o Estreito de Ormuz.
Na quinta-feira, o Brent estava de volta com mais de USD 100 quando o Irã lançou novos ataques contra o transporte comercial e a liberação da reserva da AIE não trouxe alívio significativo.
No cenário em que um conflito mais longo inflige danos à infraestrutura de energia, analistas estimam que o IPC pode subir para 3,5% até o final de 2026, com os preços da gasolina se aproximando de USD 5 por galão no segundo trimestre.
Para esta semana, o petróleo atua como uma macro metavariável. Cada manchete geopolítica, sinal de cessar-fogo, ataque de petroleiro, liberação de reserva e comentário de Trump poderiam movimentar ações, títulos e moedas em tempo real.
Monitor
Qualquer retomada do fluxo de petroleiros do Estreito de Ormuz.
Os ataques dos EUA e Israel contra o Irã lançados em 28 de fevereiro fizeram com que o petróleo Brent passasse de USD 119 o barril, o ouro acima de USD 5.200 e ações de defesa para recordes históricos.
Nesse contexto, os investidores estão se concentrando em um pequeno grupo de nomes vinculados a commodities que podem permanecer sensíveis a novos movimentos em petróleo, GNL e ouro. A questão chave é se o choque se mostra sustentado ou se um cessar-fogo, a normalização do transporte marítimo ou uma ação política removem parte do prêmio de risco geopolítico.
1. ExxonMobil (NYSE: XOM)
A ExxonMobil tem sido uma das mais claras beneficiárias do aumento de preços. As ações atingiram um recorde de USD 159,60 no início de março e subiram aproximadamente 28% no acumulado do ano.
A empresa produz 4,7 milhões de barris de óleo equivalente por dia, tem um ponto de equilíbrio na Bacia do Permiano de cerca de USD 35/barril e está comprometida com USD 20 bilhões em recompras até 2026.
O Wells Fargo elevou sua meta de preço para USD 183 de USD 156 após a escalada, enquanto o consenso mais amplo dos analistas está em torno de USD 140 a $144. No entanto, a XOM já está negociando acima de muitas metas consensuais, e a interrupção de sua parceira de GNL, a QatarEnergy, representa um obstáculo operacional de curto prazo.
O que assistir
Se as interrupções do Ormuz persistem além de 4 a 6 semanas.
A liberação emergencial do estoque do G7 ou um cessar-fogo confiável podem reduzir o prêmio de risco de guerra.
Quaisquer ajustes nas metas de consenso dos analistas.
A Chevron atingiu uma nova alta de 52 semanas de USD 196,76 no início de março e aumentou aproximadamente 24% no acumulado do ano.
O ponto de equilíbrio do Brent da empresa para dividendos e despesas de capital é de cerca de USD 50/barril. Isso significa que, com os preços atuais do petróleo acima de USD 90, ele está gerando um fluxo de caixa livre significativo.
No entanto, a Chevron interrompeu temporariamente as operações em um campo de gás na costa de Israel após a atividade de mísseis na região, e desde então as ações recuaram mais de 1%, já que o conflito afeta diretamente suas operações.
O que assistir
Atualizações operacionais diretas dos ativos da Chevron no Oriente Médio e em Israel.
Quaisquer novas paradas que possam pesar na produção de curto prazo.
Participação de petróleo bruto acima de USD 90, o que mantém a Chevron gerando fluxo de caixa livre significativo.
3. Woodside Energy (ASX: WDS/NYSE: WDS)
Com o Catar interrompendo a produção após ataques de drones iranianos, compradores na Ásia e na Europa estão lutando por suprimentos alternativos. A Woodside, como uma das maiores produtoras e exportadoras de GNL da Austrália, está fora da zona de conflito e está bem posicionada para se beneficiar da demanda redirecionada.
Os analistas alertam que a substituição real leva tempo devido às restrições de envio e contrato, o que significa que o aumento do preço pode ser mais durável do que uma simples negociação à vista. Os preços do gás de referência europeu TTF subiram mais de 50% em uma semana, ampliando o ambiente de margem para produtores de GNL fora do Oriente Médio.
O que assistir
O ritmo e o cronograma de qualquer reinício da produção de GNL do Catar.
Se a QatarEnergy permanecer off-line por semanas, a Woodside poderá começar a recontratar compradores europeus a preços spot elevados.
Uma alta do dólar australiano pode ser um obstáculo que vale a pena acompanhar os ganhos denominados em USD.
4. Cheniere Energy (NYSE: GNL)
Juntamente com a Woodside, Cheniere é a beneficiária mais direta dos EUA da interrupção do GNL no Catar. Como maior exportador de GNL dos Estados Unidos, viu força intradiária no início da semana do conflito.
A produção doméstica de energia dos EUA protegeu os consumidores americanos do pior choque, mas o prêmio de exportação aumentou à medida que compradores europeus e asiáticos pagam pelo fornecimento fora do Golfo.
O comércio é “geopoliticamente sensível” e qualquer resolução pode reverter a vantagem rapidamente. Mas enquanto a infraestrutura de gás de Hormuz e do Golfo permanecer comprometida, Cheniere está posicionada para se beneficiar estruturalmente.
O que assistir
Qualquer avanço diplomático que reabra as rotas marítimas do Golfo.
Anúncios de novos contratos de aquisição de longo prazo assinados a preços elevados atuais.
O ouro subiu 5,2% em uma única sessão em 1º de março, atingindo USD 5.246/onça, à medida que os mercados buscavam ativos seguros. A Newmont, a maior produtora de ouro do mundo, viu suas reservas efetivamente reavaliadas a esses preços.
Ele está em alta junto com o ganho de 24% do ouro no acumulado do ano, e seus custos totais de sustentação permanecem praticamente fixos.
No entanto, as mineradoras de ouro se venderam drasticamente em 4 de março, e a Newmont caiu quase 8% em uma única sessão, à medida que uma desalavancagem mais ampla do risco atingiu as ações de metais preciosos.
As ações se recuperaram desde então, mas a volatilidade continua alta. Para investidores de longa duração, analistas observam que jurisdições de mineração “seguras”, como Canadá, Austrália e Nevada, estão cobrando novos prêmios à medida que a instabilidade no Oriente Médio aumenta o valor do fornecimento geopoliticamente seguro.
O que assistir
Se o ouro pode se manter acima de USD 5.000/onça.
Um conflito prolongado pode acelerar um ciclo de fusões e aquisições em mineradores de ouro juniores.
Um cessar-fogo ou um amplo evento de desalavancagem de ações como o principal risco a ser monitorado.
A Lockheed Martin atingiu um novo recorde histórico de USD 676,70 em 3 de março, um aumento de mais de 4% no dia. Seus caças F-35, munições guiadas com precisão, sistemas THAAD e artilharia de foguetes HIMARS são fundamentais para a campanha aérea em andamento.
O Departamento de Defesa dos EUA está se movendo para reabastecer os estoques de munições, e a ambição declarada de Trump de aumentar o orçamento de defesa dos EUA para USD 1,5 trilhão até 2027 acrescenta um vento favorável estrutural de longo prazo além do conflito imediato.
As ações de defesa estão subindo em meio aos preços clássicos de risco geopolítico, mas os investidores devem observar que o fluxo real de contratos leva tempo para se traduzir em lucros, e as avaliações já refletem um otimismo considerável.
O que assistir
O ritmo das ordens de reabastecimento de munições do Departamento de Defesa dos EUA.
A rapidez com que as vitórias de contratos se traduzem em crescimento da carteira de pedidos.
Barrick está acompanhando a corrida histórica do ouro ao lado da Newmont, com as ações subindo acentuadamente no acumulado do ano. Ela tem uma capitalização de mercado de aproximadamente USD 78 bilhões e está relatando projeções recordes de fluxo de caixa livre, já que seus custos totais de sustentação permanecem bem abaixo dos preços à vista atuais.
Como a Newmont, ela experimentou uma forte liquidação em uma única sessão de mais de 8% durante o evento mais amplo de desalavancagem de 4 de março, antes de se recuperar parcialmente.
Empresas de royalties e streaming, como a Wheaton Precious Metals (WPM), estão sendo preferidas por alguns investidores como uma forma mais protegida contra a inflação de acessar o ouro, dada sua menor exposição aos custos operacionais. Mas a Barrick continua sendo uma das maiores mineradoras de ouro listadas do mundo, com ganhos altamente sensíveis às mudanças no preço do ouro
O que assistir
A capacidade do ouro de se manter acima de USD 5.000/onça.
Qualquer Barrick avança em direção a aquisições de mineradores juniores.
Inflação dos custos de energia, já que o aumento dos preços dos combustíveis pode começar a reduzir as margens operacionais das mineradoras.