Markets Settle as Crypto Crashes | GO Markets Week Ahead
GO Markets
17/11/2025
•
0 min read
Share this post
Copy URL
Last week brought some relief as markets found support following the retreat from record highs... with the recent crypto crash being a notable exception.
Bitcoin Breaks Below $100K
Crypto markets are under significant pressure after Bitcoin crashed through the psychological $100,000 level. Currently trading around $94,650, Bitcoin has fallen to its lowest point since May. The $94,000 level appears critical; if it fails, we could see Bitcoin slip back into the $80,000 range and potentially enter bear market territory.
Fed Minutes and Rate Cut Signals
The Federal Reserve minutes are due this week, and they could provide crucial insight into the timing of rate cuts in 2026. Markets have already priced in a likely December cut, but the January 2026 cut that was initially expected may be in jeopardy. Pay attention to the Fed speakers scheduled throughout the week—their comments could help clarify the path forward on monetary policy.
Strong Earnings Season Winds Down
We're in the final stretch of what's been an exceptionally strong earnings season, with 82% of companies beating EPS expectations and 76% surpassing revenue forecasts. This week features some heavyweight reports, most notably Nvidia reporting Wednesday after the bell. Major retailers Target and Walmart will cap things off, giving us a clear picture of consumer health heading into the holidays.
Market Insights
Watch Mike Smith's analysis for the week ahead in markets
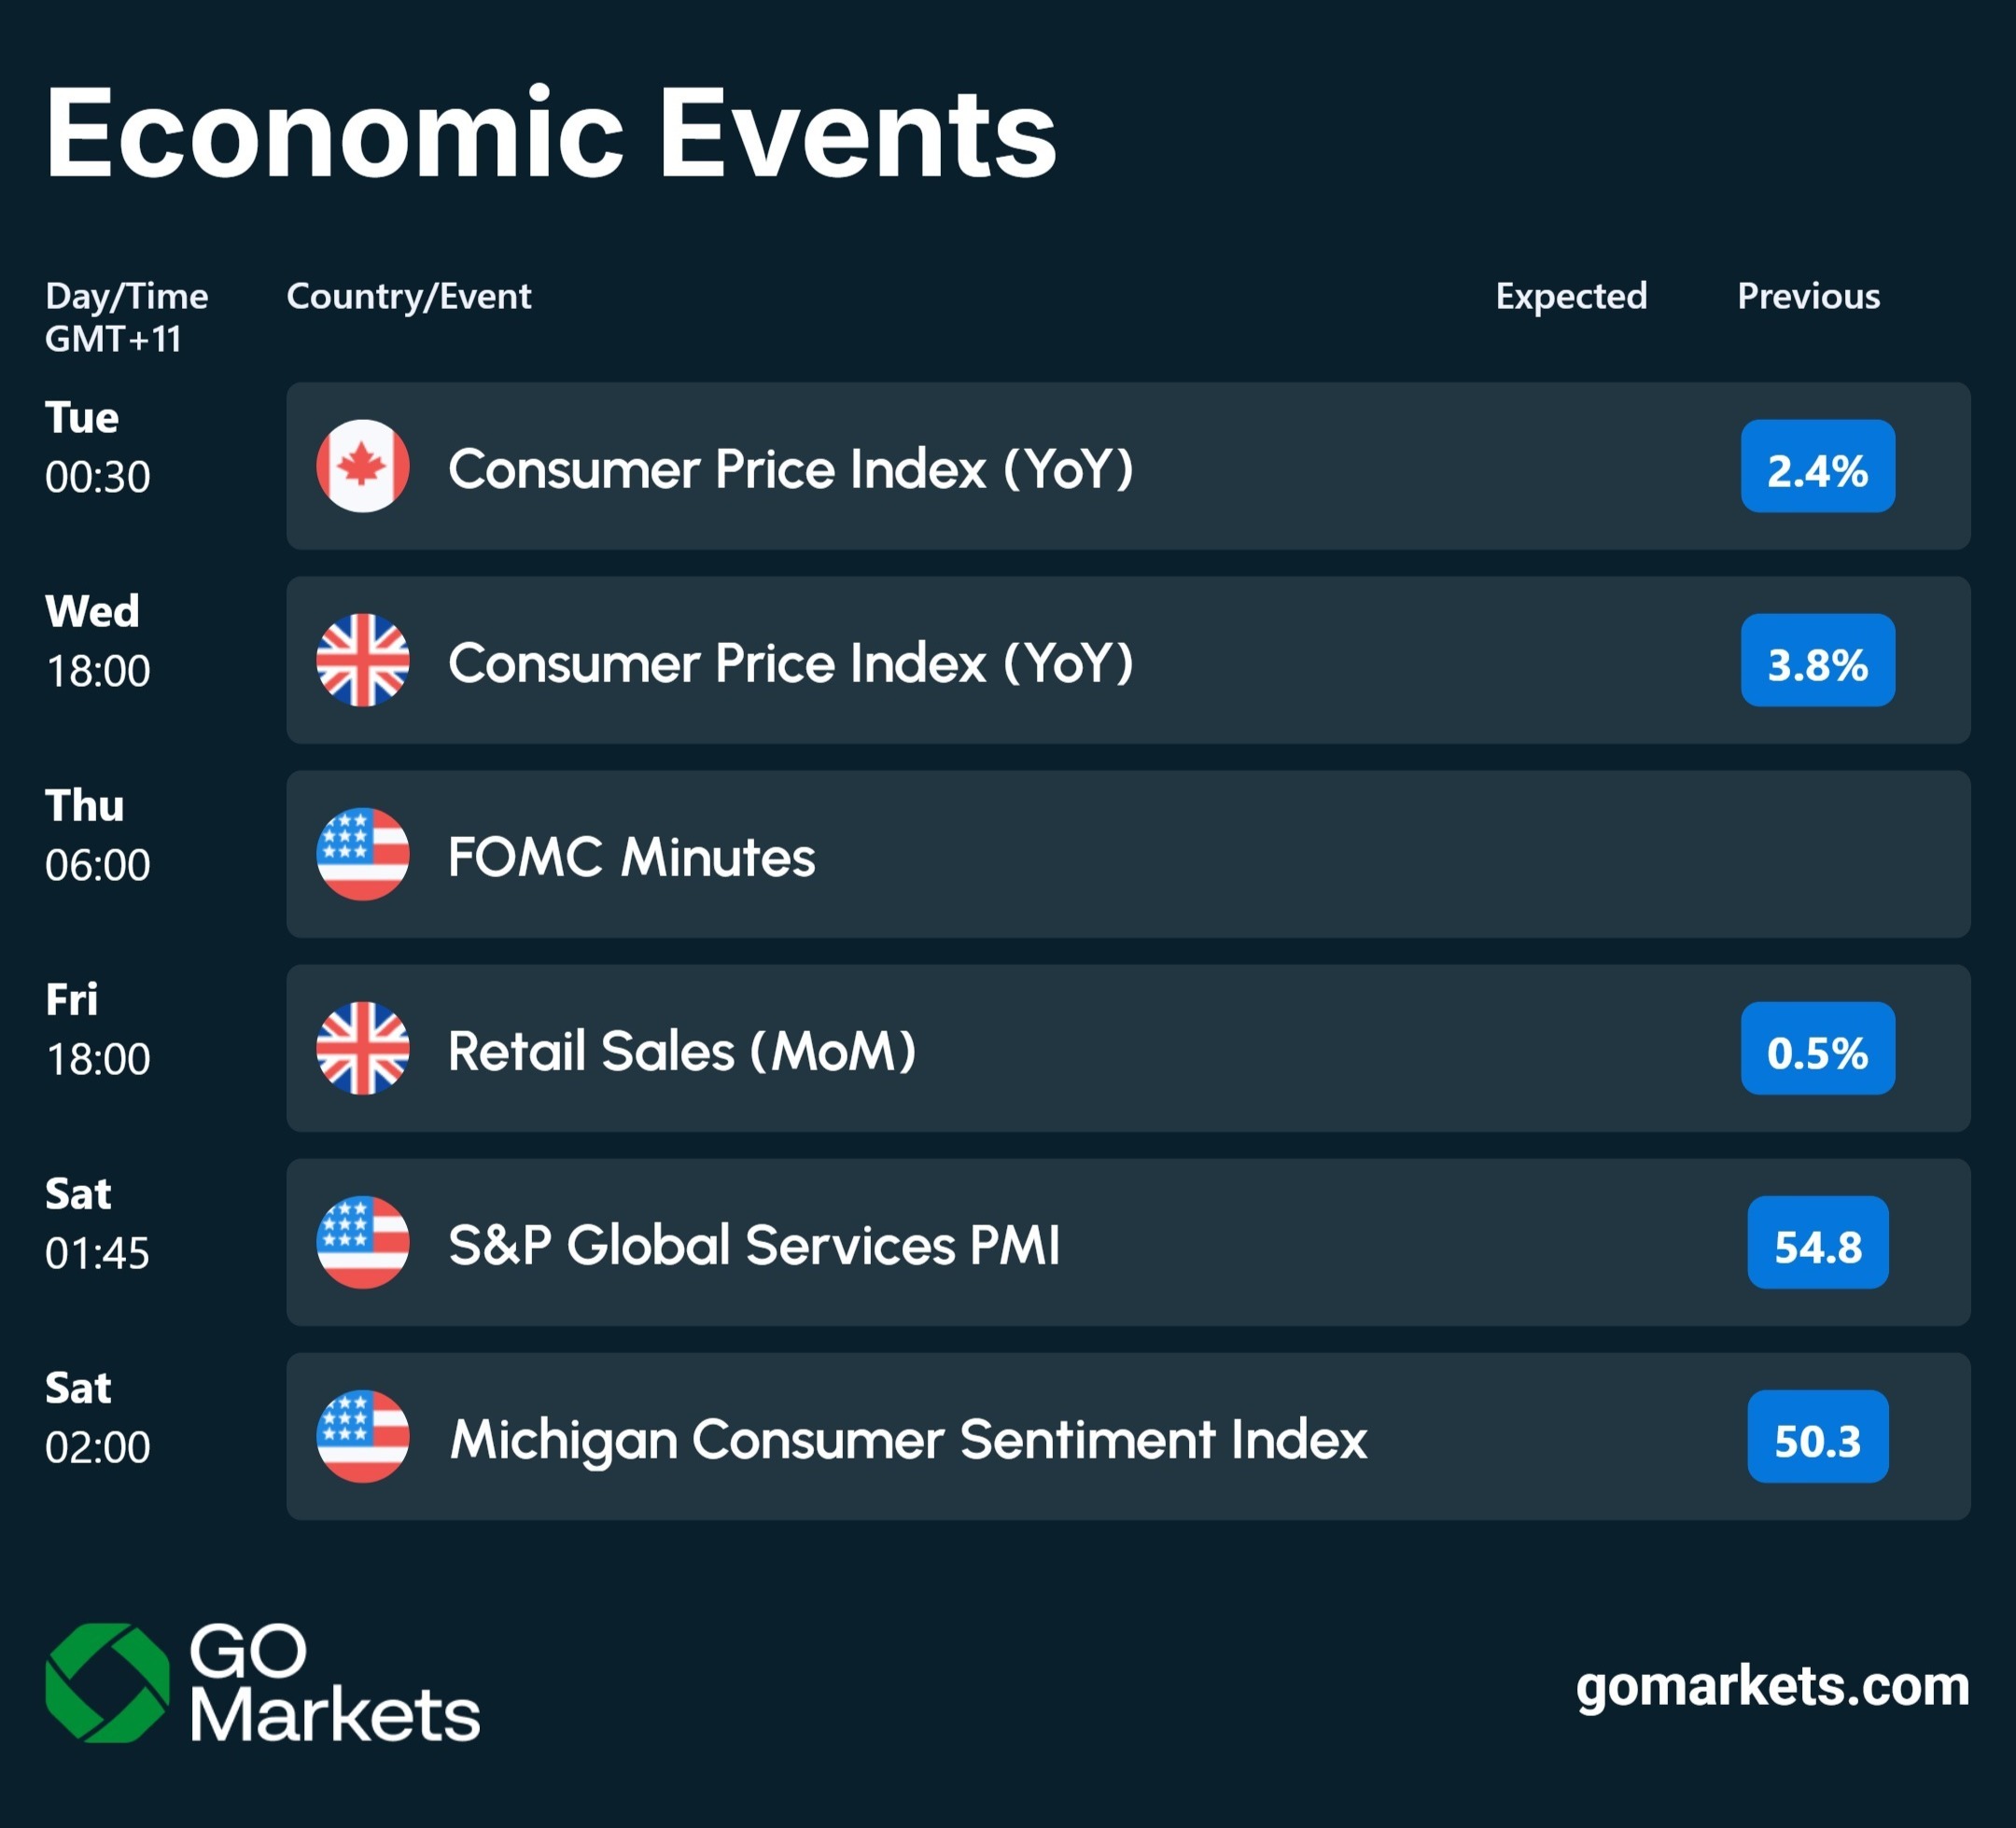
Key Economic Events
Stay up to date with the upcoming economic events for the week.
US markets are eyeing all-time highs following strong data and earnings reports. Whether these records are achieved will depend on the news flow over the coming days, particularly from the Federal Reserve.
Fed Decision Incoming
The Federal Reserve's two-day meeting will end this Wednesday with a 0.25% rate cut widely expected. But following Friday's encouraging PCE numbers, the bigger question is “Will there be a January cut?” The Fed press conference post-decision will likely the highest signal event for the rest of 2025.
Central Bank Decisions Everywhere
Beyond the Fed, the Reserve Bank of Australia meets tomorrow with a pause expected, as recent data hasn't provided sufficient incentive for another cut. The ECB, Bank of England, and Bank of Japan will also all announce decisions within the next ten days, creating potential volatility across both equity and FX markets.
Big Tech Earnings
Two major AI infrastructure players report earnings this week: Broadcom and Oracle. These reports come at a time when AI valuations are under heavy public scrutiny, however, they will likely take a backseat to whatever the Fed signals about its 2026 path.
Copper Breaks Out
Copper has rallied to a four-month high and is now testing the $5.50 level. After breaching the key $5.25 support level, the market is showing some hesitation in Asia ahead of major data releases and the Fed decision. The July record highs of $5.50 are now within reach, though it is still to be seen if this level holds or if we pull back toward $5.25 support.
Market Insights
Watch Mike Smith's analysis of the week ahead in markets.
Key Economic Events
Stay up to date with the key economic events for the week.
Bitcoin rebounded 7% to touch $94,000 this week as two of the world's largest asset managers doubled down on their conviction that this cycle could break from crypto's boom-bust past.
BlackRock CEO Larry Fink and COO Rob Goldstein declared tokenisation "the next major evolution in market infrastructure,” comparing its potential to the introduction of electronic messaging systems in the 1970s.
Tokenised real-world assets have exploded from $7 billion to $24 billion in just one year, with certain projections expecting tokenised instruments to comprise 10-24% of portfolios by 2030.
Total RWA Value
Grayscale's latest research also put forward the case that this cycle will not follow Bitcoin’s predictable four-year pattern. Their analysis shows this cycle has had no parabolic price surge like previous cycles, and capital is flowing through regulated ETPs and corporate treasuries rather than retail speculation.
Grayscale has boldly predicted Bitcoin will reach new all-time highs next year based on this data, with near-term catalysts including a likely Federal Reserve rate cut and advancing crypto legislation.
AI Boom Creating a Memory Chip Supply Crisis
The AI revolution has had an unexpected ripple effect on conventional memory chips (DRAM).
Post-ChatGPT launch in 2022, chipmakers pivoted aggressively toward high-bandwidth memory (HBM) chips — the components that power AI data centres.
Samsung and SK Hynix, who control roughly 70% of the global DRAM market, transitioned large portions of their production away from conventional chips.
This worked in the short term, but data centre operators are now replacing old servers, and PC and smartphone sales have exceeded expectations (all of which require DRAM).
This saw DRAM supplier inventories fall to just two to four weeks in October, down from 13 to 17 weeks in late 2024.
DRAM spot prices nearly tripled in September this year, while in Tokyo's electronics district, popular gaming memory modules have surged from 17,000 yen to over 47,000 yen in recent weeks.
Google, Amazon, Microsoft, and Meta have all approached Micron with open-ended orders, agreeing to purchase whatever the company can deliver, regardless of price.
Samsung, Micron, and SK Hynix shares have rallied 96%, 168%, and 213% YTD, respectively, thanks to the increased DRAM demand.
Ironically, this recent price surge has seen DRAM chip margins approach those of the advanced HBM chips, meaning non-AI memory could now become equally profitable to produce.
Markets have bounced back strongly this week. The S&P 500 is now just 1.5% from record highs, and the Nasdaq is recovering well following its pullback.
Rate Cut Expectations
The main driver behind this rally was a shift in Federal Reserve rate cut expectations. Markets are currently pricing in a quarter-point rate cut for December, with only a 25% chance of another reduction in January. This week's economic data will be crucial in shaping expectations going into 2026.
Key Economic Data This Week
Several important data releases are scheduled for this week. The PCE inflation data — the Fed's preferred inflation measure — for September will finally be released on Friday and could have the biggest impact on December and January rate decisions. The ADP jobs report and weekly jobless claims will also be released, while the non-farm payrolls report has been delayed again.
Global Manufacturing Snapshot
Today also kicks off a busy week of manufacturing data releases. Global PMI numbers are due across the board, including figures from the Eurozone, UK, Germany, and the US this evening. These reports will provide a critical snapshot of global economic health and could help reveal the impact of the US trade tariffs.
Gold Breaks Higher
Gold made a significant move on Friday, breaching the key $4,200 level after consolidating last week. The precious metal has followed through today, and the $4,400 level now looks achievable if buying pressure continues.
Bitcoin Under Pressure
Bitcoin has given up last week's modest gains and seen substantial selling pressure. A significant drop of about $4,000 occurred during Asian trading this morning — a notable decline for an Asia session. The key level to watch is $84,000, with potential support at $80,000 (the lowest level since March).
Market Insights
Watch Mike Smith's analysis of the week ahead in markets.
Key Economic Events
Stay up to date with the key economic events for the week.
US markets are eyeing all-time highs following strong data and earnings reports. Whether these records are achieved will depend on the news flow over the coming days, particularly from the Federal Reserve.
Fed Decision Incoming
The Federal Reserve's two-day meeting will end this Wednesday with a 0.25% rate cut widely expected. But following Friday's encouraging PCE numbers, the bigger question is “Will there be a January cut?” The Fed press conference post-decision will likely the highest signal event for the rest of 2025.
Central Bank Decisions Everywhere
Beyond the Fed, the Reserve Bank of Australia meets tomorrow with a pause expected, as recent data hasn't provided sufficient incentive for another cut. The ECB, Bank of England, and Bank of Japan will also all announce decisions within the next ten days, creating potential volatility across both equity and FX markets.
Big Tech Earnings
Two major AI infrastructure players report earnings this week: Broadcom and Oracle. These reports come at a time when AI valuations are under heavy public scrutiny, however, they will likely take a backseat to whatever the Fed signals about its 2026 path.
Copper Breaks Out
Copper has rallied to a four-month high and is now testing the $5.50 level. After breaching the key $5.25 support level, the market is showing some hesitation in Asia ahead of major data releases and the Fed decision. The July record highs of $5.50 are now within reach, though it is still to be seen if this level holds or if we pull back toward $5.25 support.
Market Insights
Watch Mike Smith's analysis of the week ahead in markets.
Key Economic Events
Stay up to date with the key economic events for the week.
Bitcoin rebounded 7% to touch $94,000 this week as two of the world's largest asset managers doubled down on their conviction that this cycle could break from crypto's boom-bust past.
BlackRock CEO Larry Fink and COO Rob Goldstein declared tokenisation "the next major evolution in market infrastructure,” comparing its potential to the introduction of electronic messaging systems in the 1970s.
Tokenised real-world assets have exploded from $7 billion to $24 billion in just one year, with certain projections expecting tokenised instruments to comprise 10-24% of portfolios by 2030.
Total RWA Value
Grayscale's latest research also put forward the case that this cycle will not follow Bitcoin’s predictable four-year pattern. Their analysis shows this cycle has had no parabolic price surge like previous cycles, and capital is flowing through regulated ETPs and corporate treasuries rather than retail speculation.
Grayscale has boldly predicted Bitcoin will reach new all-time highs next year based on this data, with near-term catalysts including a likely Federal Reserve rate cut and advancing crypto legislation.
AI Boom Creating a Memory Chip Supply Crisis
The AI revolution has had an unexpected ripple effect on conventional memory chips (DRAM).
Post-ChatGPT launch in 2022, chipmakers pivoted aggressively toward high-bandwidth memory (HBM) chips — the components that power AI data centres.
Samsung and SK Hynix, who control roughly 70% of the global DRAM market, transitioned large portions of their production away from conventional chips.
This worked in the short term, but data centre operators are now replacing old servers, and PC and smartphone sales have exceeded expectations (all of which require DRAM).
This saw DRAM supplier inventories fall to just two to four weeks in October, down from 13 to 17 weeks in late 2024.
DRAM spot prices nearly tripled in September this year, while in Tokyo's electronics district, popular gaming memory modules have surged from 17,000 yen to over 47,000 yen in recent weeks.
Google, Amazon, Microsoft, and Meta have all approached Micron with open-ended orders, agreeing to purchase whatever the company can deliver, regardless of price.
Samsung, Micron, and SK Hynix shares have rallied 96%, 168%, and 213% YTD, respectively, thanks to the increased DRAM demand.
Ironically, this recent price surge has seen DRAM chip margins approach those of the advanced HBM chips, meaning non-AI memory could now become equally profitable to produce.
Every trader has had that moment where a seemingly perfect trade goes astray.
You see a clean chart on the screen, showing a textbook candle pattern; it seems as though the market planets have aligned, and so you enthusiastically jump into your trade.
But before you even have time to indulge in a little self-praise at a job well done, the market does the opposite of what you expected, and your stop loss is triggered.
This common scenario, which we have all unfortunately experienced, raises the question: What separates these “almost” trades from the truly higher-probability setups?
The State of Alignment
A high-probability setup isn’t necessarily a single signal or chart pattern. It is the coming together of several factors in a way that can potentially increase the likelihood of a successful trade.
When combined, six interconnected layers can come together to form the full “anatomy” of a higher-probability trading setup:
Context
Structure
Confluence
Timing
Management
Psychology
When more of these factors are in place, the greater the (potential) probability your trade will behave as expected.
Market Context
When we explore market context, we are looking at the underlying background conditions that may help some trading ideas thrive, and contribute to others failing.
Regime Awareness
Every trading strategy you choose to create has a natural set of market circumstances that could be an optimum trading environment for that particular trading approach.
For example:
Trending regimes may favour momentum or breakout setups.
Ranging regimes may suit mean-reversion or bounce systems.
High-volatility regimes create opportunity but demand wider stops and quicker management.
Investing time considering the underlying market regime may help avoid the temptation to force a trending system into a sideways market.
Simply looking at the slope of a 50-period moving average or the width of a Bollinger Band can suggest what type of market is currently in play.
Sentiment Alignment
If risk sentiment shifts towards a specific (or a group) of related assets, the technical picture is more likely to change to match that.
For example, if the USD index is broadly strengthening as an underlying move, then looking for long trades in EURUSD setups may end up fighting headwinds.
Setting yourself some simple rules can help, as trading against a potential tidal wave of opposite price change in a related asset is not usually a strong foundation on which to base a trading decision.
Key Reference Zones
Context also means the location of the current price relative to levels or previous landmarks.
Some examples include:
Weekly highs/lows
Prior session ranges, e.g. the Asian high and low as we move into the European session
Major “round” psychological numbers (e.g., 1.10, 1000)
A long trading setup into these areas of market importance may result in an overhead resistance, or a short trade into a potential area of support may reduce the probability of a continuation of that price move before the trade even starts.
Market Structure
Structure is the visual rhythm of price that you may see on the chart. It involves the sequences of trader impulses and corrections that end up defining the overall direction and the likelihood of continuation:
Uptrend: Higher highs (HH) and higher lows (HL)
Downtrend: Lower highs (LH) and lower lows (LL)
Transition: Break in structure often followed by a retest of previous levels.
A pullback in an uptrend followed by renewed buying pressure over a previous price swing high point may well constitute a higher-probability buy than a random candle pattern in the middle of nowhere.
Compression and Expansion
Markets move through cycles of energy build-up and release. It is a reflection of the repositioning of asset holdings, subtle institutional accumulation, or a response to new information, and may all result in different, albeit temporary, broad price scenarios.
Compression: Evidenced by a tightening range, declining ATR, smaller candles, and so suggesting a period of indecision or exhaustion of a previous price move,
Expansion: Evidenced by a sudden breakout, larger candle bodies, and a volume spike, is suggestive of a move that is now underway.
A breakout that clears a liquidity zone often runs further, as ‘trapped’ traders may further fuel the move as they scramble to reposition.
A setup aligned with such liquidity flows may carry a higher probability than one trading directly into it.
Confluence
Confluence is the art of layering independent evidence to create a whole story. Think of it as a type of “market forensics” — each piece of confirmation evidence may offer a “better hand’ or further positive alignment for your idea.
There are three noteworthy types of confluence:
Technical Confluence – Multiple technical tools agree with your trading idea:
Moving average alignment (e.g., 20 EMA above 50 EMA) for a long trade
A Fibonacci retracement level is lining up with a previously identified support level.
Momentum is increasing on indicators such as the MACD.
Multi-Timeframe Confluence – Where a lower timeframe setup is consistent with a higher timeframe trend. If you have alignment of breakout evidence across multiple timeframes, any move will often be strengthened by different traders trading on different timeframes, all jumping into new trades together.
3. Volume Confluence – Any directional move, if supported by increasing volume, suggests higher levels of market participation. Whereas falling volume may be indicative of a lesser market enthusiasm for a particular price move.
Confluence is not about clutter on your chart. Adding indicators, e.g., three oscillators showing the same thing, may make your chart look like a work of art, but it offers little to your trading decision-making and may dilute action clarity.
Think of it this way: Confluence comes from having different dimensions of evidence and seeing them align. Price, time, momentum, and participation (which is evidenced by volume) can all contribute.
Timing & Execution
An alignment in context and structure can still fail to produce a desired outcome if your timing is not as it should be. Execution is where higher probability traders may separate themselves from hopeful ones.
Entry Timing
Confirmation: Wait for the candle to close beyond the structure or level. Avoid the temptation to try to jump in early on a premature breakout wick before the candle is mature.
Retests: If the price has retested and respected a breakout level, it may filter out some false breaks that we will often see.
Then act: Be patient for the setup to complete. Talking yourself out of a trade for the sake of just one more candle” confirmation may, over time, erode potential as you are repeatedly late into trades.
Session & Liquidity Windows
Markets breathe differently throughout the day as one session rolls into another. Each session's characteristics may suit different strategies.
For example:
London Open: Often has a volatility surge; Range breaks may work well.
New York Overlap: Often, we will see some continuation or reversal of morning trends.
Asian Session: A quieter session where mean-reversion or range trading approaches may do well
Trade Management
Managing the position well after entry can turn probability into realised profit, or if mismanaged, can result in losses compounding or giving back unrealised profit to the market.
Pre-defined Invalidation
Asking yourself before entry: “What would the market have to do to prove me wrong?” could be an approach worth trying.
This facilitates stops to be placed logically rather than emotionally. If a trade idea moves against your original thinking, based on a change to a state of unalignment, then considering exit would seem logical.
Scaling & Partial Exits
High-probability trade entries will still benefit from dynamic exit approaches that may involve partial position closes and adaptive trailing of your initial stop.
Trader Psychology
One of the most important and overlooked components of a higher-probability setup is you.
It is you who makes the choices to adopt these practices, and you who must battle the common trading “demons” of fear, impatience, and distorted expectation.
Let's be real, higher-probability trades are less common than many may lead you to believe.
Many traders destroy their potential to develop any trading edge by taking frequent low-probability setups out of a desire to be “in the market.”
It can take strength to be inactive for periods of time and exercise that patience for every box to be ticked in your plan before acting.
Measure “You” performance
Each trade you take becomes data and can provide invaluable feedback. You can only make a judgment of a planned strategy if you have followed it to the letter.
Discipline in execution can be your greatest ally or enemy in determining whether you ultimately achieve positive trading outcomes.
Bringing It All Together – The Setup Blueprint
Final Thoughts
Higher-probability setups are not found but are constructed methodically.
A trader who understands the “higher-probability anatomy” is less likely to chase trades or feel the need to always be in the market. They will see merit in ticking all the right boxes and then taking decisive action when it is time to do so.
It is now up to you to review what you have in place now, identify gaps that may exist, and commit to taking action!