
很少有机构能像澳大利亚储备银行(RBA)那样安静或有力地塑造澳大利亚的日常生活。
每当你续订抵押贷款、开立储蓄账户或观察澳元走势时,澳洲联储的决定都在后台。
但是,银行内部到底发生了什么,是什么推动了席卷整个澳大利亚经济的呼声?
事实速览
- 澳洲联储的现金利率是澳大利亚金融界最受关注的数字。
- 费率决定 由九名成员组成的董事会每年八次制定。
- 澳洲联储的目标是随着时间的推移平均通货膨胀率为2-3%。
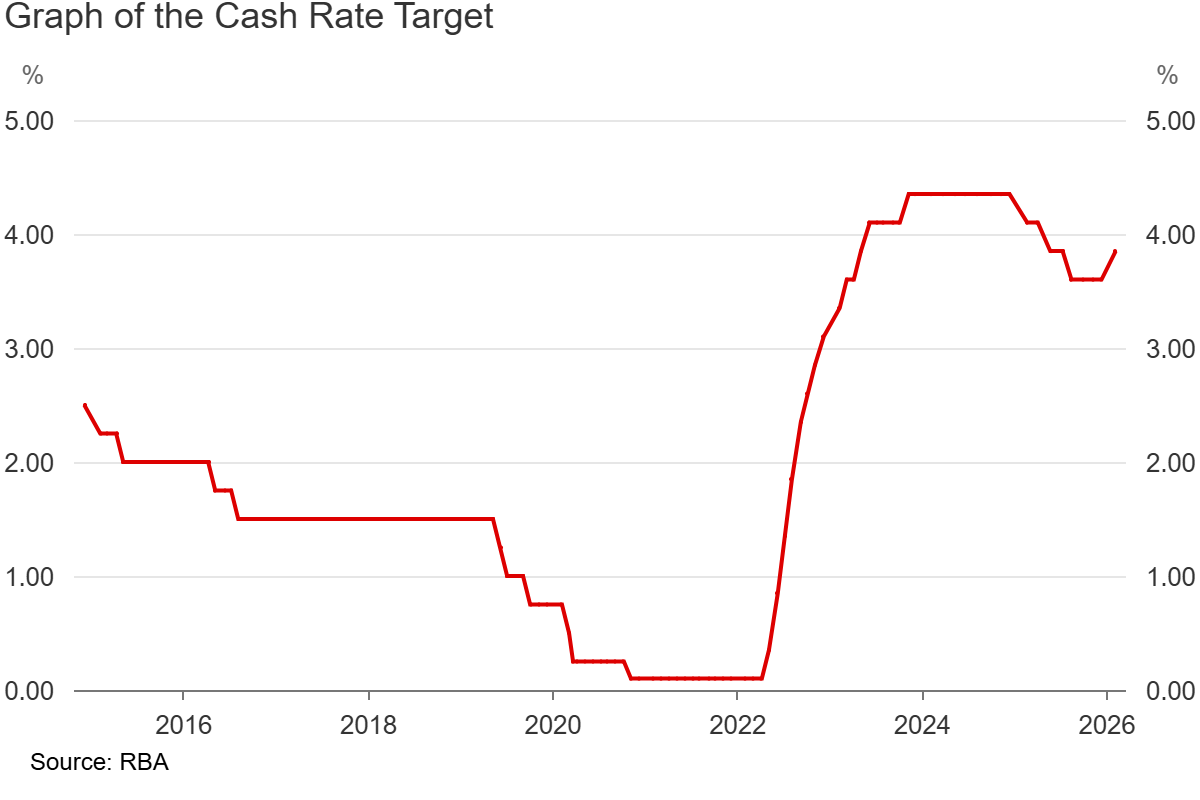
- 2023年11月,澳大利亚的现金利率达到了 4.35% 的12年高点。
什么是澳洲联储?
澳大利亚央行是澳大利亚的中央银行。与向个人和企业贷款的商业银行不同,澳大利亚央行向金融机构贷款,发行国家货币并充当政府的银行家。
它还在监督更广泛的金融体系的稳定方面发挥着作用。它可以在经济压力时期介入,确保信贷持续流动。
对于普通澳大利亚人来说,澳洲联储对利率的影响最为明显。通过设定现金利率目标,它可以塑造整个经济的借贷和储蓄成本。
这种影响可以渗透到抵押贷款利率、商业贷款和澳元的价格。
现金利率如何运作?
现金利率是澳大利亚央行对银行间隔夜贷款收取的利率。银行不断相互借钱以管理其日常现金需求,而澳洲联储则为这些借贷成本设定了下限。
当澳洲联储提高现金利率时,银行往往会将成本转嫁给借款人;当它降低现金利率时,还款利息往往会下降。
这种连锁反应是现金利率如此强大的工具的原因。银行根据现金利率为产品定价,因此澳大利亚央行0.25%的变动通常会在几周内流向浮动抵押贷款利率。
澳洲联储现金利率变动的影响
澳大利亚抵押贷款中有很大一部分是浮动利率的,因此,与固定利率贷款更为突出的国家相比,现金利率的任何变化往往更快地转移到家庭预算。
澳洲联储如何做出决定?
澳大利亚央行董事会每年举行八次会议,制定货币政策,会议日期提前公布。
该委员会有九名成员:总督、副总督、财政部长和六名外部成员,由财务部长任命,任期五年。决定尽可能以协商一致方式作出,必要时由总督进行决定性投票。
这些成员作出决定的目的是维持物价稳定和支持充分就业,将澳大利亚人民的经济繁荣和福利作为首要目标。
价格稳定通常意味着随着时间的推移,平均通货膨胀率保持在2-3%的目标区间内。“一段时间内的平均值” 框架是经过深思熟虑的;如果通货膨胀率短暂偏离区间外,澳洲联储不会感到恐慌,但任一方向的持续偏差都可能促使董事会考虑政策应对措施。
充分就业是从非加速通货膨胀失业率(NAIRU)的角度来看待充分就业,这是经济在不产生通货膨胀工资压力的情况下可以维持的最低失业率。估计各不相同,但澳大利亚央行历来将其定为4-4.5%左右。
这两个目标之间的紧张关系决定了澳大利亚央行的大多数决策。强劲的劳动力市场对工人来说是个好消息,但它可以推高工资(进而推高通货膨胀)。另一方面,降温通货膨胀通常需要接受失业率的上升。
在每次会议之前,澳洲联储的工作人员准备了涵盖所有主要经济指标的大量简报材料。在做出决定之前,董事会对证据进行了为期两天的辩论。结果将在会议当天澳大利亚东部夏令时间下午 2:30 公开宣布,随后由州长发表详细声明和新闻发布会。
每项决策的关键输入
澳洲联储最近的利率周期
当前的利率周期是澳洲联储现代历史上最激进的周期之一。在COVID疫情期间将现金利率维持在0.10%的历史最低水平之后,澳大利亚央行于2022年5月开始加息,并十三次加息,然后在2023年11月暂停在4.35%。
在2022年5月至2023年底期间,拥有75万美元浮动利率抵押贷款的借款人的每月还款额增加了约1,500美元,至1800美元,这是家庭预算的严重紧缩,直接加剧了澳大利亚央行试图策划的消费者放缓。
在整个2025年,澳洲联储定期将利率下调,在最近于2026年2月加息之后,利率目前为3.75%。
交易者应该注意什么?
每月消费物价指数
对于澳洲联储观察者来说,月度消费者价格指数通常被认为是最重要的单一数据点。如果数据显示 “季度调整后的平均消费者价格指数” 超过3%,则可能会提高人们对加息或推迟削减的预期(尤其是在意外向上行的情况下)。“调整后的均值” 是澳洲联储的首选衡量标准,因为它倾向于减少波动造成的数据噪音。
劳动力数据
劳动力数据包括失业率和就业不足率以及工资增长的数字。澳大利亚央行密切关注这些数字,看是否有任何迹象表明工资的增长速度可能与通货膨胀目标不一致。
州长的讲话和出席
在正式会议之间,州长在众议院经济委员会作证并发表公开演讲。这些都受到严格审查,以了解董事会的情绪信号。例如,简单的语言转变,从 “耐心” 到 “警惕”,通常可以被视为语气的变化,可能会影响即将举行的会议的费率决定。
中性利率
“中性利率” 是澳洲联储认为既不会加速经济增长也不会减缓的现金利率区间。目前的中性现金利率估计约为3.0-3.5%,低于3.75%的实际利率,这表明澳洲联储仍在阻碍经济。随着利率越来越接近中性区域,这可能表明澳洲联储继续削减的紧迫性降低。但是,意外数据总是可以颠覆这一假设。
全球中央银行
澳洲联储不是孤立运作的。如果美联储在更长的时间内维持更高的利率,则在不削弱澳元和通过提高进口价格来导入通货膨胀的情况下,限制了澳洲联储的降息空间。
底线
澳洲联储的工作是保持澳大利亚经济的平衡,而现金利率是其实现这一目标的主要工具。它的决定几乎触及澳大利亚金融生活的每个角落,从抵押贷款的支付到澳元的交易方式。
对于交易者来说,了解澳洲联储的想法和正在关注的事情对于理解更广泛的澳大利亚经济环境大有帮助。

Reportingdates and release times are based on company investor relations calendars whereconfirmed. Where dates or times are not marked confirmed, they are GO Marketsestimates. Consensus EPS, revenue and analyst-range data are sourced fromBloomberg and Earnings Whispers, as at 09 July 2026 (AEST). Company guidance,backlog and operating metrics are sourced from the latest company filings orresults presentations, unless stated otherwise. Any scenario analysis reflectsGO Markets analysis. Figures and schedules may change without notice.
The information provided is of general nature only and does not take into account your personal objectives, financial situations or needs. Before acting on any information provided, you should consider whether the information is suitable for you and your personal circumstances and if necessary, seek appropriate professional advice. All opinions, conclusions, forecasts or recommendations are reasonably held at the time of compilation but are subject to change without notice. Past performance is not an indication of future performance. Go Markets Pty Ltd, ABN 85 081 864 039, AFSL 254963 is a CFD issuer, and trading carries significant risks and is not suitable for everyone. You do not own or have any interest in the rights to the underlying assets. You should consider the appropriateness by reviewing our TMD, FSG, PDS and other CFD legal documents to ensure you understand the risks before you invest in CFDs.