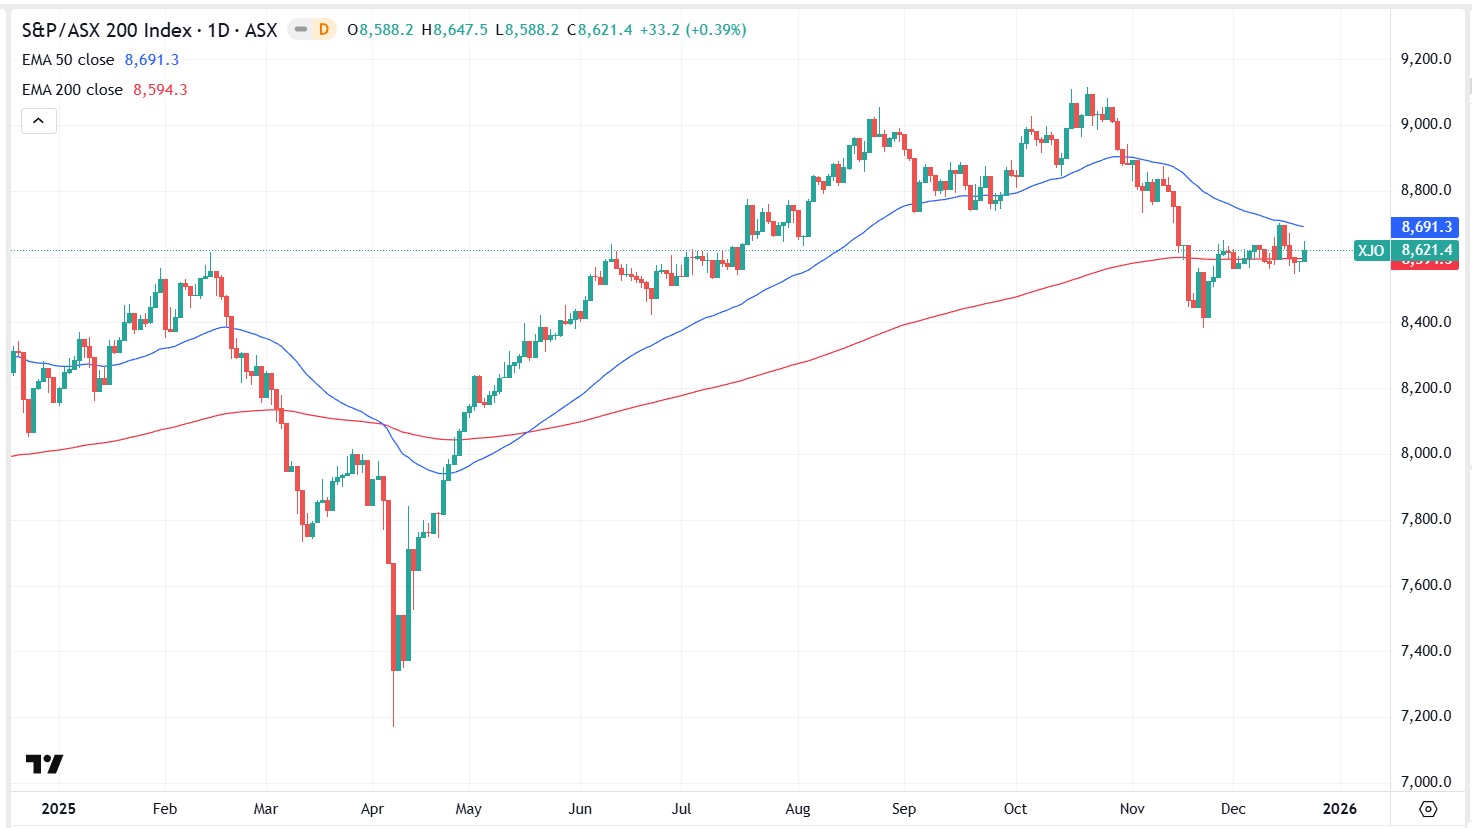
In 2025, the ASX 200 closed around 8,621 points and was up approximately 6% year to date (YTD) as of 19 December close. Market direction was most sensitive to Reserve Bank of Australia (RBA) expectations, commodity prices and China-linked demand, and (to a lesser extent) moves in the Australian dollar (AUD). The index recovered from November’s pullback, but remained below October’s record close.
Key 2025 drivers included:
- RBA policy expectations: Sentiment was shaped by shifting views on the timing and extent of rate moves. The November pullback reflected repricing towards a longer pause and higher uncertainty around whether the next move could be a hike rather than a cut, particularly as jobs and inflation data surprised.
- Resources and China sensitivity: With a meaningful resources weight, the index responded to iron ore stability, strong gold prices and relative firmness in base metals. China data and any perceived policy support (including signals from the People’s Bank of China (PBOC)) remained important for the export backdrop. A relatively stable AUD also reduced currency-related noise for exporters.
- Index composition and market structure: The ASX 200’s heavier tilt to materials and banks, and lower exposure to high-growth technology, meant it often lagged tech-led global rallies, but tended to hold up better when AI and growth valuations were questioned.
- Corporate earnings: Reporting season outcomes influenced valuation support. In September’s half-year reporting season, around 33% of ASX 200 companies beat expectations, which helped underpin pricing around current levels.
Current state
The ASX 200 was roughly 5% below its late-October record high close of 9,094 points. After the November retracement, support around 8,400 appeared to hold and buying interest improved. The 50-day EMA near 8,730 (a prior consolidation area) was a commonly watched near-term reference, noting technical indicators can be unreliable.
What to watch in January
- China and commodity demand: Growth, trade and any fresh stimulus inference from the PBOC may affect sentiment.
- Domestic inflation and labour data: CPI and jobs prints are key inputs into RBA expectations.
- Key levels and follow-through: The post-November rebound may need continued demand to sustain momentum.
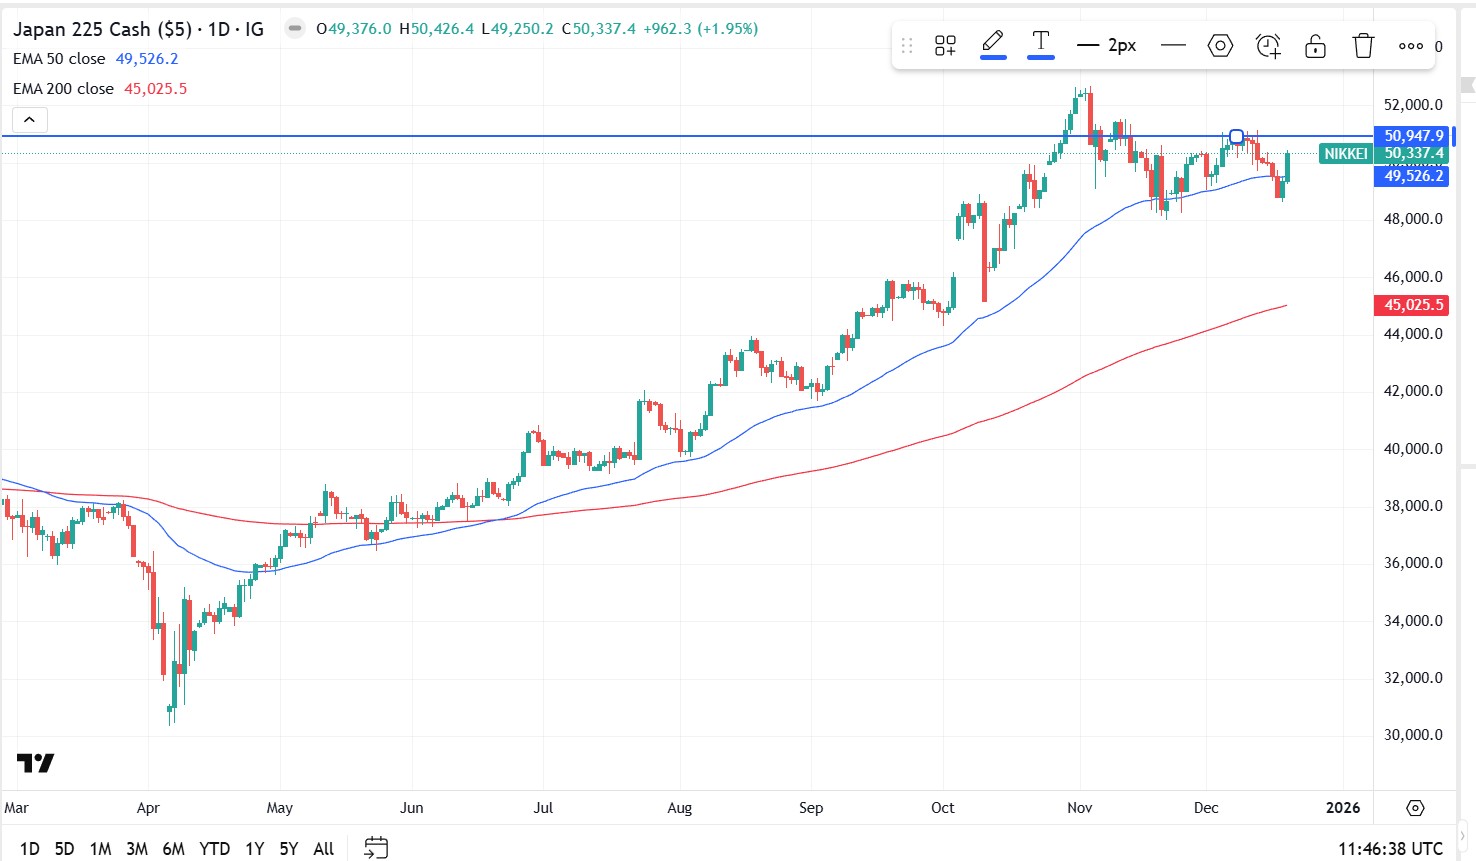
What moved the Nikkei 225 in 2025?
In 2025, the Nikkei 225 traded around 39,200 points and was up approximately 21% year to date (YTD). Market direction was most sensitive to moves in the Japanese yen (JPY) and Bank of Japan (BOJ) communication, with the index consolidating after multi-decade highs. While broader signals remained constructive, consolidation can resolve either higher or lower.
Key influences included:
- JPY movements and earnings translation: A weaker JPY can boost the reported value of overseas earnings for some exporters, although it may also increase input and import costs. The net impact often depends on company hedging practices and varies by sector, with effects most evident in export-heavy industries such as automotive, industrials and parts of technology manufacturing.
- Gradual BOJ policy transition: The BOJ continued to step away from ultra-easy settings, but tightening was generally cautious. Markets largely priced a slow, conditional normalisation, which helped limit downside, even as policy headlines created bouts of volatility.
- Corporate governance reforms: Ongoing improvements in capital efficiency and shareholder returns supported interest from overseas investors. Share buybacks, stronger balance-sheet discipline and improved return on equity (ROE) contributed to re-rating in parts of the market.
- Global cyclical exposure: The Nikkei moved with shifts in global manufacturing sentiment and expectations for US growth, particularly during risk-on phases associated with AI-related capital spending.
Current state
After pushing to multi-decade highs earlier in the year, the Nikkei spent time consolidating but has remained structurally strong. Price sits above key long-term moving averages, and some technicians watch the 50-day exponential moving average (EMA) as a potential reference level (noting these indicators can be unreliable). Currency swings and shifting BOJ expectations were commonly cited as contributors to much of the second-half volatility, although pullbacks were generally met with buying interest.
What to watch in January for Japan
- JPY volatility: Sharper yen moves, especially if driven by BOJ or Federal Reserve expectations, could quickly change exporter earnings assumptions.
- BOJ communication: Small changes in language on inflation persistence or bond market operations may move sentiment.
- Global growth data: US and China manufacturing and trade prints remain key inputs for an externally focused economy.

The information provided is of general nature only and does not take into account your personal objectives, financial situations or needs. Before acting on any information provided, you should consider whether the information is suitable for you and your personal circumstances and if necessary, seek appropriate professional advice. All opinions, conclusions, forecasts or recommendations are reasonably held at the time of compilation but are subject to change without notice. Past performance is not an indication of future performance. Go Markets Pty Ltd, ABN 85 081 864 039, AFSL 254963 is a CFD issuer, and trading carries significant risks and is not suitable for everyone. You do not own or have any interest in the rights to the underlying assets. You should consider the appropriateness by reviewing our TMD, FSG, PDS and other CFD legal documents to ensure you understand the risks before you invest in CFDs.