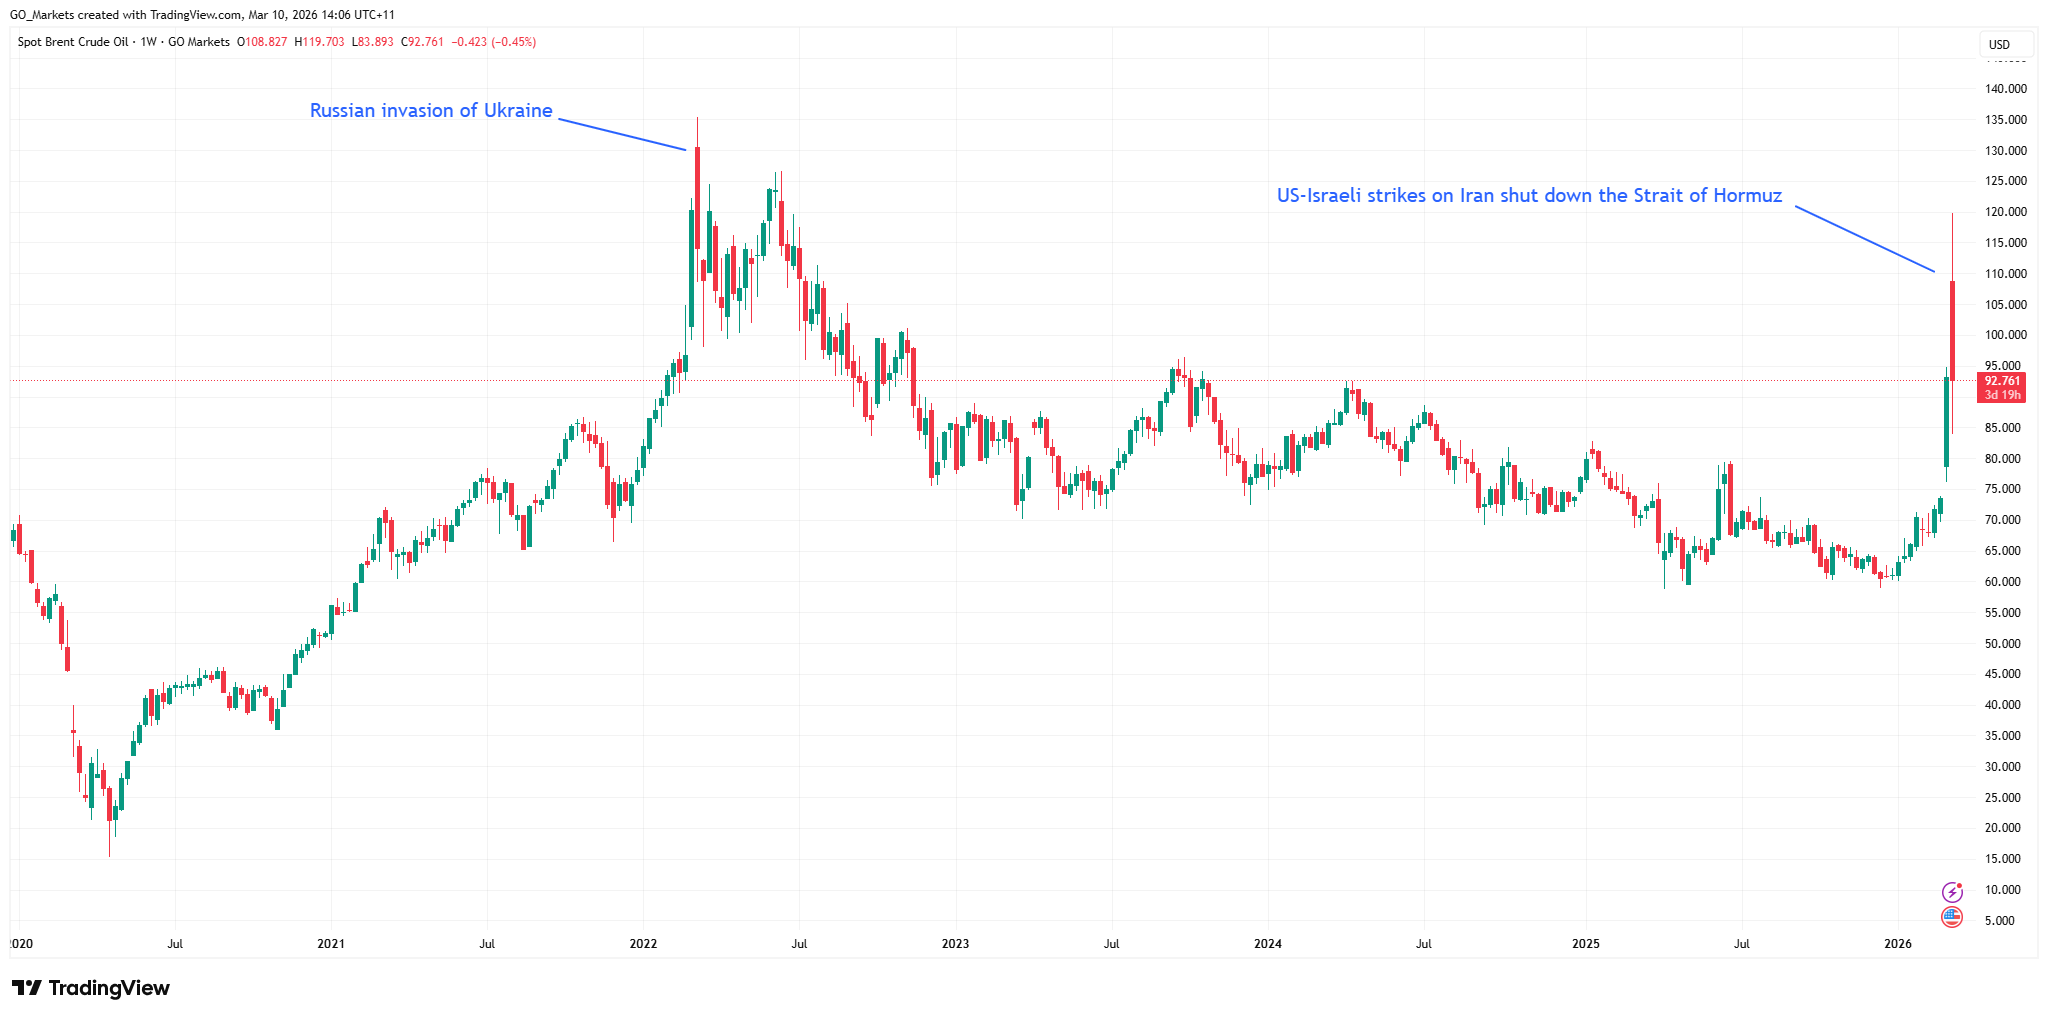
We would suggest that right now Markets are underestimating the impact of April 2 US Reciprocal Tariffs – aka Liberation Day monikered by the President.There is consistent and constant chatter around what is being referred to as The Dirty 15. This is the 15 countries the president suggests has been taking advantage of the United States of America for too long. The original thinking was The Dirty 15 for those countries with the highest levels of tariffs or some form of taxation system against US goods. However, there is also growing evidence that actually The Dirty 15 are the 15 nations that have the largest trade relations with the US.That is an entirely different thought process because those 15 countries include players like Japan, South Korea, Germany, France, the UK, Canada, Mexico and of course, Australia. Therefore, the underestimation of the impact from reciprocal tariffs could be far-reaching and much more destabilising than currently pricing.From a trading perspective, the most interesting moves in the interim appear to be commodities. Because the scale and execution of US’s reciprocal tariffs will be a critical driver of commodity prices over the coming quarter and into 2025.Based on repeated signals from President Trump and his administration, reinforced by recent remarks from US Commerce Secretary Howard Lutnick. Lutnick has indicated that headline tariffs of 15-30% could be announced on April 2, with “baseline” reciprocal tariffs likely to fall in the 15-20% range—effectively broad-based tariffs.The risk here is huge: economic downturn, possibilities of hyperinflation, the escalation of further trade tensions, goods and services bottlenecks and the loss of globalisation.This immediately brings gold to the fore because, clearly risk environment of this scale would likely mean that instead of flowing to the US dollar which would normally be the case the trade of last resort is to the inert metal.The other factor that we need to look at here is the actual end goal of the president? The answer is clearly lower oil prices—potentially through domestic oil subsidies or tax cuts—to offset inflationary pressures from tariffs and to force lower interest rates.‘Balancing the Budget’Secretary Lutnick has specified that the tariffs are expected to generate $700 billion in revenue, which therefore implies an incremental 15-20% increase in weighted-average tariffs. We can’t write off the possibility that the initial announcement may set tariffs at even higher levels to allow room for negotiation, take the recently announced 25% tariffs on the auto industry. From an Australian perspective, White House aide Peter Navarro has confirmed that each trading partner will be assigned a single tariff rate. Navarro is a noted China hawk and links Australia’s trade with China as a major reason Australia should be heavily penalised.Trump has consistently advocated for tariffs since the 1980s, and his administration has signalled that reciprocal tariffs are the baseline, citing foreign VAT and GST regimes as justification. This suggests that at least a significant portion of these tariffs may be non-negotiable. Again, this highlights why markets may have underestimated just how big an impact ‘liberation day’ could have.Now, the administration acknowledges that tariffs may cause “a little disturbance” (irony much?) and that a “period of transition” may be needed. The broader strategy appears to involve deficit reduction, followed by redistributing tariff revenue through tax cuts for households earning under $150K, as reported by the likes of Reuters on March 13.The White House has also emphasised a focus on Main Street over Wall Street, which we have highlighted previously – Trump has made next to no mention of markets in his second term. Compared to his first, where it was basically a benchmark for him.All this suggests that some downside risk in financial markets may be tolerated to advance broader economic objectives.Caveat! - a policy reversal remains possible in 2H’25, particularly if tariffs are implemented at scale and prove highly disruptive and the US consumer seizes up. Which is likely considering the players most impacted by tariffs are end users.The possible trades:With all things remaining equal, there is a bullish outlook for gold over the next three months, alongside a bearish outlook on oil over the next three to six months.Gold continues to punch to new highs, and its upward trajectory has yet to be truly tested. Having now surpassed $3,000/oz, as a reaction to the economic impact of tariffs. Further upside is expected to drive prices to $3,200/oz over the next three months on the fallout from the April 2 tariffs to come.What is also critical here is that gold investment demand remains well above the critical 70% of mine supply threshold for the ninth consecutive quarter. Historically, when investment demand exceeds this level, prices tend to rise as jewellery consumption declines and scrap supply increases.On the flip side, Brent crude prices are forecasted to decline to $60-65 per barrel 2H’25 (-15-20%). The broader price range for 2025 is expected to shift down to $60-75 per barrel, compared to the $70-90 per barrel range seen over the past three years.Now there is a caveat here: the weak oil fundamentals for 2025 are now widely known, and the physical surplus has yet to materialise – this is the risk to the bearish outlook and never write off OPEC looking to cut supply to counter the price falls.
The Dirty 15 and the ‘liberation’ of what?

Related Articles

Venezuela commands the world's largest proven oil reserves at 303 billion barrels. Yet political turmoil, global sanctions, and recent US intervention show that being the biggest isn’t always best.
Quick facts:
- Venezuela holds 18% of the world's total proven oil reserves despite producing less than 1% of global consumption.
- Just four countries (Venezuela, Saudi Arabia, Iran, and Canada) control over half the planet's proven reserves.
- Saudi Arabia dominates crude oil production contributing to over 16% of global exports.
- US shale technology has enabled America to lead in production despite ranking ninth in reserves.
Top 10 countries by proven oil reserves
1. Venezuela – 303 billion barrels
- Controls 18% of global reserves, primarily extra-heavy crude in the Orinoco Belt requiring specialised refining.
- Heavy crude trades $15-20 below Brent benchmarks due to high sulphur content and complex processing requirements.
- Output crashed 60% from 2.5 million bpd in 2014 to less than 1.0 million bpd last year.
- Approximately 80% of exports flow to China as loan repayment, with export revenues dwarfed by reserve potential.
2. Saudi Arabia – 267 billion barrels
- Majority light, sweet crude oil requires minimal refining and commands premium prices, contributing to world-leading exports of $191.1 billion in 2024.
- Maintains 2-3 million bpd of spare production capacity, providing market stabilisation capability during supply disruptions.
- Oil comprises roughly 50% of the country’s GDP and 70% of its export earnings.
- Production decisions significantly impact international oil prices due to market dominance.

3. Iran – 209 billion barrels
- Heavy Western sanctions severely limit the country’s ability to monetise and access international markets.
- Production estimates vary significantly (2.5-3.8 million bpd) due to sanctions, limited transparency, and restricted international reporting.
- Significant crude volumes flow to China through discount arrangements and sanctions-evading mechanisms.
- Sanctions relief could rapidly boost production toward 4-5 million bpd, though domestic consumption (12th globally) reduces export potential.
4. Canada – 163 billion barrels
- Approximately 97% of reserves are oil sands (bitumen) requiring steam-assisted extraction and significant upfront capital investment.
- Political stability and regulatory frameworks position Canada as a secure source compared to volatile producers, with direct pipeline access to US refineries.
- Supplied over 60% of U.S. crude oil imports in 2024, making Canada America's top source by far.

5. Iraq – 145 billion barrels
- Decades of war and sanctions have prevented optimal field development and infrastructure modernisation.
- Improved security conditions since 2017 have enabled production recovery, but pipeline attacks and aging facilities continue to constrain output.
- Oil revenue comprises over 90% of government income, creating extreme fiscal vulnerability.
- Exports flow primarily to China, India, and Asian buyers seeking a reliable Middle Eastern supply, with most production from super-giant southern fields near Basra.
6. United Arab Emirates – 113 billion barrels
- Produces primarily medium-to-light sweet crude commanding premium prices, ranking fourth globally in export value at $87.6 billion.
- Has successfully diversified its economy through tourism, finance, and trade, reducing oil's GDP share compared to Gulf peers.
- Strategic location near the Strait of Hormuz and openness to international oil companies help facilitate efficient global distribution.
7. Kuwait – 101.5 billion barrels
- Reserves are concentrated in aging super-giant fields like Burgan, which require enhanced recovery techniques.
- Favourable geology enables extraction costs around $8-10 per barrel, with proven reserves providing 80+ years of supply at current production rates.
- Oil comprises 60% of GDP and over 95% of export revenue.
8. Russia – 80 billion barrels
- World's third-largest producer despite ranking eighth in reserves.
- Post-2022 Western sanctions redirected crude flows from Europe to Asia, with China and India now absorbing the majority at discounted prices.
- Despite export restrictions and G7 price cap at $60/barrel, it posted the second-highest global export value at $169.7 billion in 2024.
- Russian Urals crude typically trades $15-30 below Brent due to quality, sanctions, and logistics, with November 2024 revenues declining to $11 billion.
9. United States – 74.4 billion barrels
- The shale revolution through horizontal drilling and hydraulic fracturing has made the U.S. the world's #1 oil producer despite holding only the 9th-largest reserves.
- The Permian Basin accounts for nearly 50% of production, with shale/tight oil representing 65% of total output.
- Achieved net petroleum exporter status in 2020 for the first time since 1949, with crude exports growing from near-zero in 2015 to over 4 million bpd in 2024.
- The U.S. government maintains a 375+ million barrel strategic reserve.

10. Libya – 48.4 billion barrels
- Holds Africa's largest proven oil reserves at 48.4 billion barrels, producing light sweet crude commanding premium prices.
- Rival bordering governments compete for oil revenue control, causing production to fluctuate based on political conditions.
- Oil facilities face blockades, militia attacks, and political leverage tactics, preventing consistent returns.
- Favourable geology enables extraction costs around $10-15 per barrel, with geographic proximity making Libya a natural supplier to European refineries.
What does this mean for oil markets?
The concentration of reserves among OPEC members (60% of the global total) ensures the organisation has continued influence over pricing, even as US shale provides a production counterweight.
Venezuela's potential return as a major exporter post-U.S. occupation could eventually ease supply constraints, though most analysts view significant production increases as years away.
Sanctions could create a situation where discounted crude seeks buyers willing to navigate compliance risks. Refiners with heavy crude processing capability may benefit from price differentials if Venezuelan barrels increase.
While reserves appear abundant, economically recoverable volumes depend on sustained high prices. If renewable adoption accelerates and demand peaks sooner than projected, stranded assets become a material risk for reserve-heavy producers.

Asia starts the week with a fresh geopolitical shock that is already being framed in oil terms, not just security terms. The first-order move may be a repricing of risk premia and volatility across energy and macro, while markets wait to see whether this becomes a durable physical disruption or a fast-fading headline premium.
At a glance
- What happened: US officials said the US carried out “Operation Absolute Resolve”, including strikes around Caracas, and that Venezuela’s President Nicolás Maduro and his wife were taken into US custody and flown to the United States (subject to ongoing verification against the cited reporting).
- What markets may focus on now: Headline-driven risk premia and volatility, especially in products and heavy-crude-sensitive spreads, rather than a clean “missing barrels” shock.
- What is not happening yet: Early pricing has so far looked more like a headline risk premium than a confirmed physical supply shock, though this can change quickly, with analysts pointing to ample global supply as a possible cap on sustained upside.
- Next 24 to 72 hours: Market participants are likely to focus on the shape of the oil “quarantine”, the UN track, and whether this stays “one and done” or becomes open-ended.
- Australia and Asia hook: AUD as a risk barometer, Asia refinery margins in diesel and heavy, and shipping and insurance where the price can show up in friction before it shows up in benchmarks.
What happened, facts fast
Before anyone had time to workshop the talking points, there were strikes, there was a raid, and there was a custody transfer. US officials say the operation culminated in Maduro and his wife being flown to the United States, where court proceedings are expected.
Then came the line that turned a foreign policy story into a markets story. President Trump publicly suggested the US would “run” Venezuela for now, explicitly tying the mission to oil.
Almost immediately after that came a message-discipline correction. Secretary of State Marco Rubio said the US would not govern Venezuela day to day, but would press for changes through an oil “quarantine” or blockade.
That tension, between maximalist presidential rhetoric and a more bureaucratically describable “quarantine”, is where the uncertainty lives. Uncertainty is what gets priced first.

Why this is price relevant now
What’s new versus known for positioning
What’s new, and price relevant, is that the scale and outcome are not incremental. A major military operation, a claimed removal of Venezuela’s leadership from the country, and a US-led custody transfer are not the sort of things markets can safely treat as noise.
Second, the oil framing is explicit. Even if you assume the language gets sanded down later, the stated lever is petroleum. Flows, enforcement, and pressure via exports.
Third, the embargo is not just a talking point anymore. Reporting says PDVSA has begun asking some joint ventures to cut output because exports have been halted and storage is tightening, with heavy-crude and diluent constraints featuring prominently.
What’s still unknown, and where volatility comes from
Key unknowns include how strict enforcement is on water, what exemptions look like in practice, how stable the on-the-ground situation is, and which countries recognise what comes next. Those are not philosophical questions. Those are the inputs for whether this is a temporary risk premium or a durable regime shift.
Political and legal reaction, why this drives tail risk
The fastest way to understand the tail here is to watch who calls this illegal, and who calls it effective, then ask what those camps can actually do.
Internationally, reaction has been fast, with emphasis on international law and the UN Charter from key partners, and UN processes in view. In the US, lawmakers and commentators have begun debating the legal basis, including questions of authority and war powers. That matters for markets because it helps define whether this is a finite operation with an aftershock, or the opening chapter of a rolling policy regime that keeps generating headlines.
Market mechanism, the core “so what”
Here’s the key thing about oil shocks. Sometimes the headline is the shock. Sometimes the plumbing is the shock.

Volumes and cushion
Venezuela is not the world’s swing producer. Its production is meaningful at the margin, but not enough by itself to imply “the world runs out of oil tomorrow”. The risk is not just volume. It is duration, disruption, and friction.
The market’s mental brake is spare capacity and the broader supply backdrop. Reporting over the weekend pointed to ample global supply as a likely cap on sustained gains, even as prices respond to risk.
Quality and transmission
Venezuela’s barrels are disproportionately extra heavy, and extra heavy crude is not just “oil”. It is oil that often needs diluent or condensate to move and process. That is exactly the kind of constraint that shows up as grade-specific tightness and product effects.
Reporting has highlighted diluent constraints and storage pressure as exports stall. Translation: even if Brent stays relatively civil, watch cracks, diesel and distillates, and any signals that “heavy substitution” is getting expensive.

Products transmission, volatility first, pump later
If crude is the headline, products are the receipt, because products tell you what refiners can actually do with the crude they can actually get. The short-run pattern is usually: futures reprice risk fast, implied volatility pops; physical flows adapt more slowly; retail follows with a lag, and often with less drama than the first weekend of commentary promised.
For Australia and Asia desks, the bigger point is transmission. Energy moves can influence inflation expectations, which can feed into rates pricing and the dollar, and in turn affect Asia FX and broader risk, though the links are not mechanical and can vary by regime.
Some market participants also monitor refined-product benchmarks, including gasoline contracts such as reformulated gasoline blendstock, as part of that chain rather than as a stand-alone signal.
Historical context, the two patterns that matter
Two patterns matter more than any single episode.
Pattern A: scare premium. Big headline, limited lasting outage. A spike, then a fade as the market decides the plumbing still works.
Pattern B: structural. Real barrels are lost or restrictions lock in; the forward curve reprices; the premium migrates from front-month drama to whole-curve reality.

One commonly observed pattern is that when it is only premium, volatility tends to spike more than price. When it is structural, levels and time spreads move more durably.
The three possible market reactions
Contained, rhetorical: quarantine exists but porous; diplomacy churns; no second-wave actions. Premium bleeds out; volatility mean-reverts.
Embargo tightens, exports curtailed, quality shock: enforcement hardens; PDVSA cuts deepen; diluent constraints bite. Heavies bid; cracks and distillates react; freight and insurance add friction.
Escalation, prolonged control risk: “not governing” language loses credibility; repeated operations; allies fracture further. Longer-duration premium; broader risk-off impulse across FX and rates.
Australia and Asia angle
For Sydney, Singapore, and Hong Kong screens, this is less about Venezuelan retail politics and more about how a Western Hemisphere intervention bleeds into Asia pricing.
AUD is the quick and dirty risk proxy. Asia refiners care about the kind of oil and the friction cost. Heavy crude plus diluent dependency makes substitution non-trivial. If enforcement looks aggressive, the “price” can show up in freight, insurance, and spreads before it shows up in headline Brent.
Catalyst calendar, key developments markets may monitor
- US policy detail: quarantine rules, enforcement posture, exemptions.
- UN and allies: statements that signal whether this becomes a long legitimacy fight.
- PDVSA operations: storage, shut-ins, diluent availability, floating storage signals.
- OPEC+ signalling: whether the group stays committed to stability if spreads blow out.

The United States entered a government shutdown on October 1, 2025, after Congress failed to agree on full-year appropriations or a short-term funding bill. Although shutdowns have occurred before, the timing, speed, scale, and motives behind this one make it unique. This is the first shutdown since the last Trump term in 2018–19, which lasted 35 days, the longest in history.For traders, understanding both the mechanics and the ripple effects is essential to anticipating how markets may respond, particularly if the shutdown draws out to multiple weeks as currently anticipated.
What Is a Government Shutdown?
A government shutdown occurs when Congress fails to pass appropriation bills or a temporary extension to fund government operations for the new fiscal year beginning October 1.Without the legal authority to spend, federal agencies must suspend “non-essential” operations, while “essential” services such as national security, air traffic control, and public safety continue, often with employees working unpaid until funding is restored.Since the Government Employee Fair Treatment Act of 2019, federal employees are guaranteed back pay to cover lost wages once the shutdown ends, although there has been some narrative from the current administration that some may not be returning to work at all.
Why Did the Government Shutdown Happen?
The 2025 impasse stems from partisan disputes over spending levels, health-insurance subsidies, and proposed rescissions of foreign aid and other programs. The reported result is that around 900,000 federal workers are furloughed, and another 700,000 are currently working without pay.Unlike many past standoffs, there was no stopgap agreement to keep the government open while negotiations continued, making this shutdown more disruptive and unusually early.
Why an Early Shutdown?
Historically, most shutdowns don’t occur immediately on October 1. Lawmakers typically kick the can down the road with a “Continuing Resolution (CR)”. This is a stopgap measure that can extend existing funding for weeks or months to allow time for an agreement later in the quarter.The speed of the breakdown in 2025, with no CR in place, is unusual compared to past shutdowns. It suggests it was not simply budgetary drift, but a potentially deliberate refusal to extend funding.
Alternative Theories Behind the Early Shutdown
While the main narrative coming from the U.S. administrators points to budget deadlock, several other theories are being discussed across the media:
- Executive Leverage – The White House may be using the shutdown as a tool to increase bargaining power and force structural policy changes. Health care is central to the debate, funding for which was impacted significantly by the “one big, beautiful bill” recently passed through Congress.
- Hardline Congressional Factions – Small but influential groups within Congress, particularly on the right, may be driving the shutdown to demand deeper cuts.
- Political Messaging – The blame game is rife, despite the reality that Republican control of the presidency, House, and Senate, as well as both sides, is indulging in the usual political barbs aimed at the other side. As for the voter impact, Recent polls show that voters are placing more blame on Republicans than Democrats at this point, though significant numbers of Americans suggest both parties are responsible
- Debt Ceiling Positioning – Creating a fiscal crisis early could shape the terms of future negotiations on borrowing limits.
- Electoral Calculus – With midterms ahead, both sides may be positioning to frame the narrative for voters.
- Systemic Dysfunction – A structural view is that shutdowns have become a recurring feature of hyper-partisan U.S. politics, rather than exceptions.
Short-Term Impact of Government Shutdown
AreaImpactFederal workforceHundreds of thousands have been furloughed with reduced services across various agencies.Travel & aviationFAA expects to furlough 11,000 staff. Inspections and certifications may stall. Safety concerns may become more acute if prolonged shutdown.Economic outputThe White House estimates a $15 billion GDP loss per week of shutdown (source: internal document obtained by “Politico”.Consumer spendingFederal workers and contractors face delayed income, pressuring local economies. Economic data releaseKey data releases may be delayed, impacting the decision process at the Fed meeting later this month.Credit outlookScope Ratings and others warn that the shutdown is “negative for credit” and could weigh on U.S. borrowing costs.Projects & researchInfrastructure, grants, and scientific initiatives are delayed or paused.
Medium- to Long-Term Impact of Government Shutdown
1. Market Sentiment
Shutdowns show some degree of U.S. political dysfunction. They can weigh on confidence and subsequently equity market and risk asset sentiment. To date, markets are shrugging off a prolonged impact, but a continued shutdown into later next week could start to impact.Equity markets have remained strong, and there has been no evidence of the frequent seasonal pullback we often see around this time of year.Markets have proved resilient to date, but one wonders whether this could be a catalyst for some significant selling to come.
2. Borrowing Costs
Ratings downgrades could lift Treasury yields and increase debt-servicing costs. The Federal Reserve is already balancing sticky inflation and potential downward pressure on growth. This could make rate decisions more difficult.
3. The Impact on the USD
Rises in treasury yields would generally support the USD. However, rising concerns about fiscal stability created by a prolonged shutdown may put further downward pressure on the USD. Consequently, it is likely to result in buying into gold as a safe haven. With gold already testing record highs repeatedly over the last weeks, this could support further moves to the upside.
4. Credibility Erosion
Repeated shutdowns weaken the U.S.’s reputation as the world’s most reliable borrower. With some evidence that tariffs are already impacting trade and investment into the US, a prolonged shutdown could exacerbate this further.
What Traders Should Watch
For those who trade financial markets, shutdowns matter more for what they could signal both in the short and medium term. Here are some of the key asset classes to watch:
- Equities: Likely to see volatility as political risk rises, and the potential for “money off the table” after significant gains year-to-date for equities.
- U.S. Dollar: With the US dollar already relatively weak, further vulnerability if a shutdown feeds global doubts about U.S. fiscal stability.
- Gold and other commodities: May continue to gain as hedges against political and credit risk. Oil is already threatening support levels; any prolonged shutdown may add to the bearish narrative, along with other economic slowdown concerns
- Outside the US: With the US such a big player in global GDP, we may see revisions in forward-looking estimates, slingshot impacts on other global markets and even supply chain disruptions with impact on customs services (potentially inflationary).
Final Word
The 2025 shutdown is unusual because of its scale and because it started on Day 1 of the fiscal year, without even a temporary extension. That speed points to a deeper strategic and political contribution beyond the usual budget wrangling that we see periodically.For traders, the lesson is clear: shutdowns are not just what happens in Washington, but may impact confidence, borrowing costs, and market sentiment across a range of asset classes. In today’s world, where political credibility is a form of capital, shutdowns have the potential to erode the very foundation of the U.S.’s role in global finance and trade relationships.
Recent Articles

ตลาดเคลื่อนไหวเข้าสู่สัปดาห์ข้างหน้าด้วยข้อมูลเงินเฟ้อทั่วออสเตรเลียและญี่ปุ่น ควบคู่ไปกับความตึงเครียดทางการเมืองที่เพิ่มขึ้นซึ่งยังคงมีอิทธิพลต่อราคาพลังงานและความเชื่อมั่นความเสี่ยงที่กว้างขึ้น
- ดัชนีราคาผู้บริโภคออสเตรเลีย (CPI): ข้อมูลอัตราเงินเฟ้ออาจมีอิทธิพลต่อ ธนาคารสำรองออสเตรเลีย (RBA) เส้นทางนโยบาย โดยดอลลาร์ออสเตรเลีย (AUD) และผลตอบแทนในท้องถิ่นมีความอ่อนไหวต่อความประหลาดใจใด ๆ
- คลัสเตอร์ข้อมูลญี่ปุ่น: CPI ของโตเกียว (เบื้องต้น) บวกกับการผลิตในอุตสาหกรรมและการขายปลีกทำให้เกิดแรงกระตุ้นอัตราเงินเฟ้อและกิจกรรมที่สามารถกำหนดความคาดหวังในการปรับตัวของธนาคารแห่งประเทศญี่ปุ่น (BoJ)
- ยูโรโซนและเยอรมนี CPI: การอ่านอัตราเงินเฟ้อแบบแฟลชจะทดสอบเรื่องราวของภาวะเงินเฟ้อและส่งผลต่อความคาดหวังในการลดอัตราดอกเบี้ยของ ECB
- น้ำมันและการเมืองธรณีวิทยา: น้ำมันดิบ Brent ปิดตัวสูงสุดนับตั้งแต่วันที่ 8 สิงหาคม 2025 ท่ามกลางความตึงเครียดในตะวันออกกลางที่เกิดขึ้นใหม่ซึ่งเพิ่มความเสี่ยงด้านเงินเฟ้อที่ขับเคลื่อนด้วยพลังงาน
CPI ของออสเตรเลีย: ความคาดหวังของ RBA จะเปลี่ยนไป?
การเผยแพร่ CPI ของออสเตรเลียจะได้รับการเฝ้าระวังอย่างใกล้ชิดเพื่อดูสัญญาณว่าเงินเฟ้อคงตัวหรือพิสูจน์ว่าคงที่มากกว่าที่คาดไว้
การพิมพ์ที่แข็งแกร่งกว่าที่คาดไว้อาจเกี่ยวข้องกับผลตอบแทนที่สูงขึ้นและ AUD ที่แข็งแกร่งขึ้นเมื่ออัตราคาดหวังปรับตัวผลลัพธ์ที่นุ่มนวลอาจสนับสนุนความคาดหวังสำหรับทัศนคติเชิงนโยบายที่มั่นคง
วันที่สำคัญ
- อัตราเงินเฟ้อ (MoM): วันพุธที่ 25 กุมภาพันธ์ เวลา 11:30 น. (AEDT)
- ซีพีไอ: วันพุธที่ 25 กุมภาพันธ์ เวลา 11:30 น. (AEDT)
มอนิเตอร์
- ความผันผวนของ AUD รอบการเปิดตัว
- ปฏิกิริยาผลตอบแทนพันธบัตรในพื้นที่
- การเปลี่ยนแปลงราคาอัตราดอกเบี้ย

ข้อมูลอัตราเงินเฟ้อและการเติบโตของญี่ปุ่น
การเผยแพร่ในช่วงปลายสัปดาห์ของญี่ปุ่นรวม CPI ของโตเกียว (เบื้องต้น) เข้ากับการผลิตอุตสาหกรรมและการขายปลีก นำเสนอการอ่านอย่างกว้างขวางเกี่ยวกับแรงกดดันราคาและความต้องการในประเทศ
CPI ของโตเกียวมักถูกมองว่าเป็นสัญญาณทันเวลาสำหรับการเปลี่ยนแปลงอัตราเงินเฟ้อของประเทศและการอภิปรายของ BoJผลผลิตอุตสาหกรรมและการใช้จ่ายค้าปลีกเพิ่มบริบทเกี่ยวกับกิจกรรม
ความประหลาดใจในกลุ่มนี้สามารถกระตุ้นให้ค่าเงินเยน JPY เคลื่อนไหวอย่างรวดเร็ว โดยเฉพาะอย่างยิ่งหากผลลัพธ์เปลี่ยนการรับรู้เกี่ยวกับความเร็วและความคงอยู่ของการปรับตัวให้เป็นปกติ BoJ
วันที่สำคัญ
- CPI ของโตเกียว: วันศุกร์ที่ 27 กุมภาพันธ์ เวลา 10:30 น. (AEDT)
- การผลิตอุตสาหกรรม: 10:50 น. ศุกร์ที่ 27 กุมภาพันธ์ (AEDT)
- การขายปลีก: 10:50 น. ศุกร์ที่ 27 กุมภาพันธ์ (AEDT)
มอนิเตอร์
- JPY มีความไวต่ออัตราเงินเฟ้อประหลาดใจ
- ผลตอบแทนพันธบัตรเคลื่อนไหวตามข้อมูลกิจกรรม
- ปฏิกิริยาหุ้นหากความคาดหวังโมเมนตัมการเติบโต
การไหลของพลังงานและที่ปลอดภัย
ราคาน้ำมันปรับตัวสูงสุดนับตั้งแต่วันที่ 8 สิงหาคม 2025 ท่ามกลางความตึงเครียดในตะวันออกกลางที่เกิดขึ้นใหม่
การรายงานล่าสุดเกี่ยวกับกิจกรรมทางทหารในภูมิภาคที่เพิ่มขึ้นและหัวข่าวความเสี่ยงต่อการขนส่งใกล้ช่องแคบฮอร์มูซได้เสริมความมั่นคงด้านพลังงานเพื่อจุดเน้นของตลาดช่องแคบฮอร์มูซยังคงเป็นจุดโชคที่เฝ้าระวังอย่างกว้างขวางสำหรับการไหลเวียนของพลังงานทั่วโลก
ราคาน้ำมันที่สูงขึ้นอาจส่งผลต่อความคาดหวังของอัตราเงินเฟ้อและส่งผลต่อผลตอบแทนพันในขณะเดียวกัน ความไม่แน่นอนทางภูมิศาสตร์สามารถรองรับเงินดอลลาร์สหรัฐผ่านความต้องการที่ปลอดภัยและการวางตำแหน่งอัตราสัมพัทธ์
มอนิเตอร์
- ระดับราคาน้ำมันดิบเบรนต์
- ความแข็งแกร่งของดอลลาร์สหรัฐเทียบกับสกุลเงินหลัก
- การเปลี่ยนแปลงผลตอบแทนเมื่อปรับเบี้ยประกันความเสี่ยงเงินเฟ้อ

เงินเฟ้อยูโรโซนและเยอรมน
การอ่านอัตราเงินเฟ้อแบบแฟลชจากเยอรมนีและยูโรโซนที่กว้างขวาง (HICP) จะทดสอบว่าแนวโน้มเงินเฟ้อของภูมิภาคยังคงไม่เหมือนเดิมหรือไม่
การเปิดตัวของเยอรมนีอาจมีอิทธิพลต่อความคาดหวังก่อนตัวเลขยูโรโซนรวมหากเงินเฟ้อหลักแสดงให้เห็นว่ามีความเหนียว ความคาดหวังเกี่ยวกับระยะเวลาและอัตราการผ่อนคลายของธนาคารกลางยุโรปอาจเปลี่ยนไป
วันที่สำคัญ
- อัตราเงินเฟ้อเยอรมนี: 12:00 น. วันเสาร์ที่ 28 กุมภาพันธ์ (AEDT)
มอนิเตอร์
- ความผันผวนของยูโรเมื่อมีการเผยแพร
- อัตราผลตอบแทนพันธบัตรรัฐยุโรป
- การปรับความน่าจะเป็นในการลดอัตรา
เหตุการณ์ทางเศรษฐกิจสำคัญ


ตั้งแต่ผู้ขัดขวางเทคโนโลยีไปจนถึงผู้รับเหมาด้านการป้องกัน บริษัท ที่พูดถึงมากที่สุดของตลาดบางแห่งเริ่มการเดินทางสาธารณะผ่านการเสนอขายสาธารณะครั้งแรก (IPO)สำหรับเทรดเดอร์ รายการสาธารณะเบื้องต้นเหล่านี้สามารถแสดงถึงสภาพแวดล้อมการซื้อขายที่ไม่เหมือนใคร แต่ยังเป็นช่วงเวลาแห่งความไม่แน่นอนที่เพิ่มขึ้นด้วย
ข้อเท็จจริงด่วน
- IPO คือเมื่อ บริษัท เอกชนจดทะเบียนหุ้นในตลาดหลักทรัพย์สาธารณะเป็นครั้งแรก
- IPO สามารถเสนอให้เทรดเดอร์เข้าถึงบริษัทที่เติบโตสูงได้ตั้งแต่เนิ่นๆ แต่มาพร้อมกับความผันผวนที่สูงขึ้นและประวัติราคาที่ จำกัด
- เมื่อจดทะเบียนแล้ว เทรดเดอร์สามารถได้รับโอกาสในการเปิดเผยหุ้น IPO ผ่านการซื้อหุ้นโดยตรงหรืออนุพันธ์ เช่น สัญญาสำหรับความแตกต่าง (CFD).
การเสนอขายสาธารณะครั้งแรก (IPO) คืออะไร?
IPO คือเมื่อ บริษัท เสนอหุ้นให้กับประชาชนเป็นครั้งแรก
ก่อนที่จะดำเนินการ IPO หุ้นใน บริษัท มักจะถือโดยผู้ก่อตั้ง พนักงานแรกๆ และนักลงทุนเอกชนเท่านั้นการเปิดเผยต่อสาธารณะทำให้ทุกคนสามารถซื้อหุ้นได้
ขึ้นอยู่กับขนาดของ บริษัท โดยปกติจะแสดงรายการหุ้นสาธารณะในตลาดหลักทรัพย์ท้องถิ่น (ตัวอย่างเช่น แอ็กซ์ ในออสเตรเลีย)อย่างไรก็ตาม บริษัท ประเมินมูลค่าขนาดใหญ่บางแห่งเลือกที่จะลงทะเบียนในตลาดหลักทรัพย์ทั่วโลกเท่านั้น เช่น Nasdaq ไม่ว่าสำนักงานใหญ่ของพวกเขาจะอยู่ที่ไหน
สำหรับนักเทรดโดยทั่วไปแล้ว IPO เป็นโอกาสแรกที่จะได้รับความเสี่ยงต่อหุ้นของ บริษัทพวกเขาสามารถสร้างสภาพแวดล้อมที่เป็นเอกลักษณ์พร้อมความผันผวนและสภาพคล่องที่เพิ่มขึ้น แต่ยังมีความเสี่ยงที่สูงขึ้นด้วยประวัติราคาที่ จำกัด และความอ่อนไหวต่อการเปลี่ยนแปลงของความเชื่อมั่น
ทำไม บริษัท จึงเปิดเผยต่อสาธารณะ
ตัวขับเคลื่อนที่ใหญ่ที่สุดในการดำเนินการ IPO คือการเข้าถึงเงินทุนมากขึ้นการจดทะเบียนในตลาดหลักทรัพย์หมายความว่า บริษัท สามารถระดมทุนได้อย่างมีนัยสำคัญโดยการขายหุ้น
นอกจากนี้ยังให้สภาพคล่องสำหรับผู้ถือหุ้นที่มีอยู่ผู้ก่อตั้ง พนักงานยุคแรก และนักลงทุนเอกชนมักขายส่วนหนึ่งของการถือครองที่มีอยู่ในตลาดเปิด โดยตระหนักถึงผลตอบแทนจากการสนับสนุนหลายปีของพวกเขา
นอกเหนือจากผลประโยชน์ทางการเงินแล้ว การเข้าสู่สาธารณะหมายความว่า บริษัท ต่างๆสามารถใช้หุ้นของตนเป็นสกุลเงินสำหรับการซื้อกิจการและเสนอค่าชดเชยตามหลักทรัพย์เพื่อดึงดูดผู้มีความสามารถได้และการประเมินมูลค่าสาธารณะให้เกณฑ์มาตรฐานที่โปร่งใส ซึ่งมีประโยชน์สำหรับการวางตำแหน่งเชิงกลยุทธ์และการระดมทุนในอนาคต
อย่างไรก็ตามมันมาพร้อมกับข้อเท็จจริงบริษัทมหาชนต้องปฏิบัติตามภาระผูกพันในการเปิดเผยข้อมูลและการรายงานอย่างต่อเนื่อง และความกดดันจากผู้ถือหุ้นสาธารณะอาจกลายเป็นอุปสรรคต่อความคืบหน้าในระยะยาวหากหลายคนมุ่งเน้นไปที่ผลการดำเนินงานระยะสั้น

กระบวนการ IPO ทำงานอย่างไร?
แม้ว่าข้อมูลเฉพาะจะแตกต่างกันไปตามเขตอำนาจศาล แต่การเปลี่ยนจาก บริษัท เอกชนไปเป็นรายชื่อสาธารณะโดยทั่วไปเกี่ยวข้องกับขั้นตอนต่อไปนี้:
1.การเตรียมการ
บริษัทคัดเลือกผู้รับผิดชอบก่อน (โดยทั่วไปจะเป็นธนาคารเพื่อลงทุน) เพื่อจัดการการเสนอขายพวกเขาร่วมกันประเมินทางการเงินโครงสร้างองค์กรและตำแหน่งตลาดของ บริษัท เพื่อกำหนดแนวทางที่ดีที่สุดสำหรับการเปิดเผยต่อสาธารณะเป็นขั้นตอนการวางแผนที่หนักเพื่อให้แน่ใจว่า บริษัท พร้อมที่จะเปิดเผยต่อสาธารณะจริงๆ
2.การลงทะเบียน
เมื่อเตรียมทุกอย่างแล้ว ผู้รับประกันจะทำการตรวจสอบการตรวจสอบสถานะอย่างละเอียดและยื่นเอกสารการเปิดเผยที่จำเป็นกับหน่วยงานกำกับดูแลที่เกี่ยวข้องเอกสารเหล่านี้ให้การเปิดเผยรายละเอียดแก่หน่วยงานกำกับดูแลเกี่ยวกับ บริษัท การบริหารและการเสนอขายที่เสนอในออสเตรเลีย โดยทั่วไปแล้วจะเป็นหนังสือชี้ชวนที่ยื่นกับ ASIC ในสหรัฐอเมริกา คำชี้แจงการลงทะเบียนที่ยื่นต่อ SEC
3.การเดินทางไปจัดแสดงตามสถานที่ต่าง ๆ
ผู้บริหารของ บริษัท และผู้ประกันภัยจะนำเสนอกรณีการลงทุนต่อนักลงทุนสถาบันและนักวิเคราะห์ตลาดใน “โรดโชว์”ตู้โชว์นี้ได้รับการออกแบบมาเพื่อวัดความต้องการหุ้นและช่วยสร้างความสนใจนักลงทุนสถาบันสามารถลงทะเบียนผลประโยชน์และการประเมินมูลค่าของ IPO ซึ่งช่วยแจ้งการกำหนดราคาเริ่มต้น
4.การกำหนดราคา
จากข้อเสนอแนะจากงานแสดงสินค้าและเงื่อนไขตลาดปัจจุบัน ผู้ประกันภัยจะกำหนดราคาหุ้นสุดท้ายและกำหนดจำนวนหุ้นที่จะออกมาหุ้นจะถูกจัดสรรใน 'ตลาดหลัก' ให้กับนักลงทุนที่เข้าร่วมในข้อเสนอ (ก่อนที่หุ้นจะถูกจดทะเบียนต่อสาธารณะในตลาดรอง)กระบวนการนี้กำหนดราคาก่อนการตลาดซึ่งกำหนดการประเมินมูลค่าสาธารณะเบื้องต้นของ บริษัท อย่างมีประสิทธิภาพ
5.รายการ
ในวันจดทะเบียนหุ้นของ บริษัท เริ่มซื้อขายในตลาดหลักทรัพย์ที่เลือกเปิดตลาดรองอย่างเป็นทางการสำหรับผู้ค้าส่วนใหญ่นี่เป็นจุดแรกที่พวกเขาสามารถซื้อขายหุ้นได้ทั้งโดยตรงหรือผ่านอนุพันธ์เช่น หุ้น CFD.
6.หลังการเสนอขายหุ้น
เมื่อจดทะเบียนแล้ว บริษัทจะอยู่ภายใต้ข้อกำหนดในการรายงานและการเปิดเผยข้อมูลที่เข้มงวดต้องสื่อสารกับผู้ถือหุ้นเป็นประจำเผยแพร่ผลการเงินและปฏิบัติตามมาตรฐานการกำกับดูแลของตลาดหลักทรัพย์ที่จดทะเบียน
ความเสี่ยงและผลประโยชน์ของ IPO สำหรับผู้ค้า
เทรดเดอร์มีส่วนร่วมใน IPO อย่างไร?
สำหรับผู้ค้าส่วนใหญ่ การเข้าร่วมใน IPO เกิดขึ้นเมื่อหุ้นจดทะเบียนและเริ่มซื้อขายในตลาดรอง
เมื่อหุ้นอยู่ในตลาดหลักทรัพย์ นักลงทุนสามารถซื้อหุ้นทางกายภาพได้โดยตรงผ่านโบรกเกอร์หรือการแลกเปลี่ยนออนไลน์ หรือพวกเขาสามารถใช้อนุพันธ์เช่น หุ้น CFD เพื่อรับตำแหน่งในราคาโดยไม่ต้องเป็นเจ้าของสินทรัพย์อ้างอิง
สองสามวันแรกของการซื้อขาย IPO มักจะมีความผันผวนสูงผู้ค้าควรตรวจสอบให้แน่ใจว่าพวกเขาได้ใช้มาตรการบริหารความเสี่ยงที่เหมาะสมเพื่อช่วยป้องกันการเปลี่ยนแปลงของราคาที่อาจเกิดขึ้นอย่างรวดเร็ว
บรรทัดล่าง
IPO ทำเครื่องหมายเมื่อบริษัทสามารถลงทุนต่อสาธารณชนพวกเขาสามารถเสนอการเข้าถึงบริษัทที่มีการเติบโตสูงตั้งแต่เนิ่นๆ และสร้างสภาพแวดล้อมการซื้อขายที่ไม่เหมือนใครซึ่งขับเคลื่อนโดยความผันผวนที่สูงขึ้นและความสนใจของตลาด
สำหรับเทรดเดอร์ การทำความเข้าใจว่ากระบวนการทำงานอย่างไร ผลักดันการกำหนดราคาและผลการดำเนินงานหลังการเสนอขายหุ้นหลังการซื้อขาย และวิธีชั่งน้ำหนักของรางวัลที่อาจเกิดขึ้นกับความเสี่ยงของการซื้อขายหุ้นจดทะเบียนใหม่เป็นสิ่งสำคัญก่อนที่จะทำตำแหน่ง

ปี 2026 ไม่ได้ทำให้นักลงทุนมีพื้นที่หายใจมากนักดูเหมือนว่าตลาดอาจขยับไปเกินแนวคิดที่ว่าการลดอัตราดอกเบี้ยใกล้เข้ามาและเข้าสู่ปีที่อัตราเงินเฟ้ออาจพิสูจน์ได้ยากกว่าที่หลายคนคาดหวัง
อัตราเงินเฟ้อสินค้าเพิ่มขึ้น ในขณะที่เงินเฟ้อบริการยังคงค่อนข้างเหนียวเนื่องจากแรงกดดันต้นทุนแรงงานอย่างต่อเนื่องต้นทุนที่อยู่อาศัยโดยเฉพาะค่าเช่า ยังคงเป็นแหล่งที่สำคัญของแรงกดดันเงินเฟ้อ
RBA พยายามรักษาความน่าเชื่อถือเกี่ยวกับเงินเฟ้อโดยไม่ผลักดันเศรษฐกิจไปทางอื่นเกินไป
ข้อมูลที่สำคัญ
CPI ยังคงอยู่ใกล้ ร้อยละ 3.8 (เหนือเป้าหมาย) ค่าจ้างยังคงเพิ่มขึ้นประมาณ ร้อยละ 0.8 ในช่วงไตรมาสและการว่างงานก็อยู่ใกล้ ๆ 4.1 เปอร์เซ็นต์.
ขึ้นอยู่กับการกำหนดราคาโดยนัยตามตลาด คาดว่าจะมีการเพิ่มอัตราดอกเบี้ยในไม่ช้า ดังนั้นวิธีที่ RBA อธิบายการตัดสินใจอาจมีความสำคัญเกือบเท่ากับการตัดสินใจเองหากโทนเปลี่ยนความคาดหวังความคาดหวังเหล่านั้นสามารถเคลื่อนไหวตลาดได้
หนังสือเลย์บุ๊คนี้ครอบคลุมอะไร
นี่คือหนังสือเลย์บุ๊คสำหรับสัปดาห์หนักของ RBA ในปี 2026มันครอบคลุมสิ่งที่ต้องดูในทุกภาคส่วน แสดงรายการทริกเกอร์ที่สำคัญ และอธิบายว่าตัวบ่งชี้ใดที่อาจเปลี่ยนความรู้สึกได้

1.ธนาคารและการเงิน: การตัดสินใจของ RBA ไหลไปสู่การให้กู้ยืมและผู้กู้อย่างไร
ธนาคารเป็นที่ที่ RBA แสดงให้เห็นได้เร็วที่สุดในเศรษฐกิจออสเตรเลียอัตราดอกเบี้ยสามารถส่งผลกระทบต่อผู้กู้ได้อย่างรวดเร็วและนำไปสู่ต้นทุนและความเชื่อมั่นในการระดมทุน
ในระยะที่เข้มงวด อัตรากำไรสามารถปรับปรุงได้ในตอนแรก แต่ก็สามารถพลิกกลับได้หากต้นทุนการระดมทุนเพิ่มขึ้นเร็วขึ้นหรือหากคุณภาพเครดิตเริ่มอ่อนลงความสมดุลระหว่างกองกำลังเหล่านั้นเป็นสิ่งที่สำคัญที่สุด
หากธนาคารรวมตัวเข้าสู่สัปดาห์การตัดสินใจ RBA อาจหมายความว่าตลาดคิดว่าสูงขึ้นเพื่อรองรับรายได้นานขึ้นหากขายหมดอาจหมายความว่าตลาดคิดว่าสูงขึ้นเป็นเวลานานทำให้ผู้กู้ส่งผลเสียหายต่อไปคุณสามารถอ่านที่แตกต่างกันสองครั้งจากหัวเรื่องเดียวกัน
สิ่งที่ต้องดู
- รูปร่างเส้นโค้งผลตอบแทน: เส้นโค้งที่สูงขึ้นสามารถช่วยอัตรากำไรได้ ในขณะที่เส้นโค้งกลับสามารถส่งสัญญาณความเครียดในการเติบโตได้
- การแข่งขันเงินฝาก: มันสามารถกดอัตรากำไรได้อย่างเงียบ ๆ แม้ว่าอัตราส่วนต้นจะดูสนับสนุนก็ตาม
- คำพูด RBA เกี่ยวกับเสถียรภาพทางการเงิน บัฟเฟอร์ครัวเรือน และความยืดหยุ่นวลีเล็ก ๆ สามารถเปลี่ยนเรื่องราวความเสี่ยงได้
ทริกเกอร์ที่อาจ
หากดัชนี RBA ฟังดูน่ากลัวมากกว่าที่คาดไว้ ธนาคารอาจตอบสนองเร็ว เนื่องจากตลาดประเมินความคาดหวังการเติบโตและความเสี่ยงด้านเครดิตอีกครั้งการเคลื่อนไหวครั้งแรกบางครั้งสามารถตั้งค่าโทนสำหรับเซสชัน
ความเสี่ยงที่สำคัญ
- ต้นทุนการระดมทุนเพิ่มขึ้นเร็วกว่าผลตอบแทนสินเชื่อ: อาจชี้ไปที่แรงดันอัตรากร
- เงื่อนไขเครดิตเข้มงวดอย่างชัดเจน: การค้างชำระที่เพิ่มขึ้นหรือความเครียดในการรีไฟแนนซ์สามารถเปลี่ยนการเล่าได้อย่างรวดเร็ว

2.ดุลยพินิจของผู้บริโภคและการค้าปลีก: อัตราที่สูงขึ้นส่งผลกระทบต่อการใช้จ่าย
เมื่อนโยบายเข้มงวด ดุลยพินิจของผู้บริโภคจะกลายเป็นแบบทดสอบความยืดหยุ่นของครัวเรือนนี่คือจุดที่ค่าใช้จ่ายในชีวิตประจำวันที่สูงขึ้นมักปรากฏเร็วที่สุด
การโทรขนาดใหญ่เกี่ยวกับผู้บริโภคอาจดูชัดเจนจนกว่าข้อมูลจะหยุดสำรองข้อมูลเมื่อสิ่งนั้นเกิดขึ้นการบรรยายสามารถเปลี่ยนแปลงได้อย่างรวดเร็ว
สิ่งที่ต้องดู
- ค่าจ้างเทียบกับอัตราเงินเฟ้อ: ผลักหรือลากรายได้จริง
- สัญญาณแรงงานในช่วงต้น: ชั่วโมงการทำงานสามารถอ่อนตัวลงก่อนที่การว่างงานเพิ่มขึ้น
- เบาะแสฤดูกาลรายงาน: การลดราคา การส่งผ่านต้นทุน และแรงกดดันมาร์จิ้นสามารถบ่งชี้ว่าความต้องการที่ขยายตัวจริงแค่ไหน
ทริกเกอร์ที่อาจ
หากเสียงจาก RBA มีค่ามากกว่าที่คาดไว้ ภาคส่วนนี้อาจมีความอ่อนไหวต่ออัตราความคาดหวังการเคลื่อนไหวครั้งแรกอาจไม่เกิดขึ้นและการดำเนินการราคาที่ตามมาอาจขึ้นอยู่กับข้อมูลที่เข้ามาและการวางตำแหน่ง
ความเสี่ยงที่สำคัญ
- การเปลี่ยนแปลงอย่างรวดเร็วในตลาดแรงงาน
- แรงกระแทกต้นทุนการครองชีพใหม่ โดยเฉพาะพลังงานหรือที่อยู่อาศัย ซึ่งส่งผลกระทบต่อการใช้จ่ายอย่างรวดเร็ว

3.แหล่งข้อมูล: สิ่งที่ควรระวังเมื่อภาษีการเมืองทางภูมิศาสตร์และการเปลี่ยนแปลงนโยบาย
ทรัพยากรสามารถทำหน้าที่เป็นการอ่านเกี่ยวกับการเติบโตของโลกได้ แต่การเคลื่อนไหวของสกุลเงินและเสียงของธนาคารกลางสามารถเปลี่ยนวิธีที่เรื่องราวนั้นเกิดขึ้นในออสเตรเลีย
ในปี 2026 อัตราภาษีและการเมืองทางภูมิศาสตร์ยังสามารถสร้างการเคลื่อนไหวของหัวข้อที่คมชัดกว่าปกติ ดังนั้นความเสี่ยงช่องว่างจึงสามารถอยู่เหนือวงจรปกติ
RBA ยังคงมีความสำคัญผ่านสองช่องทาง ได้แก่ ดอลลาร์ออสเตรเลียและความอยากเสี่ยงโดยรวมทั้งสองสามารถคืนราคาภาคได้อย่างรวดเร็วแม้ว่าราคาสินค้าโภคภัณฑ์จะไม่เคลื่อนไหวมากก็ตาม
สิ่งที่ต้องดู
- ชีพจรการเติบโตทั่วโลก: ความคาดหวังความต้องการของอุตสาหกรรมและสัญญาณที่เชื่อมโยงกับจีน
- ดอลลาร์ออสเตรเลีย: การเคลื่อนไหวหลังการตัดสินใจอาจกลายเป็นตัวขับเคลื่อนที่สองสำหรับภาคส่วนนี้
- ความเป็นผู้นำภาคส่วน: การซื้อขายทรัพยากรเทียบกับตลาดที่กว้างขึ้นสามารถส่งสัญญาณถึงระบอบการปกครองปัจจุบันได้อย่างไร
ทริกเกอร์ที่อาจ
หากโทนเสียง RBA เปลี่ยนเป็นข้อ จำกัด มากขึ้นในขณะที่การเติบโตของโลกยังคงที่คงที่ ทรัพยากรอาจคงตัวได้ดีกว่าส่วนอื่น ๆ ของตลาดกระแสเงินสดที่แข็งแกร่งอาจมีความสำคัญมากขึ้นและมุมสินทรัพย์จริงสามารถดึงดูดผู้ซื้อได้
ความเสี่ยงที่สำคัญ
- ในเหตุการณ์ความเครียดที่แท้จริง ความสัมพันธ์สามารถกระโดดได้ และการวางตำแหน่งป้องกันอาจล้มเหลวได้
- หากนโยบายเข้มงวดให้กลัวการเติบโต วงจรสามารถเข้าครอบงำ และภาคส่วนก็สามารถจางหายไปได้อย่างรวดเร็ว

4.อุปกรณ์ป้องกัน ลวดเย็บกระดาษ และการดูแลสุขภาพที่มีคุณภาพ
การป้องกันมีไว้เพื่อเป็นมุมที่สงบกว่าของตลาดเมื่อทุกอย่างรู้สึกยุ่งเหยิงในปี 2026 พวกเขายังคงมีจุดอ่อนใหญ่หนึ่ง: อัตราส่วนลด
การป้องกันที่มีคุณภาพสามารถดึงดูดการไหลเข้าได้เมื่อการเติบโตดูสั่นสะเทือน แต่หุ้นที่เติบโตด้านการป้องกันบางส่วนยังคงซื้อขายเหมือนสินทรัพย์ระยะยาวพวกเขาสามารถได้รับผลกระทบเมื่อผลตอบแทนเพิ่มขึ้น แม้ว่าธุรกิจจะดูแข็งแกร่งก็ตามนั่นหมายความว่ารายได้อาจคงที่ในขณะที่การประเมินค่ายังคงเคลื่อนที่
สิ่งที่ต้องดู
- ความแข็งแรงสัมพัทธ์: การป้องกันทำงานอย่างไรในช่วงสัปดาห์ RBA เทียบกับตลาดที่กว้างขวาง
- ภาษาแนะนำ: ความคิดเห็นเกี่ยวกับแรงกดดันด้านต้นทุน พลังการกำหนดราคา และปริมาณคงอยู่หรือไม่
- พฤติกรรมผลตอบแทน: ผลตอบแทนที่เพิ่มขึ้นสามารถเอาชนะการเสนอราคาคุณภาพและผลักคูณลดลง
ทริกเกอร์ที่อาจ
หาก RBA ฟังดูเป็นเหยี่ยวและวัฏจักรเริ่มสั่นสะเทือน สารป้องกันสามารถดึงดูดการไหลเข้าสัมพัทธ์ได้ แต่นั่นอาจขึ้นอยู่กับผลตอบแทนที่ยังคงมีอยู่หากผลตอบแทนเพิ่มขึ้นอย่างรวดเร็ว การป้องกันระยะยาวยังคงลดอัตราได้
ความเสี่ยงที่สำคัญ
- อัตราเงินเฟ้อต้นทุนที่บีบอัตรากำไรและทำให้เรื่องราวการป้องกันอ่อนแอลง

5.สินทรัพย์แข็ง ทองคำ และหุ้นทอง
ในปี 2026 สินทรัพย์แข็งอาจน้อยลงเกี่ยวกับเรื่องราวป้องกันความเสี่ยงเงินเฟ้ออย่างง่าย และมากขึ้นเกี่ยวกับความเสี่ยงด้านท้ายและความไม่แน่นอนของนโยบาย
เมื่อความเชื่อมั่นอ่อนลง สินทรัพย์ที่แข็งมักจะได้รับความสนใจมากขึ้นพวกเขาไม่ได้ขับเคลื่อนด้วยปัจจัยใดปัจจัยหนึ่ง และทองคำยังคงลดลงได้หากผู้ขับขี่หลักวิ่งกับมัน
สิ่งที่ต้องดู
- ทิศทางผลตอบแทนจริง: กำหนดต้นทุนโอกาสในการถือทองคำ
- ทิศทางดอลลาร์สหรัฐ: ช่องทางการกำหนดราคาหลักสำหรับทองคำ
- หุ้นทองคำเทียบกับสปอตโกลด์: นักขุดเพิ่มเลเวอเรจในการดำเนินงาน และยังเพิ่มความเสี่ยงด้านต้นทุน
ทริกเกอร์ที่อาจ
หากตลาดเริ่มตั้งคำถามเกี่ยวกับการควบคุมอัตราเงินเฟ้อหรือความน่าเชื่อถือของนโยบาย การเล่าเรื่องสินทรัพย์ที่ยากจะแข็งแกร่งขึ้นได้หาก RBA ยังคงมีข้อ จำกัด ในขณะที่เงินเฟ้อยังคงดำเนินต่อไป ทองคำอาจสูญเสียความเร่งด่วนและเงินสามารถหมุนเวียนไปสู่การซื้อขายอื่นได้
ความเสี่ยงที่สำคัญ
- ผลตอบแทนที่แท้จริงเพิ่มขึ้นอย่างมีนัยสำคัญ ซึ่งสามารถกดดันทองคำ
- ความแออัดและการวางตำแหน่งที่อาจทำให้เกิดการดึงกลับอย่างรวดเร็ว

6.ระบบประปาของตลาด FX ความผันผวนของอัตราและการกระจายตัว
ในบางสัปดาห์ RBA การเคลื่อนไหวครั้งแรกปรากฏขึ้นในอัตราและดอลลาร์ออสเตรเลีย และหุ้นตามมาผ่านการหมุนเวียนของภาคส่วนมากกว่าการเคลื่อนไหวของดัชนีที่สะอาด
เมื่อแนวทางเปลี่ยนแปลง RBA สามารถเปลี่ยนแปลงวิธีการเคลื่อนไหวของตลาดด้วยกันคุณสามารถจบลงท้ายด้วยดัชนีแบนในขณะที่เซกเตอร์แกว่งอย่างแข็งในทิศทางตรงกันข้าม
สิ่งที่ต้องดู
- อัตราส่วนหน้า: ความเร็วในการปรับราคาทันทีหลังจากการตัดสินใจสามารถเปิดเผยความประหลาดใจที่แท้จริงได้
- ปฏิกิริยา AUD: ทิศทางและการติดตามมักจะเป็นตัวกำหนดการเคลื่อนไหวครั้งต่อไปในหุ้นและทรัพยากร
- ความผันผวนโดยนัยเทียบกับที่เกิดขึ้นจริง: สามารถแสดงให้เห็นว่าตลาดจ่ายเงินมากเกินไปหรือน้อยเกินไปสำหรับงานดังกล่าว
- ตัวเลือกเอียงตัว: สามารถสะท้อนความต้องการด้านการป้องกันด้านลบกับการไล่ล่าตัวลงได้
- พฤติกรรมเทปในช่วงต้น: 5 ถึง 15 นาทีแรกอาจยุ่งเหยิงและสามารถเปลี่ยนแปลง
ทริกเกอร์ที่อาจ
หากคาดว่าจะมีการตัดสินใจ แต่คำชี้แจงจะเอียงไปอย่างหนึ่ง ส่วนด้านหน้าอาจเปลี่ยนราคาก่อน และ AUD สามารถเคลื่อนไหวไปพร้อมกับมันได้ความผันผวนที่เกิดขึ้นสามารถกระโดดได้แม้ว่าดัชนีแทบจะไม่เคลื่อนไหวแม้ว่าตลาดจะเขียนเส้นทางใหม่และหมุนตำแหน่งใต้พื้นผิว
ความเสี่ยงที่สำคัญ
- ความประหลาดใจที่แท้จริงที่ครอบงำตัวเลือกที่นัยและสร้างการเคลื่อนไหวของช่องว่าง
- หัวข่าวมาโครที่แข่งขันกันที่ครอบงำเทปและทำให้สัญญาณ RBA จมลง
- สภาพคล่องบางที่สร้างสัญญาณเท็จ Whipsaw และการดำเนินการที่เลวร้ายกว่าที่โมเดลสันนิษฐาน

7.กระเช้าธีม
กระเช้าธีมอาจอนุญาตให้เทรดเดอร์แสดงระบอบการปกครองแบบมาโครในขณะที่ลดความเสี่ยงที่มีชื่อเดียวพวกเขายังแนะนำความเสี่ยงของตนเองโดยเฉพาะอย่างยิ่งเกี่ยวกับเหตุการณ์
สิ่งที่ต้องดู
- ตะกร้ามีอะไรบ้าง: วิธีการกฎการปรับสมดุลความเข้มข้นที่ซ่อนอยู่
- สภาพคล่องและสเปรด: โดยเฉพาะบริเวณหน้าต่างกิจกรรม
- การติดตามกับการบรรยาย: “ธีม” ทำงานเหมือนไดรเวอร์มาโครหรือไม่
ทริกเกอร์ที่อาจ
หากภาษา RBA เสริมระบอบระบอบการปกครอง “จำกัด และไม่แน่นอน” ตะกร้าธีมที่เชื่อมโยงกับมูลค่า คุณภาพ หรือสินทรัพย์แข็งอาจดึงดูดความสนใจ โดยเฉพาะอย่างยิ่งหากดัชนีกว้างขวางลดลง
ความเสี่ยงที่สำคัญ
- การพลิกกลับธีมเมื่อความคาดหวังของมาโครเปลี่ยนไป
- ความเสี่ยงด้านสภาพคล่องรอบหน้าต่างเหตุการณ์ ซึ่งสเปรดสามารถขยายตัวได้อย่างมีนัยสำคัญ
จุดเด่นของหนังสือเลย์บุ๊คนี้ไม่ใช่การคาดการณ์หัวเรื่องที่แน่นอน มันคือการรู้ว่าเอฟเฟกต์ลำดับสองมักจะมาที่ไหน และต้องเตรียมรายการตรวจสอบสั้น ๆ ก่อนที่การตัดสินใจจะเกิดขึ้น
การรักษาทริกเกอร์และความเสี่ยงเหล่านี้อาจช่วยให้เทรดเดอร์บางรายจัดโครงสร้างการตรวจสอบตามการตัดสินใจ RBA ตลอดปี 2026
คำถามที่พบบ่อย
ทำไม “เสียง” จึงมีความสำคัญมากในปี 2026?
เพราะตลาดมักจะทำการตัดสินใจล่วงหน้าข้อมูลที่เพิ่มขึ้นคือคำแนะนำเกี่ยวกับว่า RBA ฟังดูสะดวกสบาย กังวล หรือเปิดให้เคลื่อนไหวอีกครั้ง
อะไรคือสิ่งที่เร็วที่สุดหลังจากการตัดสินใจ
เทรดเดอร์บางคนมองว่าอัตราส่วนหน้า AUD และการเป็นผู้นำของภาคส่วนเป็นตัวบ่งชี้เริ่มต้น แต่สัญญาณเหล่านี้อาจมีเสียงดังและมีอิทธิพลจากตำแหน่งและสภาพคล่อง
ทำไม REIT จึงเรียกว่าการซื้อขายระยะเวลา
เนื่องจากการประเมินมูลค่าส่วนใหญ่อาจมีความอ่อนไหวต่ออัตราส่วนลดและต้นทุนการระดมทุนเมื่อผลตอบแทนเคลื่อนที่ การประเมินราคาสามารถคืนราคาได้อย่างรวดเร็ว
การป้องกันปลอดภัยกว่าอยู่รอบ RBA เสมอหรือไม่?
ไม่เสมอไปหากผลตอบแทนเพิ่มขึ้น ระบบป้องกันระยะยาวยังสามารถปรับราคาต่ำลงแม้จะมีรายได้ที่มั่นคง
ทำไมสินทรัพย์ฮาร์ดจึงปรากฏขึ้นอย่างต่อเนื่องในเรื่องราวปี 2026?
เพราะพวกเขาสามารถทำหน้าที่เป็นการป้องกันความเสี่ยงเมื่อความไว้วางใจในนโยบายความน่าเชื่อถือของนโยบายสั่นลง แต่พวกเขายังมีความเสี่ยงจากความแออัดและความเสี่ยงจากผลตอบแทนที่แท้จริงด้วย

