REMX approaches key resistance after a sharp rebound
- Instrument: REMX (VanEck Rare Earth and Strategic Metals ETF)
- Time horizon: Short-to-medium term
- Market read: Price action is often interpreted as neutral-to-constructive while holding above the ~$68 area, outcomes remain uncertain
- Chart reference levels: ~$75 (prior reaction/overhead supply area), ~$68 (support area), then ~$81 (next prior reaction area)
Rare earth and strategic metals equities have been among the stronger-performing thematic areas in 2025, though recent price action suggests the rally has paused as investors reassess momentum. REMX has rebounded sharply from its April lows and is now consolidating below a technically significant resistance zone near $75, making it a key level to monitor.
What is REMX?
REMX is an exchange-traded fund that provides diversified exposure to global companies involved in mining, refining, and recycling rare earth and strategic metals. For traders and investors who want sector exposure without relying on a single issuer, the ETF structure can help spread company-specific risk. Performance will still be highly sensitive to commodity cycles and policy/geopolitics.
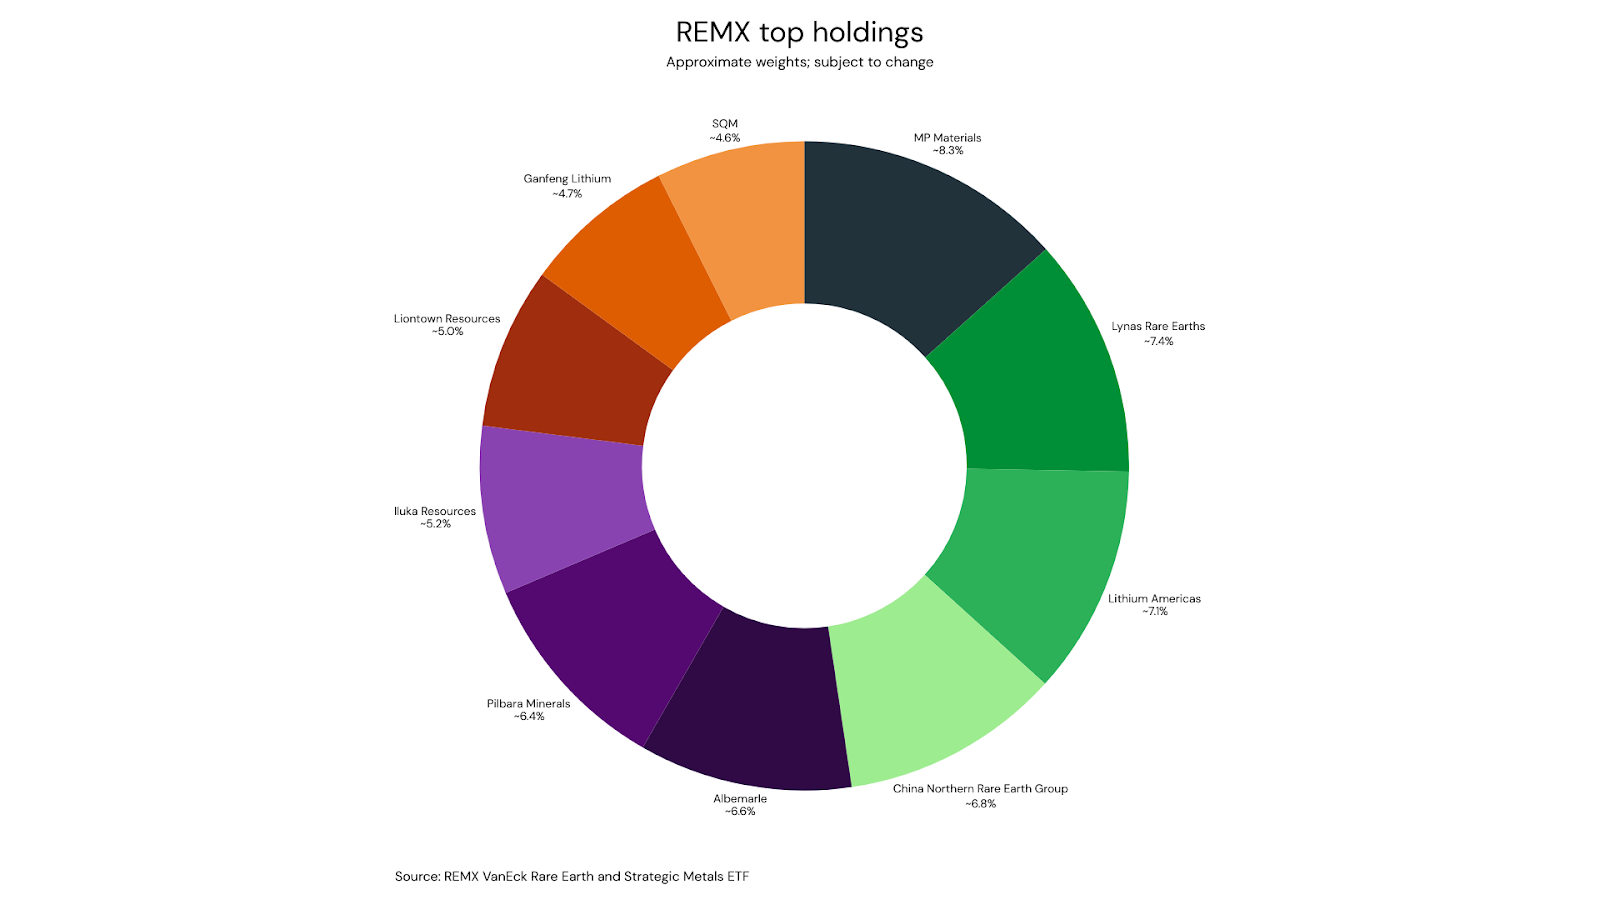
Portfolio snapshot
The ETF’s larger positions typically include a mix of rare earth producers and lithium-related names. Examples of top holdings (approximate weights, based on the fund’s most recent publicly available holdings data)
Why rare earths and strategic metals matter
Rare earth elements (a group of 17 metals) are not necessarily scarce in the earth’s crust, but economically viable deposits—and especially processing capacity—are concentrated. This creates a supply-chain dynamic where policy decisions, trade restrictions, and downstream demand can have outsized impacts on pricing and sentiment.
Key demand linkages include:
- EVs and wind power (permanent magnets and motors)
- Electronics (speakers, screens, storage)
- Defence/aerospace (guidance, radar, specialised alloys)
- Industrial catalysts (refining and emissions control)
Technical outlook
After marking multi-year lows around $33 in early April, REMX rallied strongly and returned to levels last seen in mid-2023. The $75 area stands out as a prior multi-touch support zone (2021–2023), which increases the probability it acts as resistance on the first approach.
REMX weekly chart
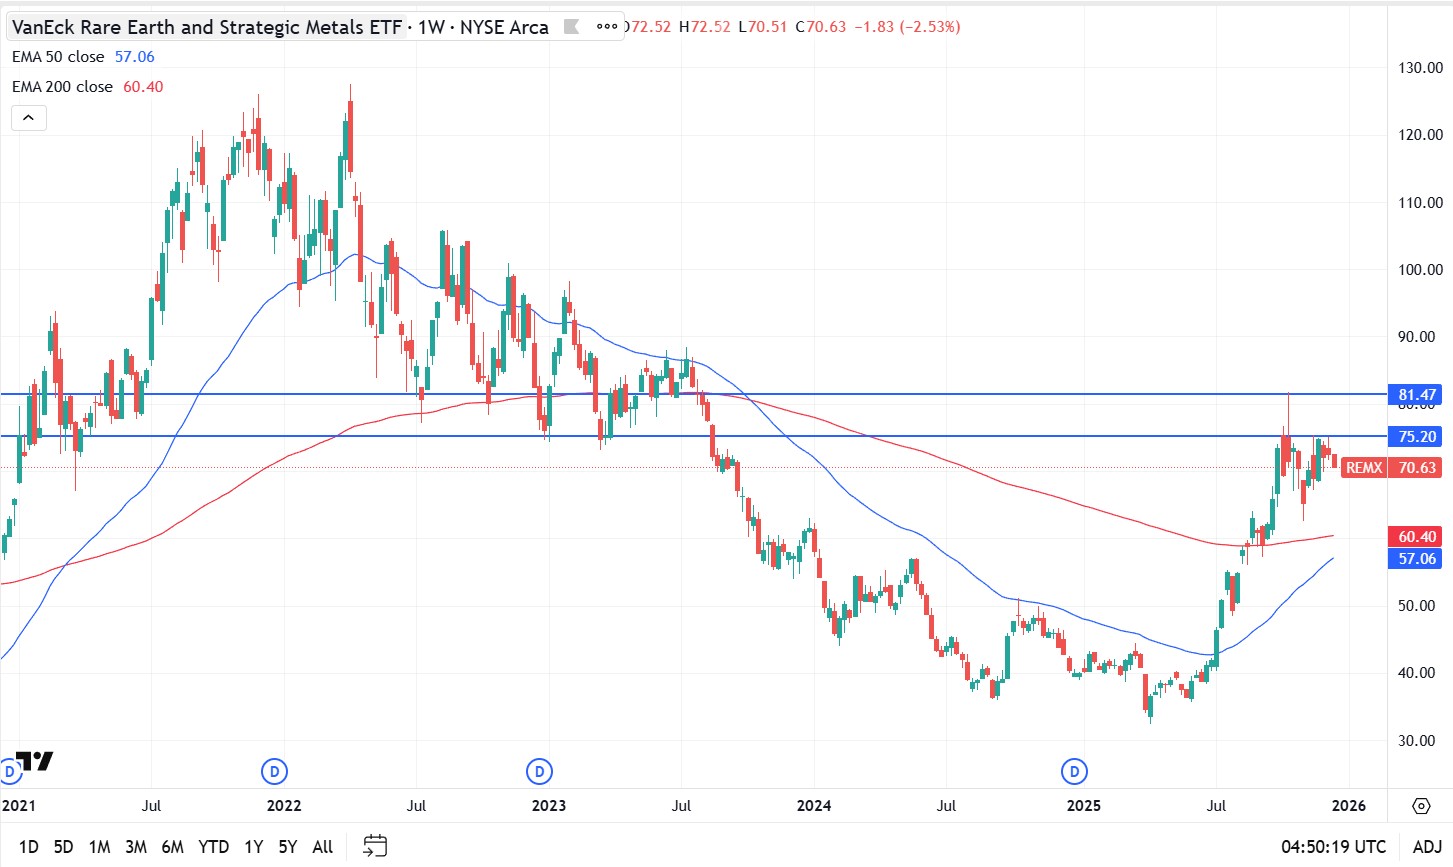
Price has repeatedly tested $75 over the past month without a confirmed breakout. The pattern of higher lows against flat resistance resembles an ascending triangle, often associated with building pressure; however, confirmation requires a decisive break.
REMX daily chart
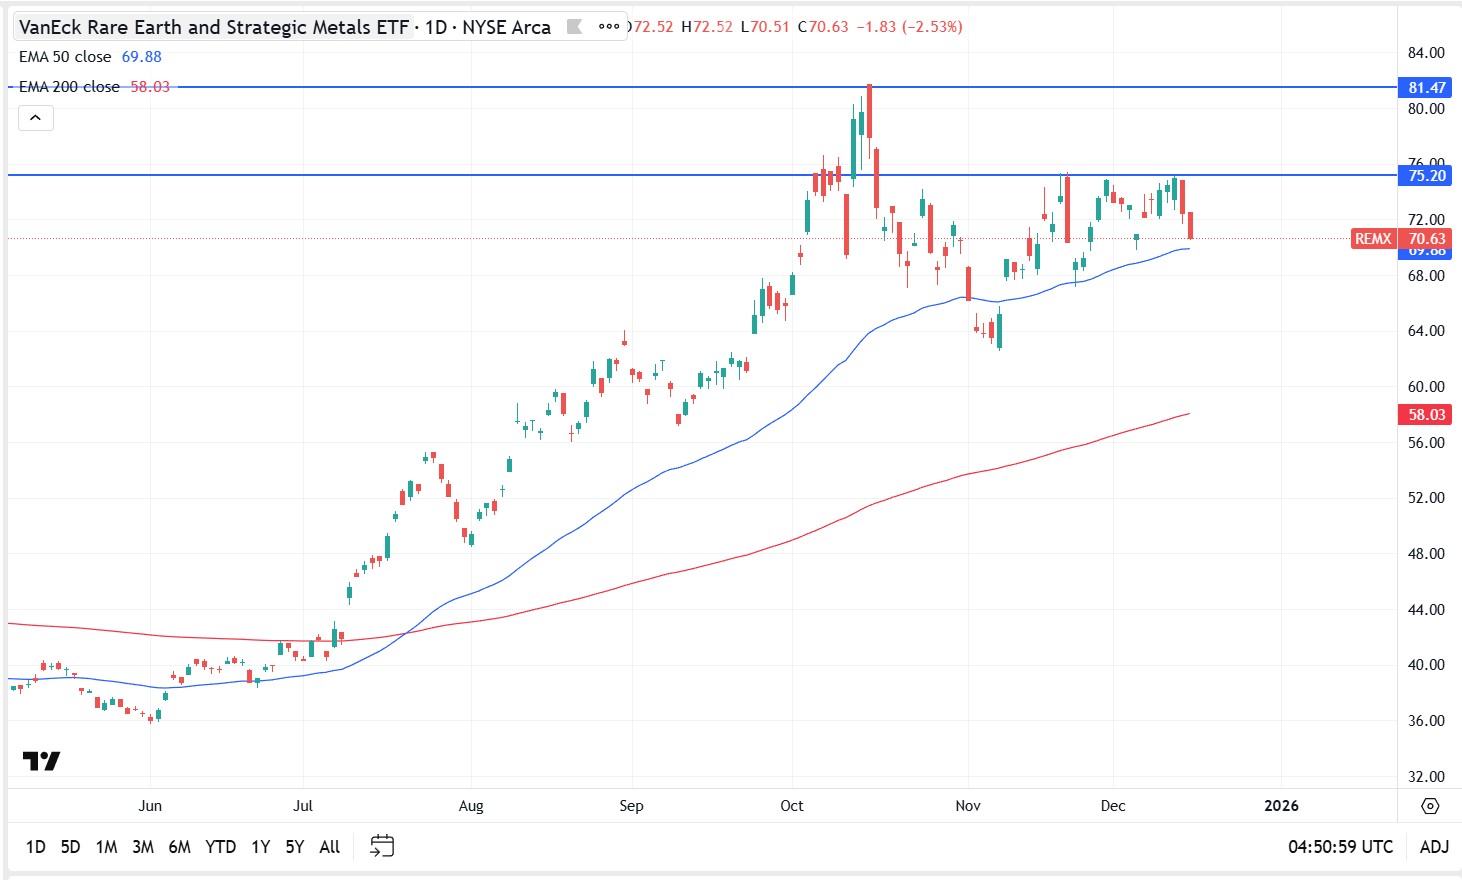
Scenarios to watch
- Bullish continuation: A daily close above $75 (ideally with expanding participation) would shift focus to $81 as the next resistance zone.
- Range continuation / pullback: Failure to clear $75 again keeps the risk of a retracement toward $68 support.
- Bearish breakdown: A sustained move below $68 would weaken the structure and raise the probability of a deeper mean reversion (next support levels should be mapped from prior swing lows).

The information provided is of general nature only and does not take into account your personal objectives, financial situations or needs. Before acting on any information provided, you should consider whether the information is suitable for you and your personal circumstances and if necessary, seek appropriate professional advice. All opinions, conclusions, forecasts or recommendations are reasonably held at the time of compilation but are subject to change without notice. Past performance is not an indication of future performance. Go Markets Pty Ltd, ABN 85 081 864 039, AFSL 254963 is a CFD issuer, and trading carries significant risks and is not suitable for everyone. You do not own or have any interest in the rights to the underlying assets. You should consider the appropriateness by reviewing our TMD, FSG, PDS and other CFD legal documents to ensure you understand the risks before you invest in CFDs.