Go further with GO Markets
Trade smarter with a trusted global broker. Low spreads, fast execution, powerful platforms, and award-winning customer support.
For beginners
Just getting
started?
Explore the basics and build your confidence.
For intermediate traders
Take your
strategy further
Access advanced tools for deeper insights than ever before.
Professionals
For professional
traders
Discover our dedicated offering for professionals and sophisticated investors.
Get started with GO Markets
Whether you’re new to markets or trading full time, GO Markets has an account tailored to your needs.

Trusted by traders worldwide
Since 2006, GO Markets has helped hundreds of thousands of traders to pursue their trading goals with confidence and precision, supported by robust regulation, client-first service, and award-winning education.


Explore more from GO Markets
CFD Markets
Trade CFDs across forex, indices, shares, commodities, metals, ETFs and more.
Platforms & tools
Trading accounts with seamless technology, award-winning client support, and easy access to flexible funding options.
Academy
Learn the skills, strategies, and mindset behind long-term trading success.
Accounts & pricing
Compare account types, view spreads, and choose the option that fits your goals.

Go further with
GO Markets.
Explore thousands of tradable opportunities with institutional-grade tools, seamless execution, and award winning support. Opening an account is quick and easy.
News & insights
Powerful tools for every trading style and preference.
%20(1)%20(1).jpg)
President Trump and President Xi have scheduled talks for later this week in South Korea, marking their first face-to-face meeting since Trump's return to office. After two weeks of heightened tension, a preliminary framework was established that effectively takes the threatened 100% tariffs off the table.
Treasury Secretary Scott Bessent characterised the framework agreement as being "very successful." This diplomatic progress has created some optimism across markets that the world's two largest economies can avoid the deeper trade conflict that was threatening to destabilise supply chains and accelerate inflation.
Copper Tests Key Resistance
Following a dramatic Q3 that saw prices surge to a record high of $5.81 in July, before plummeting to $4.37 by early August, copper has been steadily recovering as supply fundamentals reassert themselves.
Since breaking through $5.00 in early October, prices have continued to gain strength, rising to $5.11 on October 9. Today's gap higher on trade talk optimism pushed prices back to this key technical level that has proven resistant since March.
A confirmed breakout above $5.24 could open the door to $5.50 and potentially higher, making copper worth watching closely this week as both supply constraints and improving US-China trade relations provide potential tailwinds.
Fed Rate Decision This Week
The Federal Reserve will meet this Wednesday for the October 28-29 policy meeting, with a quarter-point rate cut seemingly fully priced in by markets. Market pricing indicates a 100% probability of an October cut and an 88% chance of another reduction in December.
The key moment will come after the meeting during Fed Chair Powell's press conference — particularly on what he has to say about future rate policy and how the Fed views the balance of risks between inflation and employment.
Market Insights
Watch the latest video from Mike Smith for the week ahead in markets.
Key economic events
Stay up to date with the key economic events for the week.


You have just identified a breakout above $50 resistance that historically wins 65% of the time — with a degree of confidence, you decide to take the trade.
Minutes later, the market starts to stall. Volume fades, price begins to hesitate, and eventually, your stop loss is hit, leaving you to wonder why your “65% setup” didn’t work.
The root cause of what happened is not your setup, but rather the fact that you assume that the probability of a specific trade outcome stays constant after entry.
This assumption locks you into a “static probability trap.”
There is a tendency to treat probability as frozen in time after entering a trade, when in practice it shifts continuously throughout the life of a trade as new evidence enters the market.
Even if this new evidence may not be particularly dramatic, it can still have profound implications for the likelihood of a continuation of current sentiment and price action.
Unconditional Probability: Your Pre-trade State.
What you can rely on as part of your pre-entry decision-making is unconditional probability.
This is your measured historical performance of a setup under similar conditions. It is your expected win rate and previous evidence of hitting a take-profit level.
The pre-trade belief that “This pattern works 60% of the time” is a backward-looking statement, and although based on some evidence, it shapes your belief about how this type of setup behaves on average.
However, as soon as you enter, the truth is that you are no longer dealing with a statistical average, but with this specific trade, unfolding before your eyes in this market environment, right now.
Conditional Probability: After You Enter
Once in the trade, your question becomes “Given what’s happening now with current price movement, volume, time, and volatility, what’s the probability of success?”
This live review of your pre-trade expectation is the conditional probability — your new probability estimate conditioned on the actual market response that is unfolding.
Each new candle, volume shift, or volatility change is new information, irrespective of the underlying cause, and information changes probability.
You are looking to see if:
- Trading volume is confirming or rejecting your entry expectations.
- If “time in the trade” supports further price moves in your favour or decay in market enthusiasm, evidenced in a drop in momentum.
- There are volatility changes that may be indicative of market sentiment accelerating or rejecting the initial move.
This is all about you recognising that some of these changes may result in adverse price moves. Having timely interventions that aim to protect capital and not donate much of your profit back to the market.
Emotional Resistance to Conditional Probability Thinking
As with many trading situations, there is a psychological component of decision-making that can get in the way.
Emotional “demons” that may influence this may briefly include the following:
- Anchoring: “I have done my analysis — it should work.”
- Sunk-Cost Bias: “I’m already in, I might as well wait and see what happens next.”
- Ego: Some may view that exiting means admitting they were wrong.
- Lack of knowledge: “I don’t know how to update probabilities or take appropriate actions.”
- FOMO (fear of missing out): “What if I exit and then runs in my favour?”
These biases keep traders fixed at entry from mental, emotional, and statistical perspectives.
Updating Probability in Real Time
When you boil it all down into absolute core principles, three critical factors dominate the “in the trade” probability landscape after trade entry.
1. Trading Volume — Conviction or Rejection
Volume is the purest signal of conviction. It shows the strength behind the move and how much belief the market has in your trade direction.
- High volume in your direction = strong confirmation; probability rises.
- Fading or below-average volume = weak conviction; probability erodes.
- High volume against you = rejection; probability collapses.
You can think of volume as your real-time market feedback gauge. It is the purest real-time evidence, in combination with price, of what other traders are thinking.
When price and volume disagree, this is a signal that the odds may (or already have) changed.
2. Time Elapsed — Pattern Decay
Every trade setup has a shelf life. A breakout that has not moved after a few candles can become statistically weaker than one that fired almost immediately.
The potential scenarios are:
- Quick follow-through: expected behaviour; your entry probability is likely to be intact.
- Extended stagnation: increasing probability decay due to trades losing confidence in the trade direction
- Delayed reversal: final evidence of pattern failure.
Each candle that passes without confirmation can be viewed as a ‘vote’ against your trade from the market.
This dissuades further trading interest in your desired direction, as opposed to when a market is enthused and buying seems to create ever-increasing interest as those who are fearful of missing out jump on board.
3. Volatility Regime — The Environment Shift
Volatility defines your market environment, and this environment can change fast.
- Volatility expansion in your favour confirms momentum; the probability of desirable and expected outcomes increases.
- Volatility expansion against you suggests a potential structural shift in the market, resulting in a fast drop in probability.
- Volatility contraction suggests market consolidation or exhaustion. This may be seen as a flattening of price action and a move from strongly directional to a more neutral price move.
Volatility regime shifts are a potential market indication that “the game when you entered is no longer the same.”
Putting It All into Practice: Your End-of-Candle Review
Managing conditional probability doesn’t mean reacting to every tick. It is formalising a systemised reassessment at defined intervals, often doing an “End-of-Candle Review”, on your chosen trading timeframe as a start point.
At the close of each bar on your trading timeframe, you need to pause and ask the following key questions:
- Has price behaved as expected?
- Yes → maintain or increase confidence.
- No → reduce exposure or prepare to exit.
- Is volume confirming or fading?
- Rising with direction → edge intact.
- Falling or reversing → edge weakening.
- Is volatility expanding or contracting?
- Expanding in your favour → stay the course.
- Contracting or reversing → reassess.
- Has too much time passed without progress?
- Yes → probability decay in play; consider exiting or scaling out.
- What’s the appropriate action?
- Hold, reduce, tighten, or exit — but always act in alignment with the evidence.
This simple routine keeps your decision-making informed by data, adaptable to market change, and unemotional.
None of the above is particularly ‘rocket science,’ but as with most things in your trading, it will require some work at the front end.
Measure the “what if” scenario against previous trades and comparatively measure your old way versus your new system over time to allow for confirmation of this as an approach, but also to allow refinement based on evidence.
Final thoughts
The probability of a trading outcome in a single trade is never static. It evolves with every candle, every shift in volume, and every minute of market time as new information is released.
It does require a mindset shift. As traders, we need to move from the standard “It’s a 65% setup, so I’ll hold.” To an approach that adopts the approach of “It was a 65% setup on entry, but what is the market evidence suggesting now?”
You are reacting to evolving information, and effective probability management becomes something beyond having one good trade (or avoiding a bad one) that compounds small improvement over hundreds of trades into measurable performance.

New U.S. Sanctions on Russia as Putin Conducts Nuclear Tests
The U.S. has imposed new sanctions on Russia's two largest oil companies, Rosneft and Lukoil, after planned peace talks between Trump and Putin collapsed on Wednesday.
Oil prices spiked 3% after the announcement, with Brent crude hitting $64 per barrel.
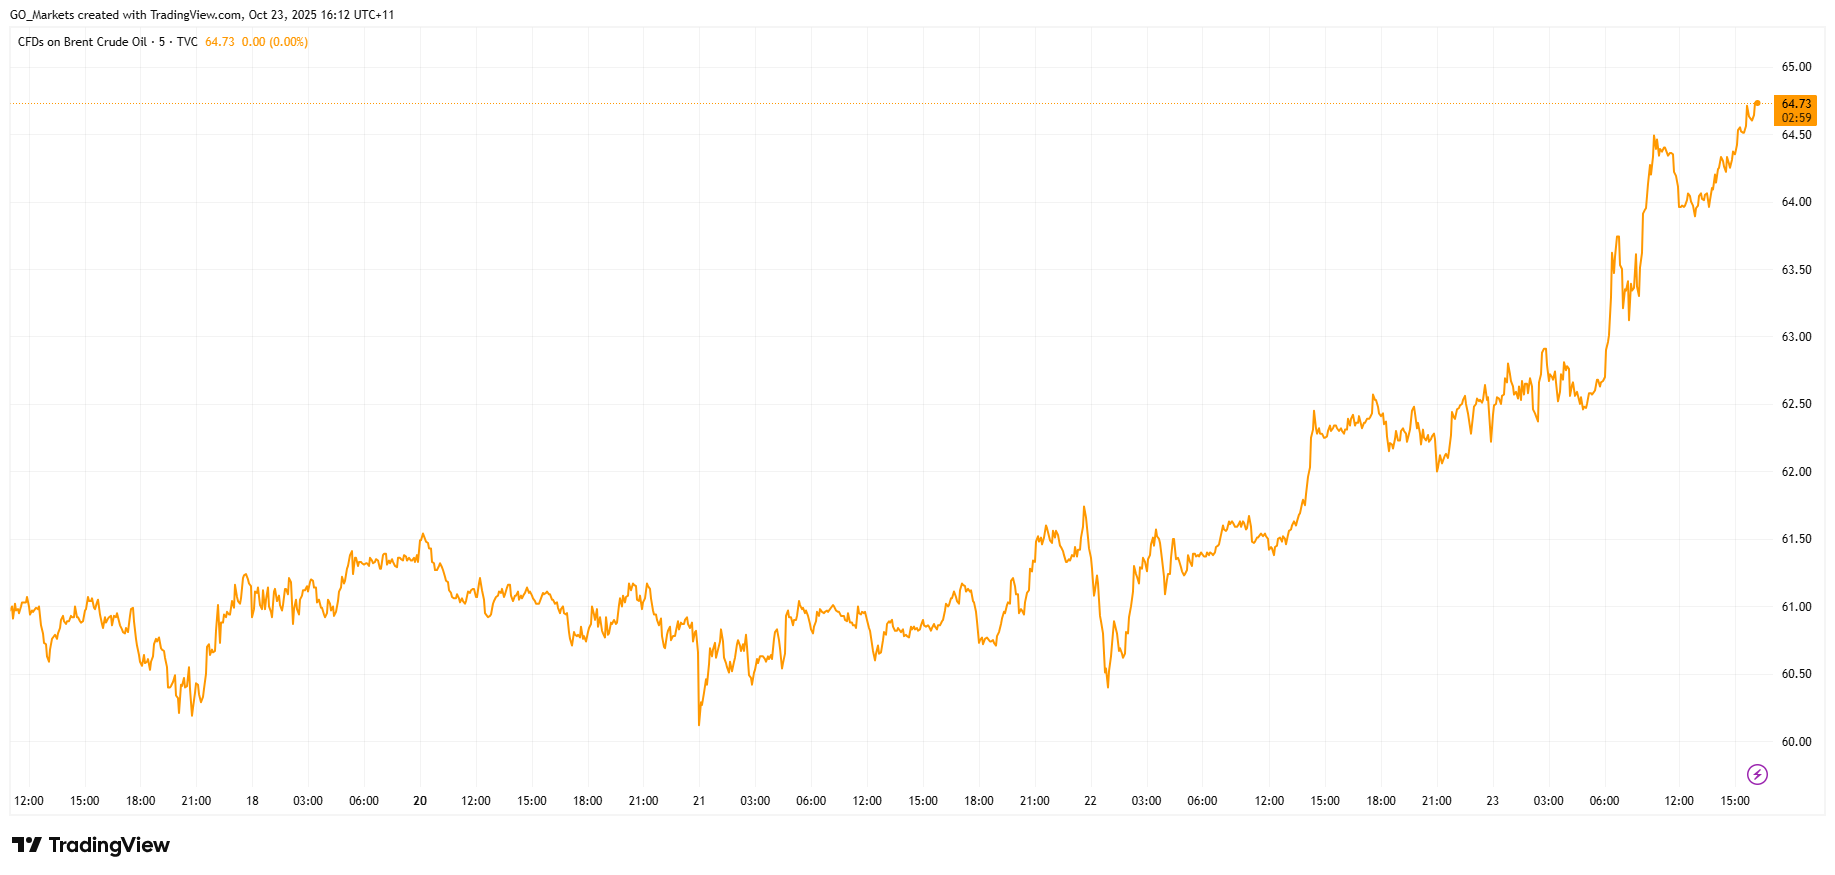
The targeted companies are among the world's largest energy exporters, collectively shipping about three million barrels of oil daily and accounting for nearly half of Russian production.
The sanctions build on recent European measures, as the UK targeted the same companies last week and the EU approved its own sanctions package on Wednesday.
In a show of force coinciding with the new sanctions, Putin supervised strategic nuclear exercises on Wednesday involving intercontinental ballistic missile launches from land and submarine platforms.
While the Kremlin emphasised these were routine drills, the highly coincidental timing is notable.
For markets, the key question now is whether secondary sanctions will follow, and if Trump’s enforcement remains strict. Traders will watch closely for any TACO signals that see Trump ease pressure in an attempt to restart negotiations.
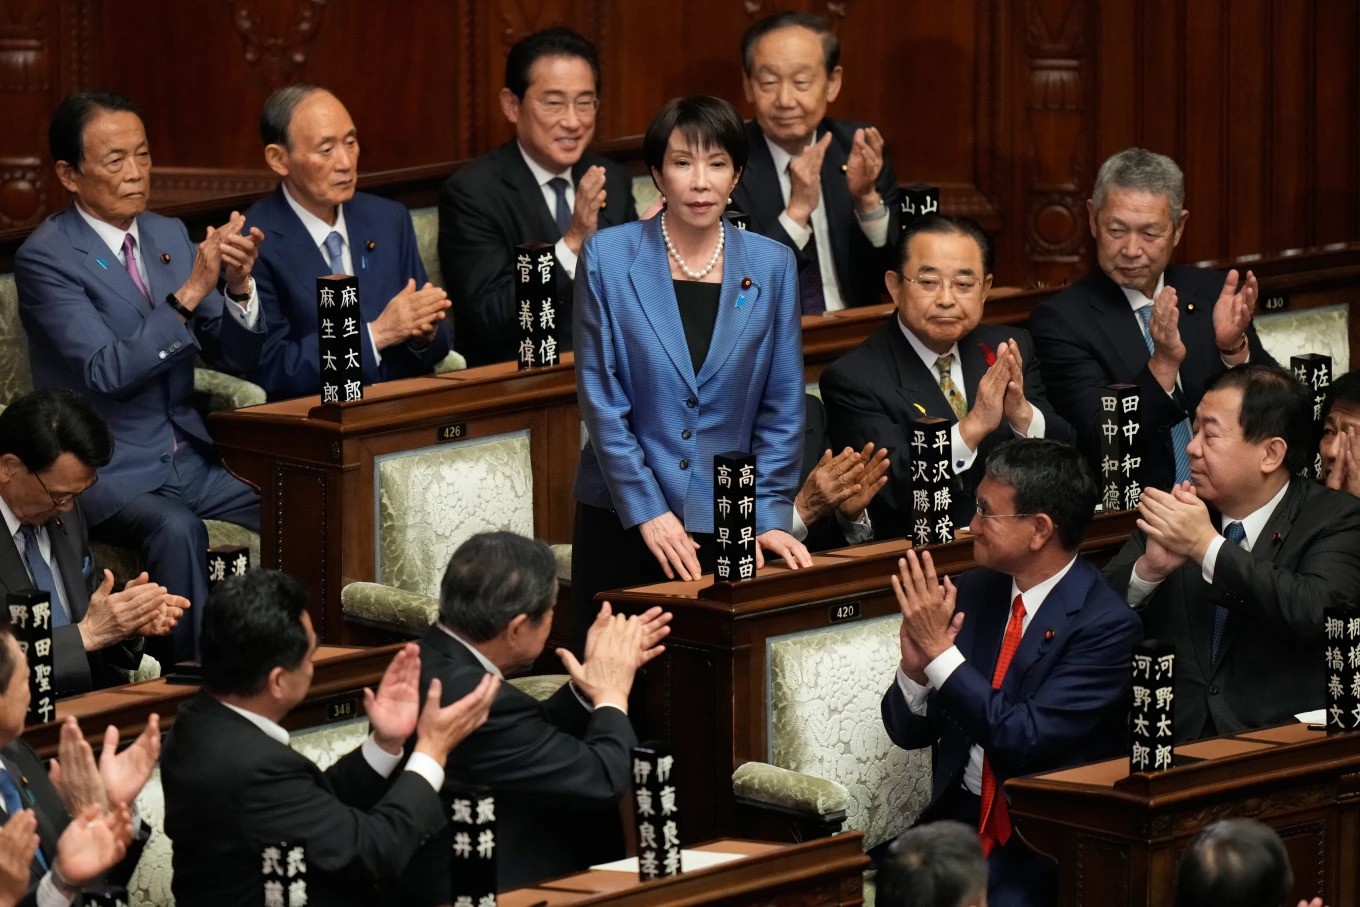
Historic PM Wasting No Time on Celebrations
Sanae Takaichi made history this week as Japan's first female Prime Minister. The 64-year-old conservative leader, dubbed the "Iron Lady,” is already rolling out an aggressive policy agenda that could reshape Japan's economic and geopolitical position.
Her first major move is an economic stimulus package expected to exceed US $92 billion. The package includes abolishing the provisional gasoline tax and raising the tax-free income threshold from ¥1.03 million ($6,800), moves designed to put more money in consumers' pockets and battle inflation.
Her next move will come when Trump arrives in Tokyo next week, as the Japanese government is finalising a purchase package including Ford F-150 pickup trucks, US soybeans, and liquefied natural gas as sweeteners for trade talks.
Takaichi has campaigned on being a champion for expansionary fiscal policy, monetary easing, and heavy government investment in strategic sectors, including AI, semiconductors, biotechnology, and defence.
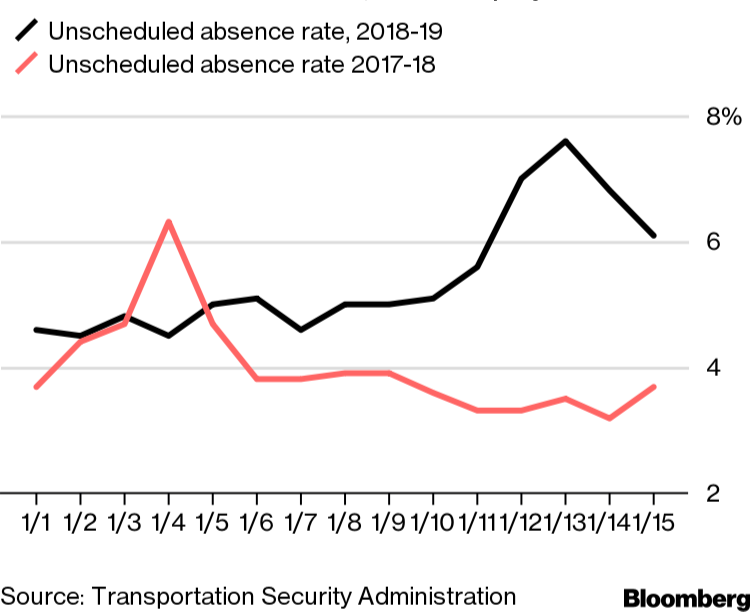
Critical Workers to Miss First Paycheck Due to Shutdown
The U.S. government shutdown is on the verge of creating a crisis for aviation safety, with 60,000 workers set to miss their first full paycheck this week.
These essential workers, who earn an average of $40,000 annually, already saw shortened paychecks last week. By Thursday, many will receive pay stubs showing zero compensation for the coming period, forcing impossible choices between basic necessities and reporting to work.
During the last extended shutdown, TSA sick-call rates tripled by Day 31, causing major delays at checkpoints and reduced air traffic in major hubs like New York — disruptions which are directly attributed to pressuring the end of the previous shutdown.
The National Air Traffic Controllers Association warns that similar pressures are building, with many workers soon to be facing a decision between attending their shift or putting food on the table.