Go further with GO Markets
Trade smarter with a trusted global broker. Low spreads, fast execution, powerful platforms, and award-winning customer support.
For beginners
Just getting
started?
Explore the basics and build your confidence.
For intermediate traders
Take your
strategy further
Access advanced tools for deeper insights than ever before.
Professionals
For professional
traders
Discover our dedicated offering for professionals and sophisticated investors.


Trusted by traders worldwide
Since 2006, GO Markets has helped hundreds of thousands of traders to pursue their trading goals with confidence and precision, supported by robust regulation, client-first service, and award-winning education.


Explore more from GO Markets
Platforms & tools
Trading accounts with seamless technology, award-winning client support, and easy access to flexible funding options.
Accounts & pricing
Compare account types, view spreads, and choose the option that fits your goals.
Go further with
GO Markets.
Explore thousands of tradable opportunities with institutional-grade tools, seamless execution, and award winning support. Opening an account is quick and easy.


Go further with
GO Markets.
Explore thousands of tradable opportunities with institutional-grade tools, seamless execution, and award winning support. Opening an account is quick and easy.

The Australian Securities Exchange (ASX) is one of the world's top 20 exchanges, hosting over 2,000 listed companies worth approximately $2 trillion.
Quick Facts:
- The ASX operates as Australia's primary stock exchange, combining market trading, clearinghouse operations, and trade and payment settlement.
- It represents roughly 80% of the Australian equity market value through its flagship ASX 200 index.
- 2,000+ companies and 300+ ETFs are listed on the exchange, spanning from mining giants to tech innovators.
How does the ASX work?
The ASX combines three critical functions in one system.
As a market operator, it provides the electronic platform where buyers and sellers meet. Trading occurs through a sophisticated computer system that matches orders in milliseconds, replacing the traditional floor-based trading that once defined stock exchanges globally.
The exchange also acts as a clearinghouse, ensuring trades settle correctly. When you buy shares, the ASX guarantees the transaction completes, managing the transfer of securities and funds between parties.
Finally, it serves as a payments facilitator, processing the money flows that accompany each trade. This integrated approach reduces settlement risk and keeps the market running smoothly.
What are ASX trading hours?
The ASX operates from 10:00am to 4:00pm Sydney time (AEST/AEDT) on business days, with a pre-open phase from 7:00am.
Stocks open alphabetically in staggered intervals starting at 10:00am, followed by continuous trading until the closing auction at 4:00pm.
The exchange observes Australian public holidays and adjusts for daylight saving time between October and April, which can affect coordination with international markets.
| Phase | Sydney (AEST) | Tokyo (JST) | London (BST) | New York (EDT) |
|---|---|---|---|---|
| Pre-Open | 7:00am - 10:00am | 6:00am - 9:00am | 10:00pm - 1:00am | 5:00pm - 8:00pm* |
| Normal Trading | 10:00am - 4:00pm | 9:00am - 3:00pm | 1:00am - 7:00am | 8:00pm - 2:00am* |
| Closing Auction | 4:00pm - 4:10pm | 3:00pm - 3:10pm | 7:00am - 7:10am | 2:00am - 2:10am |
Top ASX Indices
S&P/ASX 200
This is the exchange's flagship index. It tracks the 200 largest companies by market capitalisation and represents approximately 80% of Australia's equity market.
It serves as the primary benchmark for most investors and fund managers and is rebalanced quarterly to ensure it reflects the current market leaders.
All Ordinaries Index
Commonly called the All Ords, this index covers the top 500 companies on the ASX.
It provides broader market exposure than the S&P/ASX 200, capturing roughly 80-90% of total market value.
The 11 ASX sectors
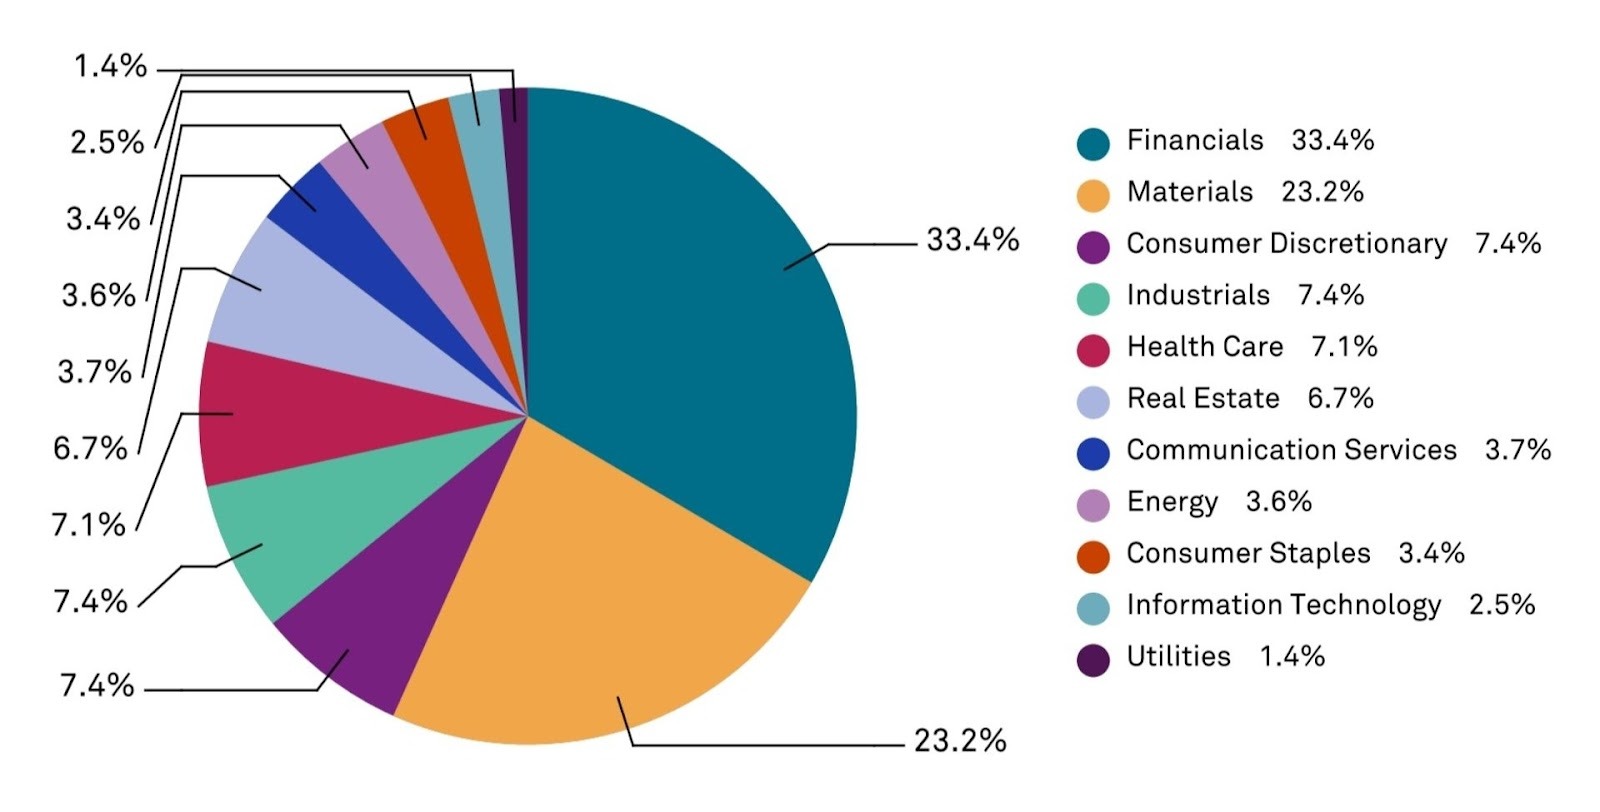
The ASX also breaks down into 11 sector-specific indices, allowing investors to track performance in areas like financials, materials, healthcare, and technology.
These indices can help identify which parts of the Australian economy are strengthening or weakening.

- Financials dominates as the largest sector, driven by Commonwealth Bank, NAB, Westpac, and ANZ. These banking giants provide lending, wealth management, and insurance services across Australia.
- Materials ranks second, led by mining powerhouses BHP and Rio Tinto. This sector extracts and processes resources, including iron ore, coal, copper, and gold.
- Consumer Discretionary includes retailers, media companies, and hospitality groups that benefit when household spending rises.
- Industrials encompasses construction firms, airlines, and professional services businesses.
- Healthcare features companies like CSL, a global biotech leader, and Cochlear, which produces hearing implants.
- Real Estate features property developers and Real Estate Investment Trusts (REITs) that own and manage commercial and residential assets.
- Communication Services includes telecommunications providers like Telstra alongside media and entertainment companies.
- Energy tracks oil and gas producers (many renewable energy companies typically fall under utilities).
- Consumer Staples covers essential goods providers like supermarkets and food producers.
- Information Technology includes software developers and IT services firms.
- Utilities covers electricity, gas, and water suppliers, including renewable energy.
| ASX Symbol | Sector | Top Stocks | % of ASX 200 |
|---|---|---|---|
| XFJ | Financials | CBA, NAB, ANZ | 33.4% |
| XMJ | Materials | Orica, Amcor, BHP | 23.2% |
| XDJ | Consumer Discretionary | Harvey Norman, Crown | 7.4% |
| XNJ | Industrials | Qantas, Transurban | 7.4% |
| XHJ | Health Care | ResMed, CSL and Cochlear | 7.1% |
| XRE | Real Estate | Mirvac, LendLease, Westfield | 6.7% |
| XTJXIJ | Communication Services | Telstra, Airtasker | 3.7% |
| XEJ | Energy | Santos, Woodside | 3.6% |
| XSJ | Consumer Staples | Woolworths, Westfarmers | 3.4% |
| XIJ | Information Technology | Dicker Data, Xero | 2.5% |
| XUJ | Utilities | AGL, APA Group | 1.4% |
Top ASX companies
Three companies consistently lead the S&P/ASX 200 by market capitalisation.
Commonwealth Bank (Mkt cap: A$259 bln)
Commonwealth Bank holds the top position on the ASX as Australia's biggest lender.
Founded in 1911 and fully privatised by 1996, CBA offers retail banking, business lending, wealth management, and insurance.
Its performance often signals the health of the domestic economy.
BHP Group (Mkt cap: A$241 bln)
BHP Group stands as the world's largest mining company.
Its diversified portfolio spans iron ore, copper, coal, and nickel operations globally.
It serves as a bellwether for Australian commodity markets.
CSL Limited (Mkt cap: A$182 bln)
CSL Limited leads the Australian healthcare sector as a global biotech firm.
Established in 1916, CSL develops treatments for rare diseases and manufactures influenza vaccines.
The company demonstrates Australian innovation competing on the world stage.
ASX top 20 companies:
The ASX's role in Australia's economy
The ASX serves as a vital mechanism for capital formation in Australia. It tends to provide price signals that reflect market expectations.
When share prices rise, it suggests optimism about economic conditions. Falling markets may indicate concerns about future growth.
Australian companies raise funds through initial public offerings and follow-on share sales on the ASX, using proceeds to expand operations, fund research, or pay down debt.
Investors in these shares benefit from potential capital gains and dividend income. Many Australians build retirement savings through superannuation funds that invest heavily in ASX-listed companies.
Employment in financial services also depends partly on a healthy stock market. Brokers, analysts, fund managers, and supporting roles exist because of active capital markets.
Key takeaways
The ASX functions as a market operator, clearinghouse, and payments facilitator, providing the infrastructure that enables capital formation and supports retirement savings for millions of Australians.
Its flagship index, the S&P/ASX 200, tracks the 200 largest companies and captures about 80% of market capitalisation, while the All Ordinaries index covers the top 500.
Financials and Materials dominate the exchange, led by Commonwealth Bank, BHP, and CSL, reflecting Australia's strength in banking and resources.
You can trade the S&P/ASX 200 Index CFD and over 230 ASX Share CFDs on GO Markets.

As geopolitical narratives continue to simmer, US and European markets move into the rest of the week with three dominant drivers: US inflation data, the start of US earnings season, and an unusual Fed-independence headline risk after the DOJ subpoenaed the Federal Reserve.
Quick facts:
- US consumer price index (CPI) and producer price index (PPI) are the key macro releases and are likely to impact the US dollar (USD) and other asset classes if there is a significant move from expectations.
- JPMorgan reports Tuesday, with other major US banks through the week, as the Q4 reporting season gets underway.
- Reporting around DOJ action involving the Fed, and Chair Powell’s prior testimony, created early market volatility on Monday, with markets sensitive to anything that may be perceived as undermining Fed independence.
- President Trump announced this morning that any country doing business with Iran will face a 25% tariff on all business with the US, effective immediately.
- Europe’s production and growth updates, including Eurozone industrial production and UK monthly GDP and trade data, are later in the week.
United States: CPI, Fed path, DOJ and Fed headline risk, and banks leading earnings
What to watch:
The US is carrying the highest event density in global data releases this week. CPI and PPI will both be watched for moves away from expectations.
Any meaningful surprise can shift Fed policy expectations. Markets are currently pricing a lower likelihood of a March rate cut (under 30%) than this time last week, based on fed funds futures probabilities tracked by CME FedWatch.
Bank earnings may set the tone for the reporting season as a whole. Forward guidance is likely to be as important as Q4 performance, with valuations thought to be high after another record close in the S&P 500 overnight.
Key releases and events:
- Tue 13 Jan (Wed am AEDT): CPI (Dec) (high sensitivity)
- Tue 13 Jan (Wed am AEDT): JPMorgan earnings before market open (high sensitivity for banks and risk tone)
- Wed to Thu: additional large-bank earnings cluster (high sensitivity for financials sentiment)
- Wed 14 Jan (Thu am AEDT): US PPI
- Thu 15 Jan (Fri am AEDT): US weekly unemployment
- Throughout the week: Fed member speeches
How markets may respond:
S&P 500 and US risk tone: US indices are near record levels. The S&P 500 closed at 6,977.27 on Monday. Hotter-than-expected inflation can pressure growth and small-cap equities in particular, and weigh on the market broadly. Softer inflation can support further risk-on behaviour.
USD: Inflation data is the obvious driver this week for the greenback, but any continuation of DOJ and Fed developments, or geopolitical escalation, may introduce additional USD influences.
With the USD testing the highest levels seen in a month, followed by some light selling yesterday, some volatility looks likely. Gold has also been bid as a potential safety trade and hit fresh highs in the latest session, suggesting demand for defensive exposure remains present.
Earnings (banks): In a market already priced near highs, results can still create volatility if they are not accompanied by supportive earnings per share (EPS), revenue and forward guidance. Financials will likely see the first-order response, but any early pattern in results and guidance can influence the broader market beyond the first few days.
UK and Eurozone: growth data influence amid continuing equity strength
What to watch:
In a week where Europe may be driven primarily by events in the US and geopolitical narrative, the Eurozone industrial production print is still a noteworthy local release.
In the UK, monthly GDP and trade numbers on Thursday may influence both the FTSE 100 and the pound, particularly if there is any meaningful surprise.
Key releases and events:
Eurozone
- Wed 14 Jan: Eurozone industrial production (Nov 2025) (medium sensitivity for cyclical sectors)
UK
- Thu 15 Jan: GDP monthly estimate (Nov 2025) (high sensitivity for GBP and UK rate expectations)
- Thu 15 Jan: UK trade (Nov 2025) (low to medium sensitivity)
How markets may respond:
EUR spillover from the US: Despite light Eurozone data, the US response is likely to matter most this week, with the US dollar index a major driver of broader G10 FX direction.
DAX (DE40): Germany’s index is also trading at or near record levels and closed at 25,405 on Monday. (2) If the index is extended, it may react more to global rate moves and shifts in perceived risk.
FTSE 100 and GBP: The FTSE hit a new high in the overnight session, driven particularly by materials and mining stocks. (5) Any GDP surprise can re-price GBP and UK equities quickly in an environment where growth concerns persist.
US and Europe calendar summary (AEDT)
- Wed 14 Jan: US CPI, US bank earnings kick-off (notably JPMorgan)
- Wed 14 Jan: Eurozone industrial production (Nov 2025)
- Thu 15 Jan: UK monthly GDP (Nov 2025) and UK trade (Nov 2025), US bank earnings continue
- Fri 16 Jan: US weekly unemployment, US bank earnings continue
Bottom line
- If US CPI surprises higher, markets may lean toward higher-for-longer interest rate pricing, which can pressure equity multiples and lift rates volatility.
- If bank earnings are solid but guidance is cautious, equities can still see two-way swings given index levels near records and high valuations.
- If DOJ and Fed headlines escalate, they may override normal data reactions to some degree. That could increase demand for perceived safe havens such as gold and lift FX volatility.
- For Europe, Eurozone production (Wed) and UK GDP and trade (Thu) are the key local data. The region is still likely to trade primarily off US outcomes and broader risk sentiment.

Asia-Pacific markets start the week with sentiment shaped by China’s mid-week trade data, USDJPY (USD/JPY) as Japan’s key volatility channel, and offshore reporting influencing Australian equities. With a light domestic data calendar, global events may do most of the work on risk appetite.
Quick facts:
- China's mid-week trade data is the primary regional risk event, with imports monitored for signs of domestic demand stability.
- USD/JPY remains the key volatility channel, which may influence Nikkei performance.
- Australian equities lack major domestic catalysts, leaving the ASX and AUD direction sensitive to China outcomes, geopolitics and US bank earnings.
This week’s Asia-Pacific focus is less about local policy and more about the transmission channels that typically set the tone.
For China, trade data may shape the growth narrative.
For Japan, the USD/JPY direction may influence equity momentum.
For Australia, offshore earnings, commodities and geopolitics may dominate in the absence of major domestic catalysts.
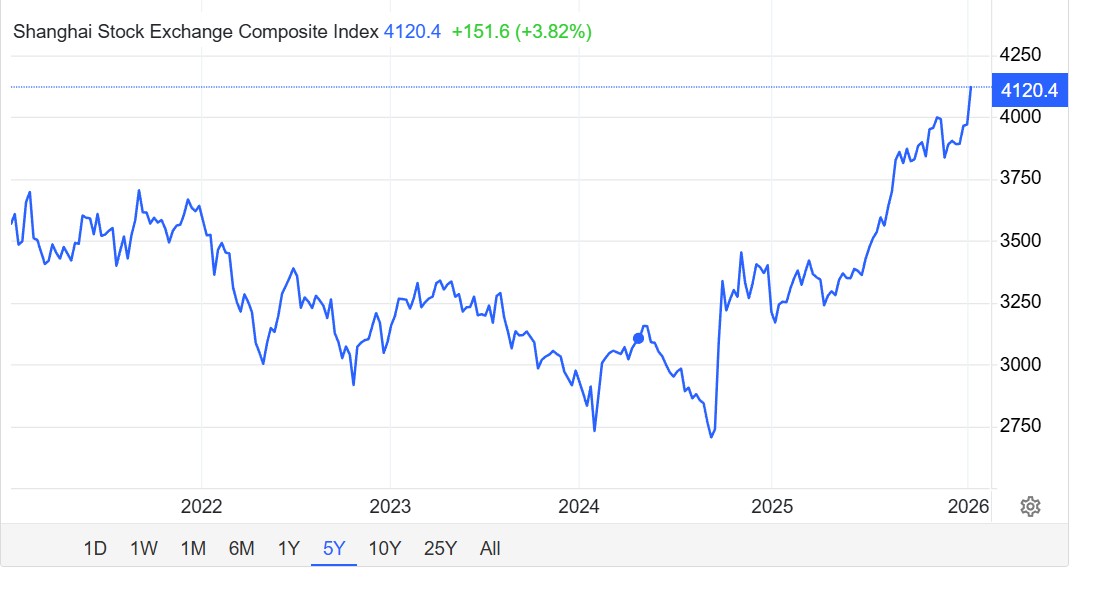
China: Shanghai may be influenced by trade data
What to watch:
With mid-week Chinese trade data, markets may view the release as a gauge of whether policy support is translating into growth activity or slowing any downturn.
Key release:
- Wed 14 Jan: Trade balance, exports and imports (December) (high sensitivity)
How markets may respond:
Shanghai Composite: Stronger trade data could support sentiment, though the quality and perceived longevity of any improvement may matter. Weak imports would likely be read as continued softness in domestic demand.
Australia (resources and AUD): China trade and credit tone can feed directly into bulk commodity expectations and regional risk appetite, with potential flow-through to ASX miners and AUDUSD (AUD/USD).

Japan: FX sensitivity remains the key factor
What to watch:
With no major policy decision scheduled, and the producer price index (PPI) the main data point, Japan’s influence this week may run primarily through USD/JPY moves after US data releases, and broader geopolitical headlines, particularly as markets reopen after Monday’s public holiday.
Key releases:
- Wed 14 Jan: Preliminary machine tool orders, year on year (y/y) (low sensitivity)
- Thu 15 Jan: PPI (medium sensitivity)
How markets may respond:
USD/JPY: The pair ended last week around 158, near recent highs. Moves can be volatile; markets will watch whether the pair holds recent strength or retraces, particularly around prior trading ranges.
Nikkei 225: The index hit a record high early last week before a modest two-day pullback, then closed higher on Friday. Equity momentum, often closely tied to FX stability, may be influenced by the strength or otherwise of USD/JPY.
Australia: offshore drivers dominate in a lighter data week
What to watch:
In the absence of significant domestic data releases, Australian markets may be more exposed to external influences. The main themes are China trade data, geopolitics, commodity prices and the start of the US earnings season, with banks in focus.
Key releases:
- Tue 13 Jan: Westpac consumer sentiment (low sensitivity)
- Thu 15 Jan: Melbourne Institute (MI) inflation expectations (low sensitivity)
How markets may respond:
ASX 200: The index has been consolidating around the 8,700–8,800 area (approx.). Local financial stocks may react to inferences made from US bank earnings. Stocks such as Macquarie Group are typically more sensitive to global market conditions and activity in investment markets, often drawing comparisons with US peers such as JPMorgan Chase (JPM).
AUDUSD (AUD/USD): AUD/USD has pulled back after last week’s gains and is trading near recent highs. Technical commentary is mixed, and price action can change quickly around major offshore events.
Other Asia-Pacific events
South Korea is expecting an interest rate decision on Thursday. Any deviation from market expectations for no change (currently 2.5% per Trading Economics) could create a minor FX ripple in regional currency pairs.
Asia-Pacific calendar:
- Mon 12 Jan: Japan public holiday
- Tue 13 Jan: Australia consumer sentiment
- Wed 14 Jan: China trade balance, exports and imports
- Thu 15 Jan: Bank of Korea rate decision; Japan PPI; Australia inflation expectations
Bottom line
- If China trade and credit data stabilise, regional equities may move higher, with AUD and ASX resource stocks among the key sensitivity points.
- If USD/JPY extends higher, the Nikkei may remain supported near highs, though FX volatility risk may increase.
- If US bank earnings disappoint, ASX financials could face near-term pressure despite limited domestic data.
- Information is accurate as at 23:00 AEDT on 11 January 2026. Economic calendar events, charts and market price data are sourced from TradingView.

