Most traders understand EA portfolio balance through the lens of traditional risk management — controlling position sizes, diversifying currency pairs, or limiting exposure per trade.
But in automated trading, balance is about deliberately constructing a portfolio where different strategies complement each other, measuring their collective performance, and actively managing the mix based on those measurements.
The goal is to create a “book” of EAs that can help diversify performance over time, even when individual strategies hit rough patches.
A diversified mix of EAs across timeframes and assets can, in some cases, reduce reliance on any single strategy. This approach reduces dependency on any single EA’s performance, smooths your overall equity curve, and builds resilience across changing market conditions.
It’s about running the right mix, identifying gaps in your coverage, and viewing your automated trading operation as an integrated whole rather than a collection of independent systems.
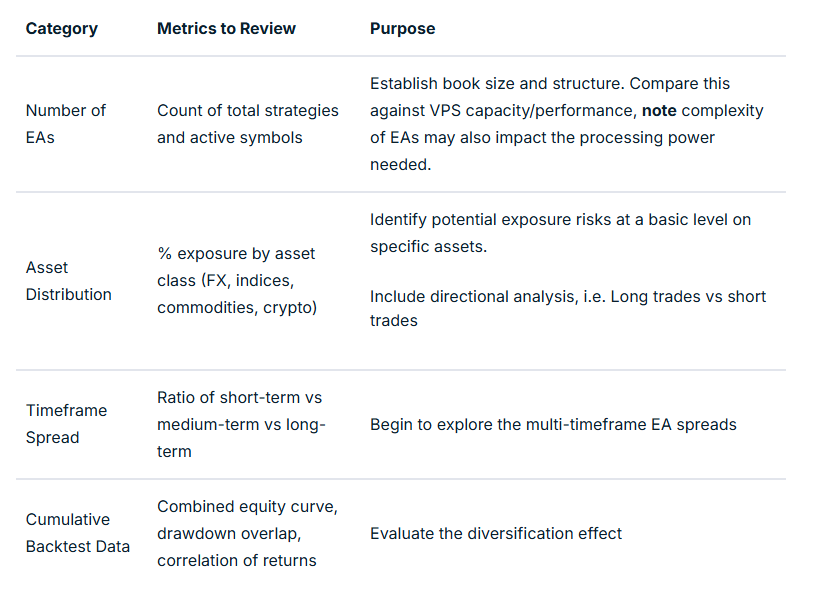
Basic Evaluation Metrics – Your Start Point
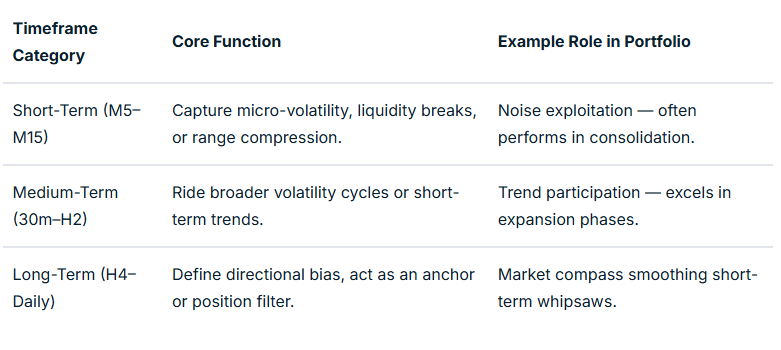
Temporal (timeframe) Balancing
When combined, a timeframe balance (even on the same model and instrument) can help flatten equity swings.
For example, a losing phase in a fast-acting M15 EA can often coincide with a profitable run in an H4 trend model.
Combining this with some market regime and sessional analysis can be beneficial.
Asset Balance: Managing Systemic Correlation Risk
Running five different EAs on USDJPY might feel diversified if each uses different entry logic, even though they share the same systemic market driver.
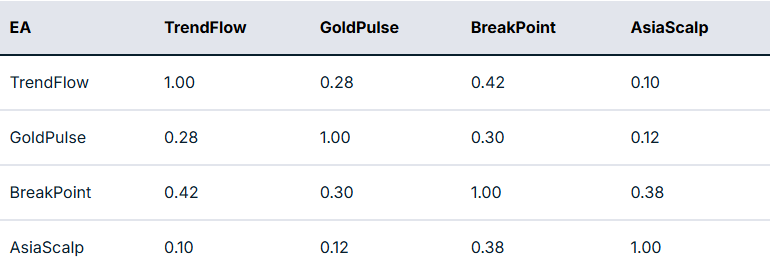
But in an EA context, correlation measurement is not necessarily between prices, but between EA returns (equity changes) relating to specific strategies in specific market conditions.
Two EAs on the same symbol might use completely different logic and thus have near-zero correlation.
Conversely, two EAs on a different symbol may feel as though they should offer some balance, but if highly correlated in specific market conditions may not achieve your balancing aim.
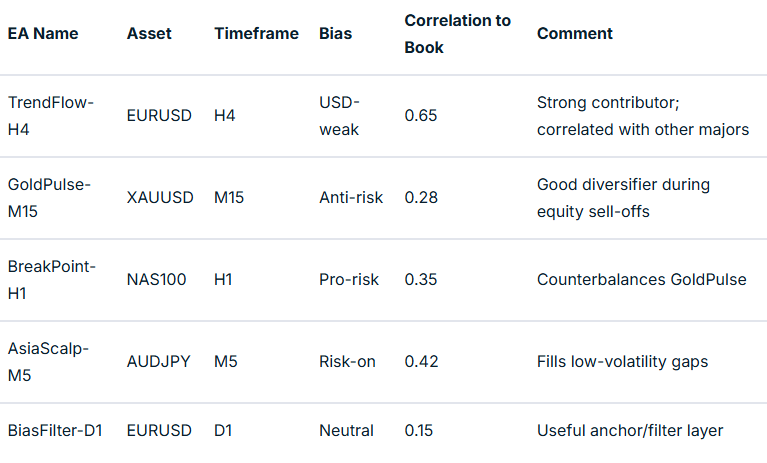
In practical terms, the next step is to take this measurement and map it to potential actionable interventions.
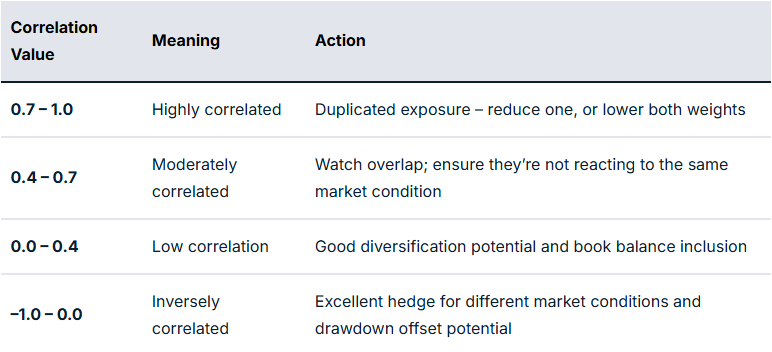
For example, if you have a EURUSD Trend EA and a GBPUSD Breakout EA with a correlation of 0.85, they are behaving like twins in performance related to specific market circumstances. And so you may want to limit exposure to some degree if you are finding that there are many relationships like this.
However, if your gold mean reversion EA correlates 0.25 compared to the rest of your book, this may offer some balance through reducing portfolio drawdown overlap.
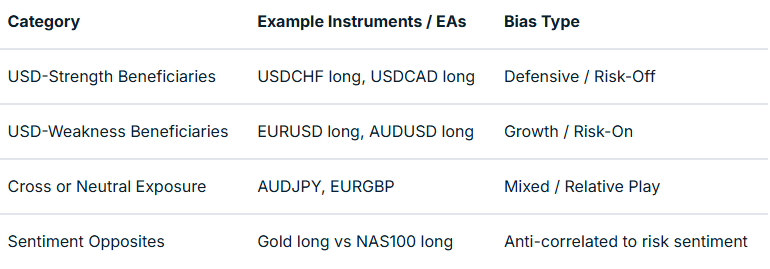
Directional and Sentiment Balance
Markets are commonly described as risk-on or risk-off. This bias at any particular time is very likely to impact EA performance, dependent on how well balanced you are to deal with each scenario.
You may have heard the old market cliché of “up the staircase and down the elevator shaft” to describe how prices may move in alternative directions. It does appear that optimisation for each direction, rather than EAs that trade long and short, may offer better outcomes as two separate EAs rather than one catch-all.
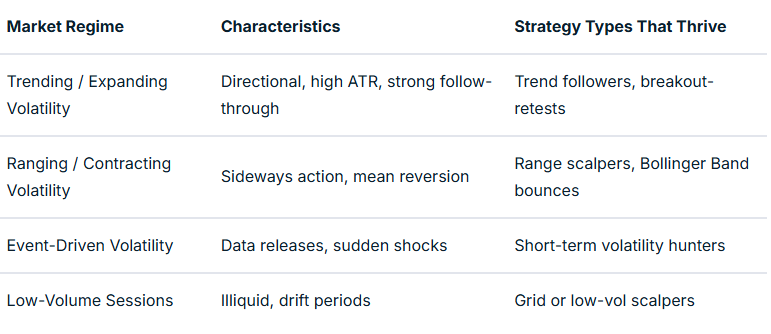
Market Regime and Volatility Balance
Trend and volatility states can have a profound impact on price action, whether as part of a discretionary or EA trading system. Much of this has a direct relationship to time of day, including the nature of individual sessions.
We have a market regime filter that incorporates trend and volatility factors in many EAs to account for this. This can be mapped and tested on a backtest and in a live environment to give evidence of strategy suitability for specific market conditions.
For example, mean reversion strategies may work well in the Asian session but less so in strongly trending markets and the higher volatility of the early part of the US session.
As part of balancing, you are asking questions as to whether you actually have EA strategies suited to different market regimes in place, or are you using these together to optimise book performance?
The table below summarises such an approach of regime vs market mapping:
Multi-Level Analysis: From Composition to Interaction
Once your book is structured, the challenge is to turn it into something workable. An additional layer of refinement that turns theory and measurement into something meaningful in action is where any difference will be made.
This “closing the circle” is based on evidence and a true understanding of how your EAs are behaving together. It is the step that takes you to the point where automation can begin to move to the next level.
Mapping relationships with robust and detailed performance evaluation will take time to provide evidence that these are actually making a difference in meeting balancing aims.
To really excel, you should have systems in place that allow ongoing evaluation of the approaches you are using and advise of refinements that may improve things over time.
What Next? – Implementing Balance in Practice
Theory must ultimately translate into an executable EA book. A plan of action with landmarks to show progress and maintain motivation is crucial in this approach.
Defining classification tags, setting risk weights, and building monitoring dashboards are all worth consideration.
Advanced EA traders could also consider a supervisory ‘Sentinel’ EA, or ‘mothership’ approach, to enable or disable EAs dynamically based on underlying market metrics and external information integrated into EA coding decision-making.
Final Thoughts
A balanced EA portfolio is not generated by accident; it is well-thought-out, evidence-based and a continuously developing architecture. It is designed to offer improved risk management across your EA portfolio and improved trading outcomes.
Your process begins with mapping your existing strategies by number, asset, and timeframe, then expands into analysing correlations, directional bias, and volatility regimes.
When you reach the stage where one EA’s drawdown is another’s opportunity, you are no longer simply trading models but managing a system of EA systems. To finish, ask yourself the question, “Could this approach contribute to improved outcomes over time?”. If your answer is “yes,” then your mission is clear.
If you are interested in learning more about adding EAs to your trading toolbox, join the new GO EA Programme (coming soon) by contacting [email protected].
By
Mike Smith
Mike Smith (MSc, PGdipEd)
Client Education and Training
The information provided is of general nature only and does not take into account your personal objectives, financial situations or needs. Before acting on any information provided, you should consider whether the information is suitable for you and your personal circumstances and if necessary, seek appropriate professional advice. All opinions, conclusions, forecasts or recommendations are reasonably held at the time of compilation but are subject to change without notice. Past performance is not an indication of future performance. Go Markets Pty Ltd, ABN 85 081 864 039, AFSL 254963 is a CFD issuer, and trading carries significant risks and is not suitable for everyone. You do not own or have any interest in the rights to the underlying assets. You should consider the appropriateness by reviewing our TMD, FSG, PDS and other CFD legal documents to ensure you understand the risks before you invest in CFDs. These documents are available here.
A market bubble occurs when asset prices rise far beyond any reasonable valuation.
It is driven by speculation, emotion, and the belief that prices will continue rising indefinitely.
For traders, the challenge is more about finding a way to manage a bubble, rather than just identifying that one exists.
By their very nature, bubbles can persist far longer than any logical analysis suggests. There are opportunities as they develop, but timing their peak is virtually impossible.
Understanding their characteristics and having a systematic way of managing bubbles in your trading strategy is worth considering for any trader.
What is a Bubble?
Market bubbles have distinct features that separate them from normal bull markets or even overvalued conditions for a particular asset:
Dramatic Price Appreciation Disconnected From Fundamentals
In a bubble, traditional valuation metrics become meaningless.
Company or asset fundamentals that usually matter to market participants are ignored in the hope of what might be.
Cash flow, profit margins, competitive positioning, and (in some cases) producing revenue may be dismissed.
Widespread Participation And "This Time Is Different" Narratives
Bubbles require mass market participation.
When every headline you see or article you read references "this time is different," or "the old rules don't apply anymore," it is a sign that the collective psychology has shifted from normal caution.
Social media may begin to explode with ever more frequent success stories, and for the individual trader, the fear of missing out becomes increasingly overwhelming.
Credit and Leverage Fuelling Demand
Bubbles are typically accompanied by easier credit conditions.
When interest rates are lowered and investors are confident in general economic conditions, any spare cash is put to work.
In stock or other market bubbles, you may see retail traders maxing out credit cards to buy call options, with the put/call ratio becoming increasingly distorted.
This leverage often amplifies the rise and the eventual fall, making the risk even more acute and potentially damaging to trader capital.
Vertical Price Charts in Final Stages
One of the telltale signs of a bubble's final phase is a parabolic price chart.
Prices seem to go up daily, and every minor pullback is short-lived (creating more buying pressure).
This is the euphoria stage. It is where the greatest danger is.
The fear of missing out on further moves is at its highest, and a logical willingness to take profit off the table diminishes in the minds of ever more excited traders.
New participants may continue to enter solely for the way the price is appreciating. Entering into the move only understanding that what they are buying is going up, so they want to join in too.
Bubble vs. Overvalued: Key Differences
Not every expensive market is a bubble. Several characteristics distinguish a bubble from a simpler and far less dangerous overvaluation:
Elevated Valuations With Reasoned Fundamental Justification
An overvalued market has stretched valuations, but can point to real supporting factors (at least to some degree).
Examples include strong earnings growth, low interest rates, disruption in service or productivity, and providing genuine temporary value.
Even if prices respond to less obvious immediate influencing factors, such as international events, policy changes, and supply issues, the fact that some factors justify continued positive sentiment (even if somewhat unfulfilled) is a positive sign.
Linear or Steady Uptrend
Overvalued markets tend to grind higher with a more sustainable trend rather than a vertical spike. There are normal corrections along the way, even if the highs and lows of a fluctuation are higher.
Reasonable Participation Levels
There is evidence of institutional investors buying on any dips, but common retracements last days or even weeks.
Retail participation exists but isn't frenzied and plastered all over social media every day or referenced in mainstream media consistently.
Some Scepticism Still Exists
There will be some legitimate and contrary opinions about valuations. Major financial media will present both bearish and bullish cases when a stock is discussed.
Trading Strategies for Potential Bubble Management
Here is the scenario: You bought early in the up move, you are now in profit, but some of the bubble signs are beginning to show up in your thinking.
Tiered Profit-Taking Strategies
Don't try to pick the top. As an alternative approach, begin to scale out systematically with partial closes. This will alleviate the potential for FOMO creeping in.
You could stage this with set points, e.g. sell 30% when you've doubled, another 30% when you've tripled, 20% when conditions clearly show evidence of entering bubble territory and, having banked a substantial profit already, you keep the final 20% with a trailing stop for the final run if it happens.
Trailing Stops With Wider Bands to Accommodate Volatility
Let’s assume you see the merit in some form of trial stop. In bubble conditions, normal stop distances will get you whipsawed out. Use percentage-based trailing stops or ATR multiples with enough room to accommodate bigger intraday moves.
For example, if your norm is to trail your stop 1.5 x ATR behind price at the end of every candle, then in increasingly volatile conditions during a parabolic move, consider 2,5 x ATR to allow room to move while still offering protection against price collapse.
Reduce Position Sizing and Leverage
The temptation in bubbles is to maximise gains by increasing your margin and entering more and more positions in one asset.
High leverage and significant single asset exposure in bubble conditions is a potential death sentence to trading capital.
Recognising the added risks you are contemplating before entry is critical. Combining this with an approach that reduces position sizing and increases margin requirements is consistent with good trading practice as risk increases.
Planned and Rigid Exits
Before buying, you should have already made decisions on what exit approaches you should take and the parameters at which they will be executed,
Having the exit plan as you enter can limit the chance of getting trapped by greed. Neglecting this and focusing on the opportunity alone can be disastrous.
Never Assume You Can Time the Top
It is usually a big mistake if you believe you will recognise the exact top and exit perfectly. Let’s be frank, even if you hit it lucky once, you won't be able to every time — no one does.
Recognise Behavioural Biases That May Affect Your Judgment
Bubbles can create powerful psychological forces.
Anchoring bias may mean that you fixate on peak prices. Confirmation bias makes you seek information supporting your bullish view and ignore opposing evidence. Recency bias makes you believe the recent trend will continue indefinitely.
The indisputable key to any bias management is awareness and honesty that some markets may just not be for you (or if they are, to proceed with extreme and continuous caution).
Psychological Preparation for Rapid Reversals
Mentally rehearse the worst scenario and clarity of planned action, e.g., “if it drops 10% in three days, I will ….”.
Having thought through your response and armed with unambiguous exits in advance will make execution easier when emotions run high and begin to dominate.
Final Thoughts
Extreme valuations, little fundamental underpinning, parabolic price action, and universal bullishness should be part of your bubble identification checklist and flag that your bubble action plan should be implemented.
If you are already in, or tempted to be so, then approach bubbles with honesty, awareness of your trading self and extraordinary discipline to follow through, as predicting what and when things may dramatically turn is close to impossible.
Never forget you are not smarter than the market, but you can (potentially) be smarter than many traders by planning and doing the right thing.
The decision to scale (increase the traded lot size of a specific EA) should be based on statistical evidence that indicates your EA has the potential to perform to certain expectations.
Equal weight should be given to the decision to scale, as to the initial decision to deploy an EA. This guide provides an indicative approach on how to put together and action your scaling plan.
Before You Start Your Scaling Plan
Important: this should be an individual plan that is consistent with your personal trading objectives, your EA portfolio, and your personal financial situation (including account size).
We are going to use a starting lot of 0.10 per trade in the examples in this document —you want to adjust this based on your own risk tolerance.
Whatever your chosen lot size start point, EA scaling should be a pre-planned incremental approach, scaling stepwise based on performance metrics you are seeing in your live trading account.
You should also have assessed the current margin usage of your EA portfolio exposure to ensure that any scaling and related increased margin requirements are appropriate to the size of your account.
Suggested Scaling Baseline Requirements
Scaling should only be performed when your EA is performing to what you deem to be a good standard. To make this judgment, you need to set some minimum performance standards.
The past performance of your EA is not a guarantee of future performance. If market conditions change, you must remain vigilant and continue to measure performance on an ongoing basis for every live EA you have.
You need to define the key metrics that are important to you.
Two important metrics to include are:
The number of trades: to provide some evidence of reliability
The period of time: to have had exposure to at least some variation in market conditions
Example of how you may lay your metrics out in a table:
Table 1 – Sample scaling metrics
Some may choose to include proximity to original expectations of other metrics, such as minimum win rate, average profit in winning trades, and average loss in those that go against you.
It should only be after your metrics are met that lot scaling begins on any specific EA.
Lot Size Scaling Ladder
Below is an example of a performance-based scaling plan assuming a 0.10-lot baseline.
Again, this is indicative. It provides a framework with clear review dates and an approach that illustrates incremental scaling. You must still define a regime that is right for your specific trading objectives.
Table 2 – Review planning
Risk Guardrails
It is vital to keep an eye on your general account risks and have limits in place that guide your EA use.
Such limits must be constant across all stages of scaling and referenced beyond the risk of a single EA, but to your portfolio as a whole.:
Per-Trade Risk (Nominal)
Trade risk for any one trade should be seen in the context of account size and the dollar risk based on the risk parameters you have set for your EA.
Specify a maximum percentage of the account balance — a $200 loss is more impactful on a $1000 account compared to a $10,000 account.
Stick to what is right for you in terms ofyour tolerable risk level based on your trading objectives and financial situation. A common suggestion is a 1-2% risk of account equity per trade.
Total Open Exposure
Specifying maximum exposure in the number of EAs open at any time and those that use the same asset class is important for overall portfolio risk management.
There are tools you can use to monitor exposure risk generally, as well as those that can be used to indicate single asset exposure.
Margin Usage
It is always desirable that your set exit approaches and parameter levels are what your exits are based on. It should not be because your margin usage has meant you have moved into a margin call situation.
Specify a minimum level to adhere to and make sure that your account is sufficiently funded. If volatility or slippage rises (e.g., news events or illiquid sessions), reduce lot size temporarily.
Scaling Psychology – Managing “Big Numbers”
As lot sizes rise, your emotions may respond accordingly when you see the larger dollar amounts that your EA is generating.
If you are used to seeing an average profit of $100 and average loss of $50, and suddenly you are seeing significantly bigger numbers, it creates an emotional challenge where you may be tempted to do a “discretionary override”.
Although there are situations, such as major market events, overexposure in a specific asset, or VPS or account system problems, where such intervention may be considered, generally this would distort the actual performance evaluation of your EA and is not encouraged (unless it is pre-planned).
The table below presents some of the generally accepted challenges and offers suggestions on how to manage them.
Your Plan Into Action…
In practical terms, your scaling plan should have two components:
The key parameters for action on your chosen key metrics
Specified periodic review times to make your next scaling decision
This is not a race. Having systems in place facilitates creating the opportunity that scaling brings while still mitigating the risks.
You've been using a 30-pip trailing stop for as long as you can remember. It feels professional, manageable and relatively safe.
But during volatile sessions, you see your winners get stopped out prematurely, while low-volatility winners drift back and hit stops that are relatively too tight.
Same 30 pips, different market contexts, but inconsistent in the protection of profit and overall results.
The Fixed-Pip Fallacy?
Traders gravitate toward fixed pip trailing stops because they feel concrete and calculable. The approach is easy to execute, readily automated through platforms like MetaTrader, and aligns with how most people naturally think about profit and loss.
But this simplicity masks a fundamental problem.
A twenty-five pip move in EURUSD during the London open represents an entirely different market event than the same move during the Asian session. The context matters, yet the fixed-pip approach treats them identically.
This becomes even more problematic when you consider different currency pairs. GBPJPY might have an average true range of thirty pips on an hourly chart, while EURGBP shows only ten. The same trailing stop applied to both instruments ignores the reality that volatility varies dramatically across pairs.
Timeframe introduces yet another layer of complexity. Take AUDUSD as an example: a ten-pip move on a four-hour chart barely registers as meaningful price action, but on a five-minute chart it represents a significant swing. The fixed-pip method treats these scenarios as equivalent.
The natural response might be to use something more sophisticated, like an ATR multiple. This accounts for your chosen timeframe, the instrument's normal volatility, and even session differences. But it brings its own complications.
When do you measure the ATR? Do you use the value at entry, knowing it might be distorted by sessional effects? Or do you make it dynamic, which becomes far more complex to implement in practice?
Perhaps there's another way forward that doesn't rely on abstract measures of volatility but instead responds directly to the movement of price in relation to the trade you're actually in—accounting for your lot size and the profit you've already captured.
Maximum Give Back: The Percentage Approach
Instead of asking "how do I protect profit after fifty pips," ask "how do I protect profit after giving back a certain percentage of open gains."
Consider a maximum give-back threshold of 40%. When your trade is up one hundred pips, the trailing stop activates if price retraces forty pips from peak, locking in a minimum of sixty pips.
But when that same trade reaches two hundred fifty pips of profit, the stop adjusts, and now it activates at a one-hundred-pip pullback, securing at least one hundred fifty pips. The stop distance scales naturally with the magnitude of the win you're sitting on.
This creates a logical asymmetry that fixed pip approaches miss entirely. Small winners receive tighter protection. Big winners get room to breathe.
The approach adapts automatically to what the market is actually giving you in real time, without requiring you to predict anything in advance.
You don't need to maintain a reference table where EURUSD gets thirty pips and GBPJPY gets sixty. You don't need different standards for different instruments at all.
The same 40% logic works whether the average true range is high or low, whether volatility is expanding or contracting. It is designed to be more adaptive to regime changes than fixed-pip stops, potentially requiring less manual recalibration as it's responding to the trade itself rather than to abstract measures of what the instrument normally does.
The market tells you how much it's willing to move in your direction, and you protect that information proportionally. Nothing more complicated than that.
Key Parameters to Specify in Your System:
Maximum Give Back Percent: 30-50% is typical, but is dependent on how much profit retracement you can tolerate.
Minimum Profit to Activate: In dollar amount or an ATR multiple form entry. This prevents premature exits on tiny winners, e.g., if it has moved 5 pips at 40% that would mean you are only locking in a 3-pip profit.
Update Frequency: Potentially every bar. More frequent, but there may be issues if there is a limited ability to look at the market (if using some sort of automation, this could be programmed).
Is Maximum Giveback Always the Optimum Trail?
As with many approaches, results can be highly dependent on underlying market conditions. It is important to be balanced.
The table below summarises some observations when maximum giveback has been used as part of automated exits.
The major difference isn’t likely to be an increased win rate. It is about keeping more of your runners during high-volatility price moves rather than donating them back to the market.
It may not always be the best approach, as different strategies often merit different exit approaches.
There are two obvious scenarios where fixed pips may still be worth consideration.
Very short-term scalping (sub-20 pip targets)
News trading, where you want instant hard stops
Integrating Maximum Giveback With Your System
You may have other complementary exit filters in place that you already use. Remember, the ideal is often a combination of exits, with whichever is triggered first.
There is no reason why this approach will not work well with approaches such as set stops, take profits and partial closes (where you simply use maximum Giveback in the remainder as well as time-based exits.
Final Thoughts
To use fixed-pip trailing stops irrespective of instrument pricing, volatility, timeframe, and sessional considerations is the trading equivalent of wearing the same jacket in summer and winter.
Maximum Give Back trailing adjusts to the ‘market weather’. It won't make bad trades good, but it could help stop you from cutting your best trades short just because your stop was designed for average conditions.
The market doesn't trade in averages but has specific likely moves dependent on context. Your exits should not be average either.
Nvidia's AI computing dominance is facing its most serious challenge yet, with Google strengthening its position as an equal competitor in the AI chip market this week.
Google’s newest AI model, Gemini 3, was announced to be powered by Google’s in-house tensor processing units (TPUs) a few weks ago. A blow to Nvida, but not a huge shock.
However, this week it was announced that Google is now negotiating with Meta to supply billions of dollars' worth of its TPUs for Meta's data centres in 2027.
Google is reported to be pitching its cloud customers on TPU purchases, claiming it could capture as much as 10% of Nvidia's annual revenue.
Nvidia Shares fell 2.6% following the Google-Meta report and are down 10% for the month, erasing more than $500 billion in market value.
NVDA 30-day chart
For Google, this represents pure upside—monetising technology development while a competitor helps fund the operation.
Meta also stands to benefit from presumably lower costs compared to Nvidia's premium-priced GPUs.
Nvidia maintains it is "a generation ahead of the industry" and emphasises that it offers greater performance, versatility, and fungibility than application-specific integrated circuits (ASICs) like Google's TPUs.
Yet the very act of addressing these concerns—after years of untouchable dominance—may signal the pressure mounting on the AI chip leader.
For now, the crown remains Nvidia's. But with Google emerging as a credible challenger and other cloud computing hyperscalers diversifing their chip sourcing, that crown sits considerably less comfortably than it did a few weeks ago.
Tesla's Pivot Eroding EV Dominance
Tesla's dominance in the electric vehicle market is eroding across all three major global markets.
European sales collapsed 48.5% in October compared to the previous year, with year-to-date sales down roughly 30% even as the broader European EV market surged 26%.
China's once-reliable market has similarly soured, with October deliveries hitting a three-year low, falling 35.8%.
In the U.S., October sales dropped 24% after a brief September surge driven by buyers rushing to capture expiring tax credits.
In Europe, Chinese automaker BYD now significantly outsells Tesla, while legacy manufacturers like Volkswagen saw sales through September reached 522,600 units—triple Tesla's European sales.
Tesla's response has been to pivot toward robotaxis and humanoid robots rather than new consumer vehicles.
Tesla Robotaxi in Austin, Texas
CEO Elon Musk claimed Tesla will be doubling its Austin's fleet to 60 vehicles by year-end, although this is also short of his October prediction of 500.
Despite these challenges, Tesla maintains a $1.4 trillion valuation, making it the world's tenth most valuable public company by market cap.
Fed December Rate Cut Flips to Certainty
Market odds for a December rate cut have flipped to above 80%, after dramatically dropping down to 42% just last week.
JPMorgan Chase has reversed its forecast entirely. After briefly predicting the Fed would delay cuts until January following delayed September jobs data, the bank now expects quarter-point reductions in both December and January.
Polymarket odds on December rate cut
The shift came following seemingly sudden supportive commentary from key Fed officials. New York Fed President John Williams made a case for additional rate cuts, while San Francisco Fed President Mary Daly also came out to publicly support cuts due to labour market concerns.
The sudden shift in communication means the Fed officials may have decided that market stability concerns now outweigh inflation risks — at least for now.
One of the most impactful books I’ve ever read is “The 7 Habits of Highly Effective People: Powerful Lessons in Personal Change” by Stephen Covey.
When it was first published in 1989, it quickly became one of the most influential works in business and personal development literature, and retained its place on bestseller lists for the next couple of decades.
The compelling, comprehensive, and structured framework for personal growth presented in the book has undoubtedly inspired many to rethink how they organise their lives and priorities, both professionally and personally.
Although its lessons were originally designed for self-improvement and positive structured growth, the underlying principles are universal, making them easily transferable to many areas of life, including trading.
In this article, you will explore how each of Covey’s seven original habits can be reframed within a trading context, in an attempt to offer a structure that may help guide you to becoming the best trader you can be.
1. Be Proactive
Being proactive means recognising that we have the power to choose our responses and to shape outcomes through appropriate preparation with subsequent planned reactions.
In a Trading Context:
For traders, this means anticipating potential problems before they arise and putting measures in place to better mitigate risk.
Rather than waiting for issues to unfold, the proactive trader identifies potential areas of concern and ensures that they have access to the right tools, resources, and people to prepare effectively, whatever the market may throw at them.
What This Means for You:
Being proactive may involve seeking out quality education and services, maintaining access to accurate and timely market information, continually assessing risk and opportunity, and having systems to manage those risks within defined limits.
Consequences of Non-Action:
Inadequate preparation and a lack of defined systems often lead to poor trading decisions and less-than-desired outcomes.
Failing to assess risk properly can result in significant and often avoidable losses.
By contrast, a proactive approach builds resilience and confidence, ensuring that when challenges arise, your response is measured and less emotionally driven by what is happening on the screen in front of you.
2. Begin with the End in Mind
Covey's second habit is about defining purpose. It suggests that effective people are more likely to achieve what is possible if they start with a clear understanding of their destination, so every action aligns with that ultimate vision.
In a Trading Context:
Ask yourself: What is my true purpose for trading?
Many traders may instinctively answer “to make money,” but money is surely only a vehicle to achieve something else in your world for you and those you care about, not a purpose per se.
You need to clarify what trading success really means for you.
Is it a greater degree of financial independence through increased income or capital growth, the freedom of having more time, achieving a personal challenge of becoming a successful trader, or a combination of any of these?
What This Means to You:
Try framing your purpose as, “I must become a better trader so that I can…” and complete a list with your genuine reasons for tackling the market and its challenges.
This helps you establish meaningful short-term development goals that keep you moving toward your vision. Keep that purpose visible, as a note near your trading screen that reminds you why you are doing this.
Consequences of Non-Action:
Traders with a clearly defined purpose are more likely to stay disciplined and consistent.
Those without one often drift, chasing short-term gains without direction. There is ample evidence that formalising your development in whatever context through goal setting can significantly increase the likelihood of success. Why would trading be any different?
Surely the bottom-line question to ask yourself is, “Am I willing to risk my potential by trading without purpose?”
3. Put First Things First
This habit is about time management and prioritisation. This involves focusing your efforts and energy on what truly matters. As part of the exploration of this concept, Covey emphasised distinguishing between what is important and what is merely urgent.
In a Trading Context:
Trading demands commitment, learning, and reflection.
It is not just about screen time but about using that time effectively.
Managing activities to ensure your effort is spent wisely on planning, measuring, journaling and performance evaluation, and refining systems, accordingly, are all critical to sustaining both improvements in results and balance.
What This Means to You:
Traders often believe they need to spend more time trading when what they really need is to focus on better time allocation.
It is logical to suggest that prioritising activities that can often contribute directly to improvement, such as system testing, reviewing performance, analysing results, and refining your strategy, is worthwhile.
These high-value tasks are what make the difference between “busy trading” and “more effective trading.”
Consequences of Non-Action:
If you fail to control your trading time effectively, you will be more likely to spend much of it on low-impact activities that produce little progress.
Over time, this not only hurts your results but also reduces the real “hourly value” of your trading effort.
In business terms, and of course, you should be treating your trading as you would any business activity; poor prioritisation can inflate your costs and diminish your potential trading outcomes.
4. Think Win: Win
Covey's fourth habit encouraged an attitude of mutual benefit, where seeking solutions that facilitate positive outcomes for all parties.
In a Trading Context:
In trading, this concept must be adapted to suggest that developing a mindset that recognises every well-executed plan as a win, even when an individual trade results in a loss.
Some trading ideas will simply not work out, and so some losses are inevitable, but if they remain within defined limits, they should not be viewed as failures but rather as a successful adherence to a trading plan. In the aim of developing consistency in action, and the widely held belief that this is one of the cornerstones of successful trading, then it surely is a win to fulfil this.
So, in simple terms, the real “win” lies in a combination of maintaining discipline, following your system, and controlling risk beyond just looking at the P/L of a single trade.
What This Means to You:
Building and trading clear, unambiguous systems that you follow consistently has got to be the goal.
This process produces reliable data that you can later analyse and subsequently use to refine specific strategies and personal performance.
When you do this, every outcome, whether profit or loss, can serve as valuable feedback.
For example, a controlled loss that fits your plan is proof that your system works and that you are protecting your capital.
Alternatively, a trailing stop strategy, which means you exit trades in a timely way and give less profit back to the market, provides positive feedback that your system has merit in achieving outcomes.
Consequences of Non-Action:
Without this mindset shift, traders can become emotionally reactive, interpreting normal drawdowns as personal defeats.
This fosters loss aversion and other biases that can erode decision-making quality if left unchecked. Through the process of redefining “winning,” you are potentially safeguarding both your capital and, importantly, your trading confidence (a key component of trading discipline).
5. Seek First to Understand and Then Take Action
Covey's fifth habit emphasises empathy, the act of listening and aiming to fully understand before responding. In trading, this principle translates to understanding the market environment before taking any action.
In a Trading Context:
Many traders act impulsively, driven by excitement or fear, which often results in entering trades without taking into account the full context of what is happening in the market, and/or the potential short-term influences on sentiment that may increase risk.
This “minimalisation bias,” defined as acting on limited information, will rarely produce consistent results. Instead, adopt a process that begins with observation and comprehension.
What This Means to You:
Establishing a daily pre-trading routine is critical. This may include a review of key markets, sentiment indicators, and potential catalysts for change, such as imminent key data releases. Understanding what the market is telling you before you decide what to do is the aim of having this sort of daily agenda.
This approach may not only improve trade selection but also enable you to get into a state of psychological readiness that can facilitate decision-making quality throughout the session.
Consequences of Non-Action:
Failing to prepare for the trading day ahead can mean not only exposing yourself to unnecessary risk but also arguably being more likely to miss potential opportunities.
A trader who acts without understanding is vulnerable both psychologically and financially. Conversely, being forewarned is being forearmed. When you aim to understand markets first before any type of trading activity, your actions are more likely to be deliberate, grounded, and more effective.
6. Synergise
Synergy in Covey's model means valuing differences and combining the strengths of those around you to create outcomes greater than the sum of their parts.
In a Trading Context:
In trading, synergy refers to the integration of multiple systems and disciplines that work together. This includes your plan, your record keeping and performance management processes, your time management, and your emotional balance.
No single system is enough; success comes from the synergy of elements that support and inform one another.
What This Means to You:
Integrating learning and measurement is an integral part of your trading development process. Journaling, for example, allows you to assess not only your technical performance but also your behavioural consistency.
This self-awareness allows you to refine your plan and so helps you operate with greater confidence.
The synergy between rational analysis and emotional composure is what is more likely to lead to consistently sound trading decisions.
Consequences of Non-Action:
When logic and emotion are out of balance, decision-making will inevitably suffer.
If your systems are incomplete, ambiguous, or poorly connected to the reality of your current level of understanding, competence and confidence, your results are likely to be inconsistent. Building synergy across all areas of your trading practice, including that of evaluation and development in critical trading areas, will help create cohesion, efficiency, and better performance.
7. Sharpen the Saw
Covey's final habit focuses on continuous learning and refinement, including maintaining and improving the tools at your disposal and skills and knowledge that allow you to perform effectively.
In a Trading Context:
In trading, this translates to creating a plan to achieve ongoing, purposeful learning.
Even small insights can make a large difference in results. Successful traders continually refine their knowledge, ask new questions, and apply lessons from experience.
What This Means to You:
Trading learning can, of course, take many forms. Discovering new indicators that may offer some confluence to price action, testing different strategies, exploring new markets, or simply understanding more about yourself as a trader.
There is little doubt that active participation in learning keeps you engaged, adaptable and sharp. Even making sure you ask at least one question at a seminar or webinar or making a simple list at the end of each session of the "3 things I learned", can be invaluable in developing momentum for your growth as a trader.
Your record-keeping and performance metrics should generate fresh questions that can guide future development.
Consequences of Non-Action:
Without direction in your learning, your progress is likely to slow.
I often reference that when someone talks about trading experience in several years, this is only meaningful if there has been continuous growth, rather than staying in the same place every year (i.e. only one year of meaningful experience)
Passive trading learning, for example, reading an article without applying, watching a webinar without engagement, or measuring without closing the circle through putting an action plan together for your development, can all lead to stagnation.
It is fair to suggest that taking shortcuts in trading learning is likely to translate directly into shortcuts in result success.
Active, focused development is essential for sustained improvement.
Are You Ready for Action?
Stephen Covey’s The 7 Habits of Highly Effective People presented a timeless model for self-development and purposeful living.
When applied to trading, these same habits form a powerful framework for consistency, focus, and growth.
Trading is a pursuit that demands both technical skill and emotional strength. Success is rarely about finding the perfect system, but about developing the right habits that support consistent, rational decision-making over time.
By integrating the principles of Covey’s seven habits into your trading practice, you create a foundation not only for profitability but for continual personal growth.
Markets found support last Friday after what was the worst week for global markets since Liberation Day.
Shortened Thanksgiving Week
This week, Thanksgiving Day impacts the US trading schedule, affecting both liquidity and data timing. Despite the shortened week, it's still packed with key releases. The PCE index, US PPI, retail sales, GDP, and weekly jobs figures are set for a concentrated release on Wednesday, before the Thursday holiday.
Australian CPI in Focus
Australian CPI data also drops on Wednesday, and it's shaping up to be a crucial number. With strong signals from the RBA indicating a Christmas interest rate cut is unlikely, this inflation reading could either reinforce or challenge the RBA's stance — a must-watch for any surprises that might move rate expectations.
Gold Coiling
Gold has established a strong base above $4,000. The chart shows six consecutive weekly candles testing support around $4,065, with clear rejection of downside moves. This pattern suggests insufficient selling pressure to push prices lower, potentially setting the stage for a move back toward $4,200-$4,250 if buyers step in.
Bitcoin Under Pressure
Bitcoin is experiencing another wave of selling. The weekend brought some respite with a bounce off $84,000, but the current support level sits at $82,000—a level we haven't seen since April. While there may be short-covering opportunities toward $92,000, the buyer momentum looks weak, and another test of $82,000 support appears equally likely.
Market Insights
Watch Mike Smith's analysis for the week ahead in markets.
Key Economic Events
Stay up to date with the key economic events of the week.