The information provided is of general nature only and does not take into account your personal objectives, financial situations or needs. Before acting on any information provided, you should consider whether the information is suitable for you and your personal circumstances and if necessary, seek appropriate professional advice. All opinions, conclusions, forecasts or recommendations are reasonably held at the time of compilation but are subject to change without notice. Past performance is not an indication of future performance. Go Markets Pty Ltd, ABN 85 081 864 039, AFSL 254963 is a CFD issuer, and trading carries significant risks and is not suitable for everyone. You do not own or have any interest in the rights to the underlying assets. You should consider the appropriateness by reviewing our TMD, FSG, PDS and other CFD legal documents to ensure you understand the risks before you invest in CFDs. These documents are available here.
Any references to Australian or international shares, sectors, indices, ETFs, crypto-related stocks or other instruments are provided for market commentary and watchlist purposes only and do not constitute a recommendation, offer or solicitation to buy, sell or hold any financial product or adopt any investment strategy. International markets may involve additional risks, including currency fluctuations, regulatory differences, market structure differences, reduced liquidity and higher volatility. Company-specific, sector-specific and macroeconomic risks may also affect performance.
Commentary on geopolitical developments, economic data, central bank decisions, earnings, policy changes and other global or financial market events is based on information available at the time of publication and may change without notice. Such events can lead to sudden market moves, price gaps, reduced liquidity, wider spreads and increased volatility, particularly in leveraged products such as CFDs. Forward-looking statements, expectations and scenario analysis are inherently uncertain and should not be relied on as guarantees of future market behaviour or outcomes.
British Pound is flatlined as US jobs strength, election risks loom

- GBP/USD edges 0.10% higher despite upbeat US labour market data.
- US job openings reach 7.5 million as Factory Orders jump 1.8%.
- BoE rate hike expectations support Sterling ahead of US midterm elections.
The Pound Sterling steadies against the US Dollar, up a modest 0.10%, as investors await the results of the US midterm elections. Factory Data in the US and a softer US JOLTS report boosted the Greenback, trimming its earlier losses. The GBP/USD trades at around 1.3420.
GBP/USD steadies as stronger US data, geopolitical uncertainty limit gains
The US Bureau of Labour Statistics revealed that the Job Openings and Labour Turnover Survey (JOLTS) for September showed job openings rose from 7.19 million to 7.5 million, up 4.5% from 4.3%. The report showed that the hire rate was 3.4%, up from 3.3%, while total separations were unchanged at 3.3%.
The report was positive as the rise in job vacancies was followed by an increase in hiring. Meanwhile, Factory Orders rose from 0.3% to 1.8% MoM in September, revealed the US Census Bureau.
Geopolitics are also playing their role, capping GBP/USD advance amid risks of an escalation. Although Al Araby reported that a draft of an MOU was approved by Washington and Tehran, Iran denied those claims, with IRIB revealing that it rejects reports that it’s close to a deal with the US.
Eyes turn to the US midterm elections. According to Polymarket data, the Democrats have a 95% chance of controlling the House of Representatives and a 78% chance of securing a majority in the US Senate. This keeps investors nervous about the outcome and the White House's response to the results.
The US Dollar Index (DXY), which measures the Greenback’s performance against six currencies, is flat at 101.81.
In the UK, investors are bracing for the Bank of England (BoE) monetary policy decision this Thursday. The BoE is expected to increase interest rates for the first time since August 2023. For 2027, money markets see three more rate hikes, according to Prime Terminal data.
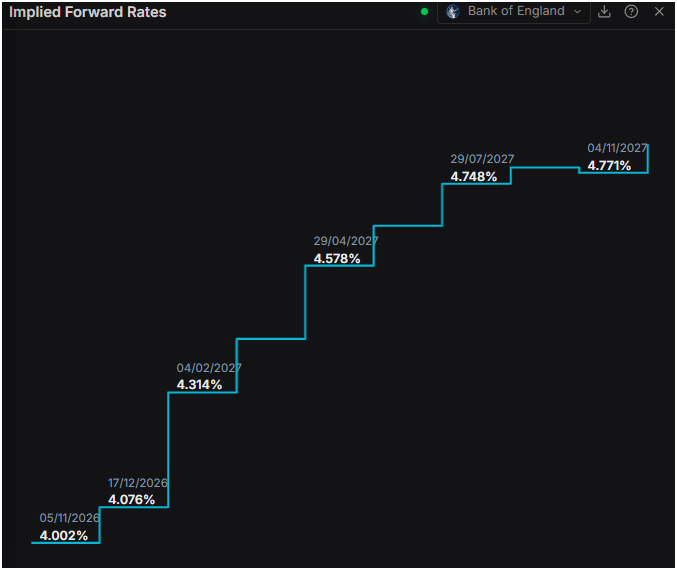
What’s up next in the docket
The UK schedule is absent. In the US, traders' attention would be on the ADP Employment Change and the ISM Services PMI for October.
GBP/USD Price Forecast: Technical outlook
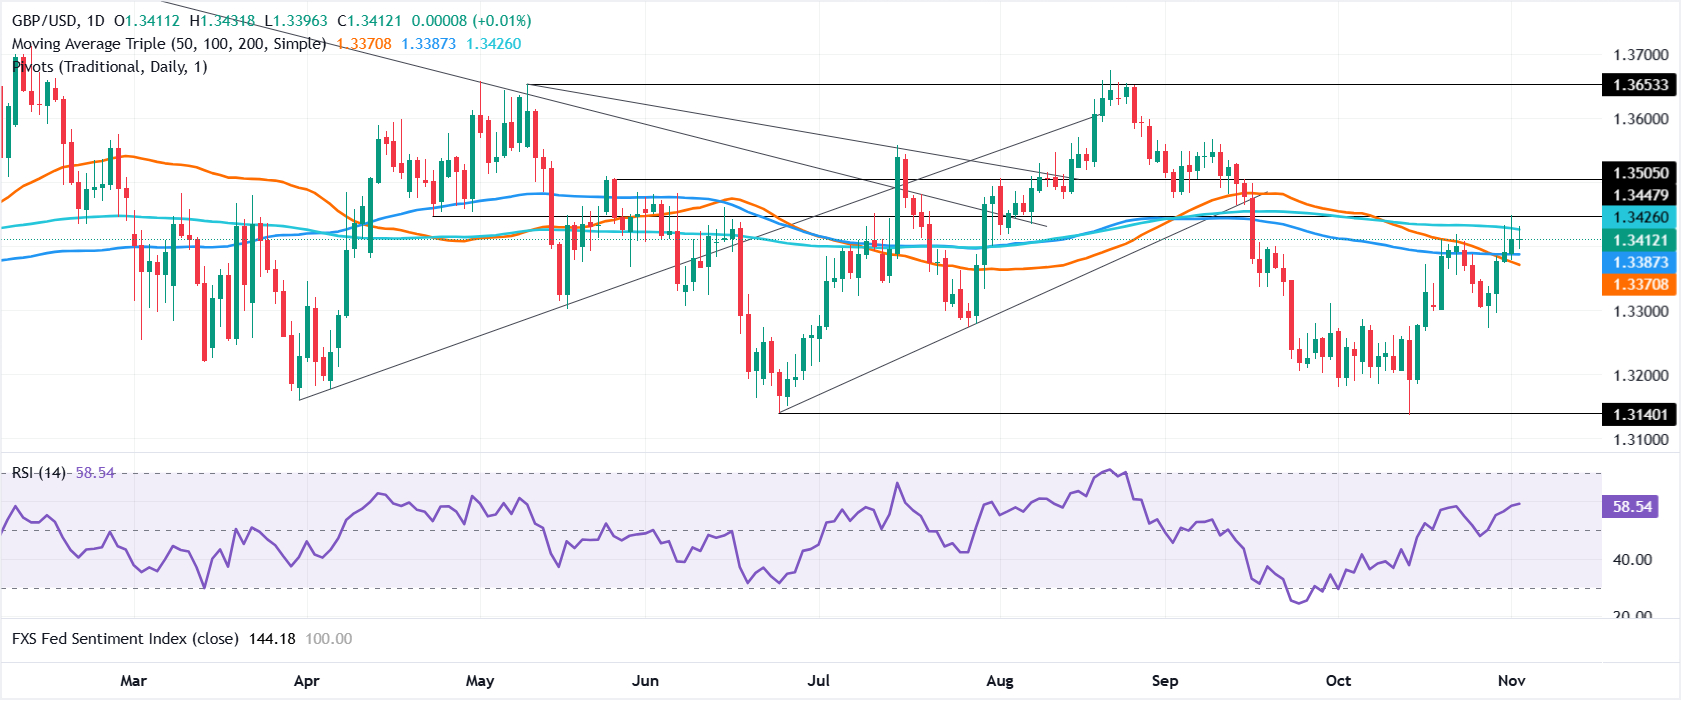
In the daily chart, GBP/USD trades at 1.3412. The pair holds a mildly bullish near-term bias as spot trades above the latest reading of the 50/100/200-day simple moving average cluster at 1.3371 and the nearer rising support trend line around 1.3360, suggesting underlying demand on dips. The Relative Strength Index (14) at 58.5 stays in positive territory but shy of overbought, hinting that upside momentum remains constructive while not yet stretched.
On the topside, immediate resistance is seen near the confluence of descending trend-line reactions, with the latest rejected levels at 1.3508 and 1.3544, ahead of a higher barrier from the more recent support trend-line break at 1.3606. On the downside, initial support is now defined by the reclaimed moving average band around 1.3371, reinforced by the rising structural trend line at 1.3360, and a sustained hold above these levels would keep the bullish bias intact.
(The technical analysis of this story was written with the help of an AI tool. Know more.)
Pound Sterling Price Today
The table below shows the percentage change of British Pound (GBP) against listed major currencies today. British Pound was the strongest against the Swiss Franc.
| USD | EUR | GBP | JPY | CAD | AUD | NZD | CHF | |
|---|---|---|---|---|---|---|---|---|
| USD | 0.15% | 0.00% | 0.41% | 0.04% | 0.25% | 0.07% | 0.42% | |
| EUR | -0.15% | -0.14% | 0.25% | -0.11% | 0.11% | -0.08% | 0.27% | |
| GBP | -0.00% | 0.14% | 0.36% | 0.04% | 0.25% | 0.05% | 0.42% | |
| JPY | -0.41% | -0.25% | -0.36% | -0.35% | -0.15% | -0.33% | 0.03% | |
| CAD | -0.04% | 0.11% | -0.04% | 0.35% | 0.21% | 0.02% | 0.38% | |
| AUD | -0.25% | -0.11% | -0.25% | 0.15% | -0.21% | -0.18% | 0.17% | |
| NZD | -0.07% | 0.08% | -0.05% | 0.33% | -0.02% | 0.18% | 0.36% | |
| CHF | -0.42% | -0.27% | -0.42% | -0.03% | -0.38% | -0.17% | -0.36% |
The heat map shows percentage changes of major currencies against each other. The base currency is picked from the left column, while the quote currency is picked from the top row. For example, if you pick the British Pound from the left column and move along the horizontal line to the US Dollar, the percentage change displayed in the box will represent GBP (base)/USD (quote).
Related Articles