The week ahead – RBNZ rate decision, USD, AUD and JPY inflation data
Lachlan Meakin
21/3/2024
•
0 min read
Share this post
Copy URL
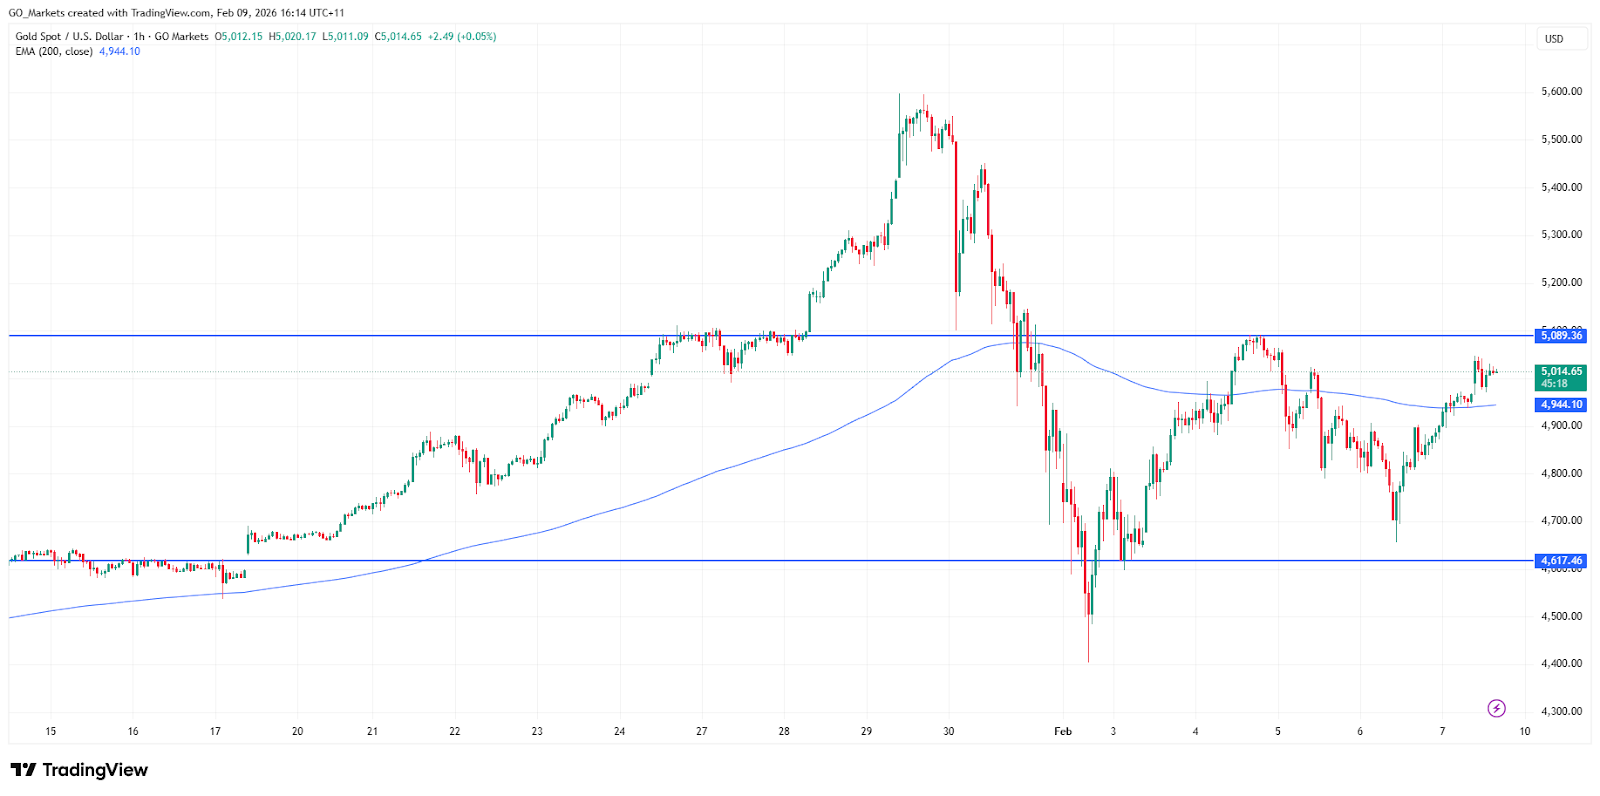
FX markets enter the new week with market sentiment firmly risk-on with all-time highs seen in US and Japanese indexes after a blowout earnings report from AI darling Nvidia (NVDA) sent stocks surging. Ahead this week we have key inflation data out of the US, Australia and Japan along with a RBNZ rate decision which is certainly in play. The Charts to watch this week Gold – XAUUSD Despite the buoyant market sentiment gold gained last week as the USD chopped around without real direction.
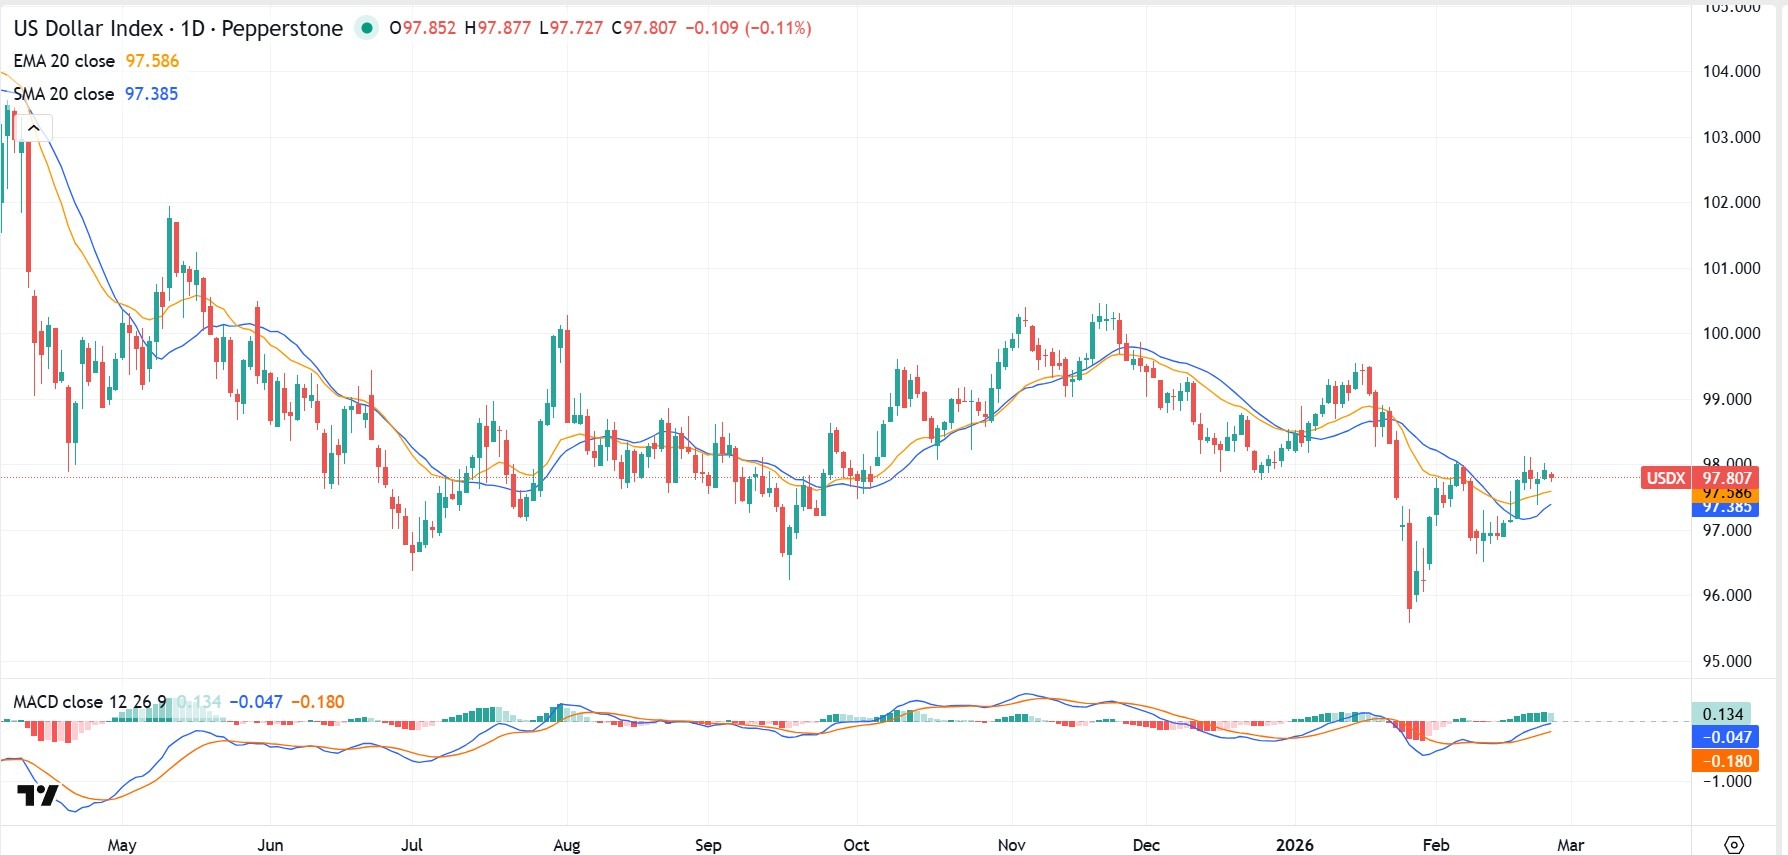
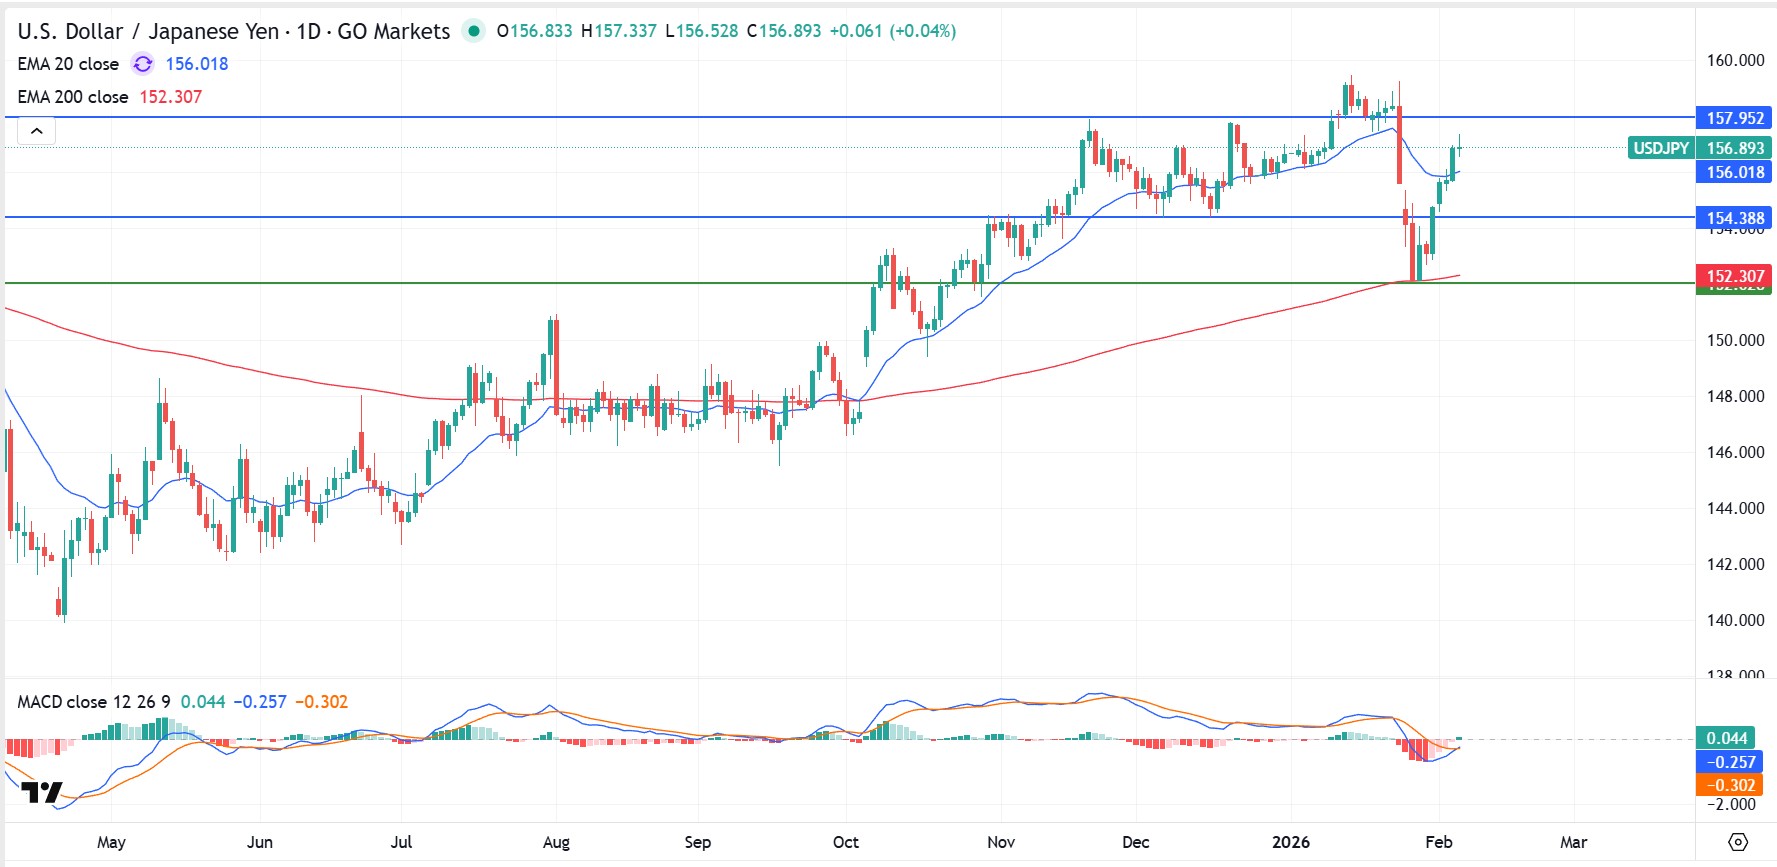
XAUUSD finding good support at the 2020 USD an ounce level in the second half of the week. This will be a key level to watch coming into Thursdays PCE inflation data out of the US a cooler than expected reading could see the USD decline continue and likely to add to golds bullish recovery. USDJPY Japanese inflation data released Thursday is expected to show a sharp drop in January due to a high base last year this could impact the JPY even further, raising doubts around one of the Bank of Japan’s two conditions for policy normalisation and be bullish for USDJPY.
Though above 150 there is the specter of BoJ intervention such as we saw at these levels late in 2022. Currently 150 has become a support level for USDJPY, but upside in this pair seems capped with little upside momentum shown recently, FX traders no doubt cautious at these levels. AUDNZD Both AUD and NZD outperformed last week as market optimism and steps by Chinese authorities to support their stock market lifted both the Antipodean currencies.
NZD did outperform the Aussie though, with AUDNZD hitting new 9-month and 2024 lows. This week will be a big one for AUDNZD traders, with Aussie CPI expected to rise and a RBNZ rate decision where the bank is expected to hold rates both happening on Wednesday. The market is pricing in a 30% of a hike from the RBNZ, so whichever way they go expect some volatility in NZD crosses over this announcement.
Full Economic calendar of the week ahead at the following link: https://www.gomarkets.com/au/economic-calendar/
By
Lachlan Meakin
Head of Research, GO Markets Australia.
本文由 GO Markets 的分析師及撰稿人撰寫,內容基於其獨立分析或個人經驗。文中所表達的觀點、意見或交易風格均屬作者個人,並不代表或反映 GO Markets 的立場。任何提供的建議均屬一般性,並未考慮您的個人目標、財務狀況或需求。在採取任何行動之前,請考慮該建議是否適合您的目標、財務狀況與需求。若該建議涉及購買特定金融產品,請於作出任何決定前,先閱讀我們網站上提供的《產品揭露聲明書》(Disclosure Statement, DS)及其他法律文件。
FX markets enter an important window with a Federal Reserve policy decision and press conference, US ISM activity data, German inflation releases, China PMIs, and Australian labour figures all due.
Quick facts
The upcoming Fed policy decision and press conference are closely watched for guidance on the potential timing of rate cuts, with implications for US Treasury yields and USD direction.
Broad USD selling has intensified over the last 48 hours. The move has coincided with renewed tariff rhetoric and heightened sensitivity to FX intervention narratives.
ISM Manufacturing PMI is scheduled for Monday, 2 February, with ISM Services PMI on Wednesday, 4 February, providing timely insight into US growth momentum.
German CPI, euro area GDP and unemployment, China PMIs, and Australian labour data provide regional context, particularly for EUR and AUD crosses.
USD/JPY
What to watch
The Federal Reserve decision and subsequent press conference are key events influencing US Treasury yields.
Any shift in tone around inflation progress, economic risks, or rate cut timing expectations may affect yield differentials and near-term USD sensitivity.
Recent broad USD weakness, reinforced by tariff-related headlines and intervention sensitivity, has added downside pressure to the USD.
On the JPY side, Japan inflation signals, including Tokyo CPI, are relevant as indicators of domestic price trends and potential policy direction.
Key releases and events
Thu 30 Jan: Japan Tokyo CPI (January)
Thu 30 Jan: Federal Reserve policy decision and press conference
Mon 2 Feb: US ISM Manufacturing PMI
Wed 4 Feb: US ISM Services PMI
Technical snapshot
USDJPY has broken lower from its recent consolidation zone, with downside range evident over the last 48 hours. Price has moved down to the 200-exponential moving average (EMA) and is testing a level not seen since October 2025.
USDJPY 1-day chart
EUR/USD
What to watch
The Fed decision and press conference may influence EUR/USD primarily through USD moves linked to Treasury yield reactions.
On the EUR side, German CPI will show inflation trends, while euro area flash GDP and unemployment data inform the regional growth outlook.
Key releases and events
Thu 29 Jan: Germany CPI (preliminary)
Thu 29 Jan: Eurozone flash GDP, Q4 2025
Thu 30 Jan: Federal Reserve decision and press conference
Fri 30 Jan: Eurozone unemployment rate
Technical snapshot
EURUSD has extended above a prior resistance level, with expanded daily ranges and strong momentum. Price action in other USD crosses suggests the move may be reflecting USD weakness, rather than a material shift in euro area fundamentals.
EURUSD 1-day chart
EUR/AUD
What to watch
Alongside euro area growth numbers, Australian employment data may influence near-term EUR/AUD sensitivity ahead of the RBA policy decision next week.
China's official PMIs remain relevant, as shifts in Chinese activity expectations can influence AUD via commodity demand and regional risk sentiment.
Key releases and events
Thu 29 Jan: Australia Labour Force, Detailed (Dec 2025), 11:30am AEDT
Fri 31 Jan: China official Manufacturing and Non-Manufacturing PMIs
Tue 4 Feb: RBA policy decision
Technical snapshot
EUR/AUD has decisively broken below its prior support zone, with price now testing levels not seen since April 2025. Momentum remains negative, consistent with a renewed downside phase rather than consolidation.
EURAUD 1-day chart
Bottom line
The Fed decision and press conference, US PMI data, German inflation releases, China PMIs, and Australian labour figures are clustered in a short window.
Markets will be watching whether the USD weakness evident over the last 48 hours extends further.
FX markets face a data-heavy period in the coming days, led by US inflation releases and late-week flash purchasing managers’ indexes (PMIs).
Regional data and central bank expectations in Japan, Europe, and Australia may influence cross-currency moves, particularly if outcomes differ from expectations.
Quick facts:
US Personal Income and Outlays is a key inflation release this week, closely watched by policymakers.
Flash PMIs across the US, Eurozone, Germany, and the UK offer a timely read on growth momentum.
Australian data, including labour market indicators, remains important for AUD sensitivity and Reserve Bank of Australia (RBA) expectations.
FX markets can be sensitive when data outcomes differ from expectations.
USDJPY
What to watch
US attention centres on inflation and activity data, particularly the Personal Income and Outlays report and the PCE price index, alongside late-week flash manufacturing and services PMIs.
These releases are closely followed by markets for their potential influence on rate expectations and USD sensitivity.
On the JPY side, Bank of Japan (BoJ) developments remain relevant, although US data has often been a key driver of recent moves.
Key releases and events
Fri 23 Jan (US): US Personal Income and Outlays (including PCE inflation)
Fri 23 Jan (US): Manufacturing and services PMI
Technical snapshot
USDJPY continues to trade above its rising 200-day moving average, with recent daily candles showing greater overlap and smaller ranges over recent weeks.
Price has remained above the long-term average since late September, with higher swing lows still visible.
Momentum appears to have moderated since early January, consistent with slowing follow-through rather than reversal.
Daily ranges have narrowed compared with the October to November advance, again suggesting short-term consolidation.
Eurozone flash PMIs and Germany producer price index (PPI) data provide insights into regional growth momentum and whether inflation pressures are building.
While these releases may influence immediate EUR sentiment, EURUSD continues to trade in the broader context of US data outcomes and global risk conditions.
EURUSD is trading above its rising 200-day moving average (daily chart), although price action since July suggests the market has become more range-bound rather than directional, following the advances in the first half of 2025.
The broader upward structure has been in place since the beginning of 2025, although progress higher has stalled over recent months.
Momentum readings have drifted toward neutral since late November, consistent with balanced conditions.
Average daily range has continued to compress since July, consistent with a flattening of the trend.
Australian labour market data remains central for AUD sensitivity and RBA expectations. UK CPI is also due this week, which may contribute to cross volatility, particularly if it shifts expectations around the UK rates outlook.
Late-week PMI releases can also influence short-term direction, especially where they add to or challenge the current growth narrative.
Key releases and events
Wed 21 Jan: UK CPI
Thu 22 Jan: Australia Labour Force, Australia (December 2025)
Fri 23 Jan: UK flash PMIs (manufacturing and services)
Technical snapshot
GBPAUD continues to trade below its long-term moving average, with price action remaining in a downside direction since late November.
The long-term average flattened through September and has turned lower since October, with the price remaining below and showing recent signs of a greater gap between the price and the moving average.
Momentum has remained below neutral over recent months, with any retracements to the upside showing limited follow-through.
Daily ranges have narrowed compared with earlier swings, suggesting a consistent but controlled drop in price rather than impulsive movement.
With multiple data releases due across key regions, FX markets may remain sensitive to outcomes that differ from expectations.
Existing technical conditions suggest that reactions may vary by pair, with some markets consolidating while others could retain recent directional characteristics.
In 2025, the ASX 200 closed around 8,621 points and was up approximately 6% year to date (YTD) as of 19 December close. Market direction was most sensitive to Reserve Bank of Australia (RBA) expectations, commodity prices and China-linked demand, and (to a lesser extent) moves in the Australian dollar (AUD). The index recovered from November’s pullback, but remained below October’s record close.
Key 2025 drivers included:
RBA policy expectations: Sentiment was shaped by shifting views on the timing and extent of rate moves. The November pullback reflected repricing towards a longer pause and higher uncertainty around whether the next move could be a hike rather than a cut, particularly as jobs and inflation data surprised.
Resources and China sensitivity: With a meaningful resources weight, the index responded to iron ore stability, strong gold prices and relative firmness in base metals. China data and any perceived policy support (including signals from the People’s Bank of China (PBOC)) remained important for the export backdrop. A relatively stable AUD also reduced currency-related noise for exporters.
Index composition and market structure: The ASX 200’s heavier tilt to materials and banks, and lower exposure to high-growth technology, meant it often lagged tech-led global rallies, but tended to hold up better when AI and growth valuations were questioned.
Corporate earnings: Reporting season outcomes influenced valuation support. In September’s half-year reporting season, around 33% of ASX 200 companies beat expectations, which helped underpin pricing around current levels.
Current state
The ASX 200 was roughly 5% below its late-October record high close of 9,094 points. After the November retracement, support around 8,400 appeared to hold and buying interest improved. The 50-day EMA near 8,730 (a prior consolidation area) was a commonly watched near-term reference, noting technical indicators can be unreliable.
What to watch in January
China and commodity demand: Growth, trade and any fresh stimulus inference from the PBOC may affect sentiment.
Domestic inflation and labour data: CPI and jobs prints are key inputs into RBA expectations.
Key levels and follow-through: The post-November rebound may need continued demand to sustain momentum.
Source: Trading View
What moved the Nikkei 225 in 2025?
In 2025, the Nikkei 225 traded around 39,200 points and was up approximately 21% year to date (YTD). Market direction was most sensitive to moves in the Japanese yen (JPY) and Bank of Japan (BOJ) communication, with the index consolidating after multi-decade highs. While broader signals remained constructive, consolidation can resolve either higher or lower.
Key influences included:
JPY movements and earnings translation: A weaker JPY can boost the reported value of overseas earnings for some exporters, although it may also increase input and import costs. The net impact often depends on company hedging practices and varies by sector, with effects most evident in export-heavy industries such as automotive, industrials and parts of technology manufacturing.
Gradual BOJ policy transition: The BOJ continued to step away from ultra-easy settings, but tightening was generally cautious. Markets largely priced a slow, conditional normalisation, which helped limit downside, even as policy headlines created bouts of volatility.
Corporate governance reforms: Ongoing improvements in capital efficiency and shareholder returns supported interest from overseas investors. Share buybacks, stronger balance-sheet discipline and improved return on equity (ROE) contributed to re-rating in parts of the market.
Global cyclical exposure: The Nikkei moved with shifts in global manufacturing sentiment and expectations for US growth, particularly during risk-on phases associated with AI-related capital spending.
Current state
After pushing to multi-decade highs earlier in the year, the Nikkei spent time consolidating but has remained structurally strong. Price sits above key long-term moving averages, and some technicians watch the 50-day exponential moving average (EMA) as a potential reference level (noting these indicators can be unreliable). Currency swings and shifting BOJ expectations were commonly cited as contributors to much of the second-half volatility, although pullbacks were generally met with buying interest.
What to watch in January for Japan
JPY volatility: Sharper yen moves, especially if driven by BOJ or Federal Reserve expectations, could quickly change exporter earnings assumptions.
BOJ communication: Small changes in language on inflation persistence or bond market operations may move sentiment.
Global growth data: US and China manufacturing and trade prints remain key inputs for an externally focused economy.
Three data levers dominate the US markets in February: growth, labour and inflation. Beyond those, policy communication, trade headlines and geopolitics can still matter, even when they are not tied to a scheduled release date.
Growth: business activity and trade
Early to mid-month indicators provide a read on whether US momentum is stabilising or softening into Q1.
Key dates
Advance monthly retail sales: 10 Feb, 8:30 am (ET) / 11 Feb, 12:30 am (AEDT)
Industrial Production and Capacity Utilisation: 18 Feb, 9:15 am (ET) / 19 Feb, 1:15 am (AEDT)
International Trade in Goods and Services: 19 Feb, 8:30 am (ET) / 20 Feb, 12:30 am (AEDT)
What markets look for
Markets will be watching new orders and output trends in PMIs to gauge underlying demand momentum. Export and import data will offer insights into global trade flows and domestic consumption patterns. Traders will also assess whether manufacturing and services sectors remain in expansionary territory or show signs of contraction.
Market sensitivities
Stronger growth can be associated with higher yields and a firmer USD, though inflation and policy expectations often dominate the rate response.
Softer activity can be associated with lower yields and improved risk appetite, depending on inflation, positioning, and broader risk conditions.
Labour conditions remain a direct input into rate expectations. The monthly NFP report, alongside the weekly jobless claims released every Thursday, is typically watched for signs of cooling or renewed tightness.
Key dates
Employment Situation (nonfarm payrolls, unemployment, wages): 6 Feb, 8:30 am (ET) / 7 Feb, 12:30 am (AEDT)
What markets look for
Markets will focus on headline payrolls to assess the pace of job creation, the unemployment rate for signals of labour market slack, and average hourly earnings as a gauge of wage pressures. A gradual cooling can support the idea that wage pressures are easing. Persistent tightness may push out expectations for policy easing.
Market sensitivities
Payroll surprises frequently move Treasury yields and the USD quickly, with knock-on effects for equities and commodities.
Inflation releases remain a key input into expectations for the Fed’s policy path.
Key dates
Consumer Price Index (CPI): 11 Feb, 8:30 am (ET) / 12 Feb, 12:30 am (AEDT)
Personal Income and Outlays, including the PCE price index): 20 Feb, 8:30 am (ET) / 21 Feb, 12:30 am (AEDT)
Producer Price Index (PPI): 27 Feb, 8:30 am (ET) / 28 Feb, 12:30 am (AEDT)
What markets look for
Producer prices can act as a pipeline signal. CPI and the PCE price index can help confirm whether inflation pressures are broadening or fading at the consumer level.
How rates and the USD can react
Cooling inflation can support lower yields and a softer USD, though market reactions can vary.
Sticky inflation can keep upward pressure on yields and financial conditions, especially if it shifts policy expectations.
There is no scheduled February FOMC meeting, but speeches and other Fed communication, as well as the minutes cycle from prior meetings, can still influence expectations around the policy path. Without a decision event, markets often react to shifts in tone, or renewed emphasis on inflation persistence and labour conditions.
Trade and geopolitics
Trade flows and energy markets can remain secondary, and the risk profile is typically headline-driven rather than linked to scheduled releases.
The Office of the United States Trade Representative has published fact sheets and policy updates (including on US-India trade engagement) that may occasionally influence sector and supply-chain sentiment at the margin, depending on the substance and market focus at the time.
Separately, volatility tied to Middle East developments and any impact on energy pricing can filter into inflation expectations and bond yields. Weekly petroleum market data from the US Energy Information Administration is one input that markets often monitor for near-term signals.
For over 110 years, the Federal Reserve (the Fed) has operated at a deliberate distance from the White House and Congress.
It is the only federal agency that doesn’t report to any single branch of government in the way most agencies do, and can implement policy without waiting for political approval.
These policies include interest rate decisions, adjusting the money supply, emergency lending to banks, capital reserve requirements for banks, and determining which financial institutions require heightened oversight.
The Fed can act independently on all these critical economic decisions and more.
But why does the US government enable this? And why is it that nearly every major economy has adopted a similar model for their central bank?
The foundation of Fed independence: the panic of 1907
The Fed was established in 1913 following the Panic of 1907, a major financial crisis. It saw major banks collapse, the stock market drop nearly 50%, and credit markets freeze across the country.
At the time, the US had no central authority to inject liquidity into the banking system during emergencies or to prevent cascading bank failures from toppling the entire economy.
J.P. Morgan personally orchestrated a bailout using his own fortune, highlighting just how fragile the US financial system had become.
The debate that followed revealed that while the US clearly needed a central bank, politicians were objectively seen as poorly positioned to run it.
Previous attempts at central banking had failed partly due to political interference. Presidents and Congress had used monetary policy to serve short-term political goals rather than long-term economic stability.
So it was decided that a stand-alone body responsible for making all major economic decisions would be created. Essentially, the Fed was created because politicians, who face elections and public pressure, couldn’t be relied upon to make unpopular decisions when needed for the long-term economy.
Although the Fed is designed to be an autonomous body, separate from political influence, it still has accountability to the US government (and thereby US voters).
The President is responsible for appointing the Fed Chair and the seven Governors of the Federal Reserve Board, subject to confirmation by the Senate.
Each Governor serves a 14-year term, and the Chair serves a four-year term. The Governors' terms are staggered to prevent any single administration from being able to change the entire board overnight.
Beyond this “main” board, there are twelve regional Federal Reserve Banks that operate across the country. Their presidents are appointed by private-sector boards and approved by the Fed's seven Governors. Five of these presidents vote on interest rates at any given time, alongside the seven Governors.
This creates a decentralised structure where no single person or political party can dictate monetary policy. Changing the Fed's direction requires consensus across multiple appointees from different administrations.
The case for Fed independence: Nixon, Burns, and the inflation hangover
The strongest argument for keeping the Fed independent comes from Nixon’s time as president in the 1970s.
Nixon pressured Fed Chair Arthur Burns to keep interest rates low in the lead-up to the 1972 election. Burns complied, and Nixon won in a landslide. Over the next decade, unemployment and inflation both rose simultaneously (commonly referred to now as “stagflation”).
By the late 1970s, inflation exceeded 13 per cent, Nixon was out of office, and it was time to appoint a new Fed chair.
That new Fed chair was Paul Volcker. And despite public and political pressure to bring down interest rates and reduce unemployment, he pushed the rate up to more than 19 per cent to try to break inflation.
The decision triggered a brutal recession, with unemployment hitting nearly 11 per cent.
But by the mid-1980s, inflation had dropped back into the low single digits.
Pre-Volcker era inflation vs Volcker era inflation | FRED
Volcker stood firm where non-independent politicians would have backflipped in the face of plummeting poll numbers.
The “Volcker era” is now taught as a masterclass in why central banks need independence. The painful medicine worked because the Fed could withstand political backlash that would have broken a less autonomous institution.
Are other central banks independent?
Nearly every major developed economy has an independent central bank. The European Central Bank, Bank of Japan, Bank of England, Bank of Canada, and Reserve Bank of Australia all operate with similar autonomy from their governments as the Fed.
However, there are examples of developed nations that have moved away from independent central banks.
In Turkey, the president forced its central bank to maintain low rates even as inflation soared past 85 per cent. The decision served short-term political goals while devastating the purchasing power of everyday people.
Argentina's recurring economic crises have been exacerbated by monetary policy subordinated to political needs. Venezuela's hyperinflation accelerated after the government asserted greater control over its central bank.
The pattern tends to show that the more control the government has over monetary policy, the more the economy leans toward instability and higher inflation.
Independent central banks may not be perfect, but they have historically outperformed the alternative.
Turkey’s interest rates dropped in 2022 despite inflation skyrocketing
Why do markets care about Fed independence?
Markets generally prefer predictability, and independent central banks make more predictable decisions.
Fed officials often outline how they plan to adjust policy and what their preferred data points are.
Currently, the Consumer Price Index (CPI), Personal Consumption Expenditures (PCE) index, Bureau of Labor Statistics (BLS) monthly jobs reports, and quarterly GDP releases form expectations about the future path of interest rates.
This transparency and predictability help businesses map out investments, banks to set lending rates, and everyday people to plan major financial decisions.
When political influence infiltrates these decisions, it introduces uncertainty. Instead of following predictable patterns based on publicly released data, interest rates can shift based on electoral considerations or political preference, which makes long-term planning more difficult.
The markets react to this uncertainty through stock price volatility, potential bond yield rises, and fluctuating currency values.
The enduring logic
The independence of the Federal Reserve is about recognising that stable money and sustainable growth require institutions capable of making unpopular decisions when economic fundamentals demand them.
Elections will always create pressure for easier monetary conditions. Inflation will always tempt policymakers to delay painful adjustments. And the political calendar will never align perfectly with economic cycles.
Fed independence exists to navigate these eternal tensions, not perfectly, but better than political control has managed throughout history.
That's why this principle, forged in financial panics and refined through successive crises, remains central to how modern economies function. And it's why debates about central bank independence, whenever they arise, touch something fundamental about how democracies can maintain long-term prosperity.
February opens with a policy-heavy tone led by Australia’s RBA decision, while Japan provides the core macro anchors through GDP and inflation updates. In contrast, China’s calendar lightens due to the Spring Festival, shifting attention to liquidity and policy headlines. Across the region, a firmer USD and softer metals continue to frame cross-asset performance, especially for commodity-linked currencies.
Australia: RBA
Australia begins February with a policy-driven focus as the Reserve Bank of Australia (RBA) delivers its monetary policy decision, setting the month’s initial tone for rates, currency, and equities. While markets had priced around a 70% chance of a hike as of 30 January, expectations remain highly sensitive to evolving data and RBA commentary.
Key dates
RBA Monetary Policy Decision: 2:30 pm, 3 February (AEDT)
Wage Price Index (WPI): 11:30 am, 18 February (AEDT)
Labour Force: 11:30 am, 19 February (AEDT)
What markets look for
Aussie traders will gauge whether the RBA reinforces a data‑dependent stance or shifts more decisively toward tightening.
Wage and labour data will be central in testing inflation persistence, while the next CPI reading anchors positioning heading into March. A balanced or mildly hawkish tone could keep short‑term yields elevated and limit downside in the AUD.
Market sensitivities
AUD and ASX performance will primarily reflect the RBA’s policy tone and broader USD momentum, while resource‑linked sectors should continue to track metals and bulk commodity trends.
The February earnings season, highlighted by CBA and CSL (11 Feb), BHP (17 Feb), and Rio Tinto (19 Feb), is also set to reintroduce stock‑specific drivers once the initial policy focus fades.
Australia’s February Consumer Price Index (CPI) release will be a key post‑RBA event, offering the clearest read on whether domestic inflation pressures are easing in line with the central bank’s expectations.
The data following the RBA’s February policy decision and could quickly reset rate path probabilities reflected in ASX futures pricing.
Key dates
Consumer Price Index (CPI): 11:30 am, 25 February (AEDT)
What markets look for
Markets will focus on whether trimmed‑mean and services inflation components show further moderation.
Persistent strength in non‑tradables or wage‑related sectors could reinforce expectations for additional tightening later in Q1, while a softer headline would support the view that policy rates have peaked.
Market sensitivities
A stronger‑than‑expected CPI print would likely lift front‑end yields and support the AUD, while a downside surprise could weigh on the currency and flatten the yield curve.
Equity sentiment may diverge and financials could find relief from a pause bias, whereas rate‑sensitive sectors like real estate and consumer discretionary would benefit most from a cooler inflation read.
Japan’s Q4 GDP release will be a key reference point for how firmly the recovery is progressing after recent quarters of uneven growth momentum. Arriving ahead of the Tokyo CPI print, it helps shape expectations for domestic demand, external trade performance, and how much scope policymakers have to adjust their stance without derailing activity.
Key dates
Q4 GDP: 11:50 pm, 15 February (GMT)/ 10:50 am, 16 February (AEDT)
What markets look for
Investors pay close attention to the balance between consumption, business investment, and net exports to judge whether growth is broad‑based or narrowly supported.
A stronger‑than‑expected print tends to reinforce confidence in Japan’s expansion story, while a weaker outcome can revive concerns about stagnation and delay expectations for any meaningful policy shift.
Japan: Tokyo CPI
Tokyo’s latest inflation reading shows headline CPI easing to 1.5% year‑on‑year in January from 2.0% in December 2025, dipping further below the recent peaks seen during the post‑pandemic upswing.
The CPI release offers one of the timeliest reads on Japan’s inflation pulse and is closely watched as a lead indicator for nationwide price trends.
Coming late in the month, it serves as a check on whether the recent inflation upswing is sustaining at levels consistent with policymakers’ many objectives.
Tokyo CPI: 11:30 pm, 26 February (GMT)/ 10:30 am, 27 February (AEDT)
What markets look for
Attention centres on core measures that strip out volatile components, alongside services prices, to see whether underlying inflation is holding near target or drifting lower.
A firmer profile strengthens the case that Japan is exiting its low‑inflation regime, while softer readings suggest that price pressures remain fragile and dependent on external factors.
Market sensitivities
A hotter‑than‑expected Tokyo CPI print can push Japanese yields higher and lend support to the yen, often translating into pressure on exporter‑heavy equity names.
Conversely, a softer outcome tends to ease yield pressures, weaken the yen, and provide some relief to equity sectors that benefit from a more accommodative policy backdrop.
China’s February macro calendar is structurally lighter due to Spring Festival timing.
The National Bureau of Statistics of China notes that some releases are adjusted around Spring Festival timing, with the February PMI scheduled for early March leaving markets without major domestic data anchors for much of the month.
Key dates
Spring Festival: 17 February to 3 March
What markets look for
Markets turn their focus to policy signals out of Beijing — think targeted stimulus or liquidity injections, as well as shifts in funding conditions and flows responding to global risk sentiment or USD moves.
Trade and tariff rhetoric, or surprise consumption measures like expanded trade-in subsidies and festive spending incentives recently flagged by the Ministry of Commerce, often spark sharper reactions than the usual data releases.
Market sensitivities
CNH and CNY pairs turn more reactive to USD flows and external headlines, often amplifying volatility in regional equities, commodity currencies like AUD, and China-exposed EM assets.
Holiday-thinned liquidity elevates headline risk, particularly in materials (iron ore, copper), tech hardware supply chains, and regional financials, where policy surprises or US tariff updates can trigger 1–2% daily index swings.