Go further with GO Markets
Trade smarter with a trusted global broker. Low spreads, fast execution, powerful platforms, and award-winning customer support.
For beginners
Just getting
started?
Explore the basics and build your confidence.
For intermediate traders
Take your
strategy further
Access advanced tools for deeper insights than ever before.
Professionals
For professional
traders
Discover our dedicated offering for professionals and sophisticated investors.
Get started with GO Markets
Whether you’re new to markets or trading full time, GO Markets has an account tailored to your needs.

Trusted by traders worldwide
Since 2006, GO Markets has helped hundreds of thousands of traders to pursue their trading goals with confidence and precision, supported by robust regulation, client-first service, and award-winning education.


Explore more from GO Markets
CFD Markets
Trade CFDs across forex, indices, shares, commodities, metals, ETFs and more.
Platforms & tools
Trading accounts with seamless technology, award-winning client support, and easy access to flexible funding options.
Academy
Learn the skills, strategies, and mindset behind long-term trading success.
Accounts & pricing
Compare account types, view spreads, and choose the option that fits your goals.

Go further with
GO Markets.
Explore thousands of tradable opportunities with institutional-grade tools, seamless execution, and award winning support. Opening an account is quick and easy.
News & insights
Powerful tools for every trading style and preference.

New U.S. Sanctions on Russia as Putin Conducts Nuclear Tests
The U.S. has imposed new sanctions on Russia's two largest oil companies, Rosneft and Lukoil, after planned peace talks between Trump and Putin collapsed on Wednesday.
Oil prices spiked 3% after the announcement, with Brent crude hitting $64 per barrel.
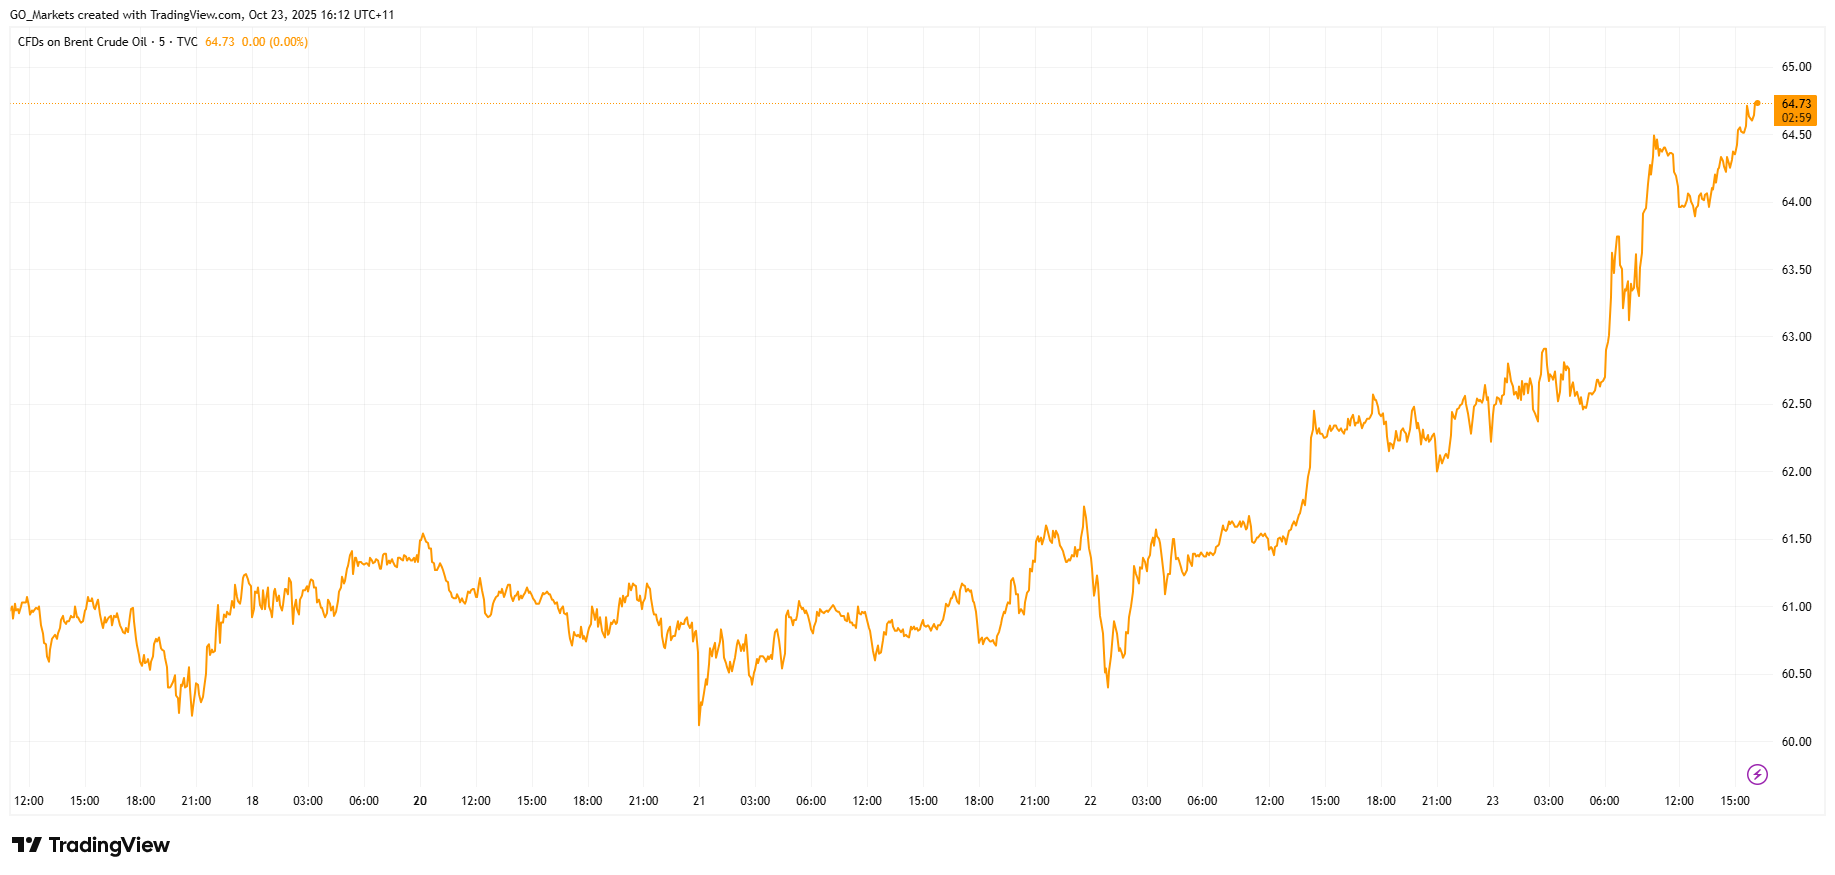
The targeted companies are among the world's largest energy exporters, collectively shipping about three million barrels of oil daily and accounting for nearly half of Russian production.
The sanctions build on recent European measures, as the UK targeted the same companies last week and the EU approved its own sanctions package on Wednesday.
In a show of force coinciding with the new sanctions, Putin supervised strategic nuclear exercises on Wednesday involving intercontinental ballistic missile launches from land and submarine platforms.
While the Kremlin emphasised these were routine drills, the highly coincidental timing is notable.
For markets, the key question now is whether secondary sanctions will follow, and if Trump’s enforcement remains strict. Traders will watch closely for any TACO signals that see Trump ease pressure in an attempt to restart negotiations.
Historic PM Wasting No Time on Celebrations
Sanae Takaichi made history this week as Japan's first female Prime Minister. The 64-year-old conservative leader, dubbed the "Iron Lady,” is already rolling out an aggressive policy agenda that could reshape Japan's economic and geopolitical position.
Her first major move is an economic stimulus package expected to exceed US $92 billion. The package includes abolishing the provisional gasoline tax and raising the tax-free income threshold from ¥1.03 million ($6,800), moves designed to put more money in consumers' pockets and battle inflation.

Her next move will come when Trump arrives in Tokyo next week, as the Japanese government is finalising a purchase package including Ford F-150 pickup trucks, US soybeans, and liquefied natural gas as sweeteners for trade talks.
Takaichi has campaigned on being a champion for expansionary fiscal policy, monetary easing, and heavy government investment in strategic sectors, including AI, semiconductors, biotechnology, and defence.
Critical Workers to Miss First Paycheck Due to Shutdown
The U.S. government shutdown is on the verge of creating a crisis for aviation safety, with 60,000 workers set to miss their first full paycheck this week.
These essential workers, who earn an average of $40,000 annually, already saw shortened paychecks last week. By Thursday, many will receive pay stubs showing zero compensation for the coming period, forcing impossible choices between basic necessities and reporting to work.
During the last extended shutdown, TSA sick-call rates tripled by Day 31, causing major delays at checkpoints and reduced air traffic in major hubs like New York — disruptions which are directly attributed to pressuring the end of the previous shutdown.
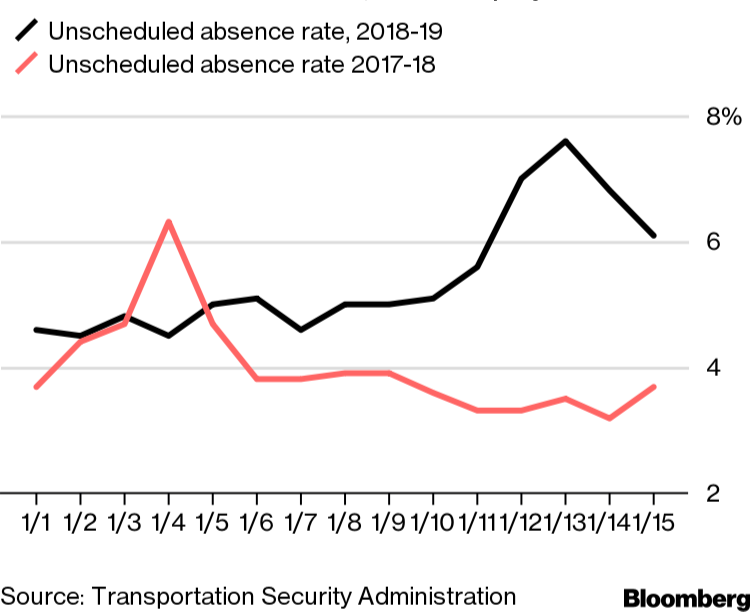
The National Air Traffic Controllers Association warns that similar pressures are building, with many workers soon to be facing a decision between attending their shift or putting food on the table.

S&P 500 and ASX Rally as Big Banks Drive Markets
Both the S&P 500 and ASX have rallied on the back of stronger-than-expected major bank earnings reports on both sides of the Pacific.
In the US, Bank of America reported a 31% year-over-year increase in earnings per share at $1.06, exceeding Wall Street's estimate of $0.95. Meanwhile, Morgan Stanley delivered a record-breaking quarter with EPS of $2.80, a nearly 49% increase from the same period last year.
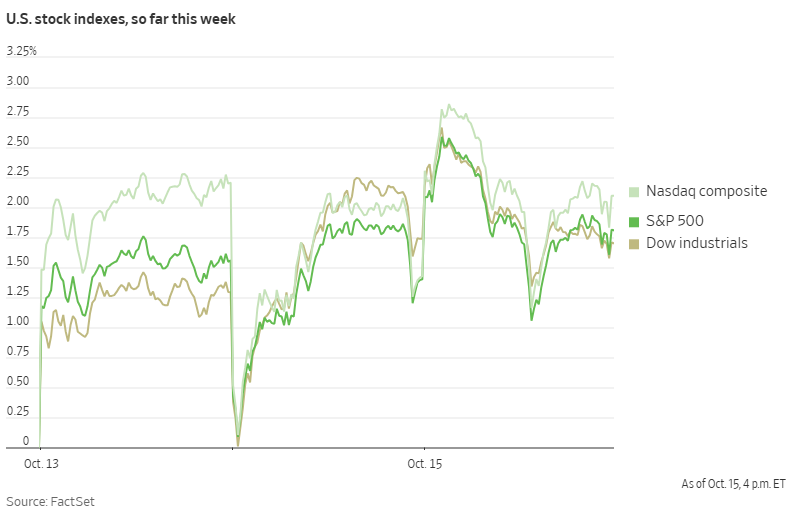
On the Australian front, the benchmark ASX 200 leapt 1.03% to 8990.99, with all four major Australian banks playing a major role. CBA closed 1.45% higher, Westpac 1.98%, NAB 1.87%, and ANZ 0.53%.
These strong bank results indicate broader economic strength, despite recent concerns about US-China trade tensions. US Treasury Secretary Scott Bessent emphasised that Washington did not want to escalate trade conflict with China and noted that President Trump is ready to meet Chinese President Xi Jinping in South Korea later this month.
With the third-quarter earnings season just getting underway, these early positive results from financial institutions could prove as the start of continued market strength through to the end of the year.
U.S. Government Shutdown Likely to Last Into November
Washington remains gridlocked as the U.S. enters its 16th day of shutdown. With no signs of compromise on the horizon, it appears increasingly likely the shutdown will extend into November and could even compromise the Thanksgiving holiday season.
Treasury Secretary Scott Bessent has warned "we are starting to cut into muscle here" and estimated "the shutdown may start costing the US economy up to $15 billion a day."
The core issue driving the shutdown is healthcare policy, specifically the expiring Affordable Care Act subsidies. Democrats are demanding these subsidies be extended, while Republicans argue this issue can be addressed separately from government funding.
The Trump administration has taken steps to blunt some of the shutdown's immediate impact, including reallocating funds to pay active-duty soldiers this week and infusing $300 million into food aid programs.
However, House Speaker Mike Johnson has emphasised these are merely "temporary fixes" that likely cannot be repeated at the end of October when the next round of military paychecks is scheduled.
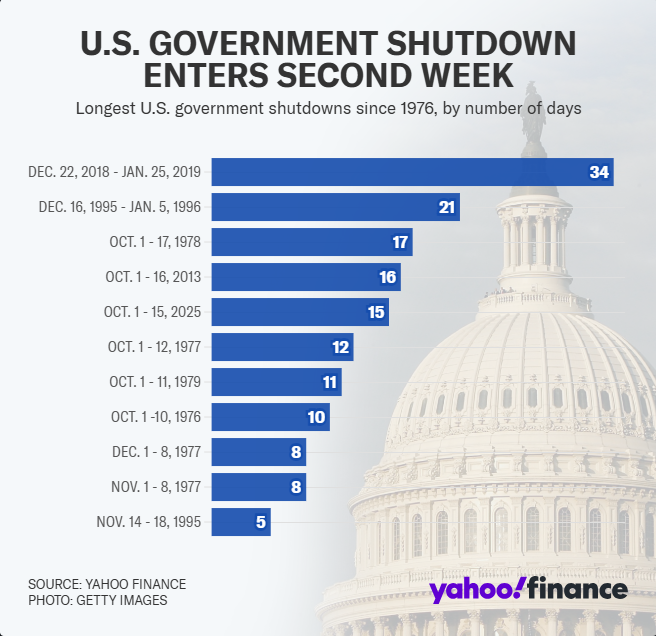
By the end of this week, this shutdown will become the third-longest in U.S. history. If it continues into November 4th, it will surpass the 34-day shutdown of 2018-2019 to become the longest government shutdown ever recorded.
This prolonged shutdown adds another layer of volatility to markets. While previous shutdowns have typically had limited long-term market impacts, the unprecedented length and timing of this closure, combined with its expanding economic toll, warrant closer attention as we move toward November.
Trump Announces Modi Has Agreed to Stop Buying Russian Oil
Yesterday, Trump announced that Indian Prime Minister Narendra Modi has agreed to stop purchasing Russian oil. He stated that Modi assured him India would halt Russian oil imports "within a short period of time," describing it as "a big step" in efforts to isolate Moscow economically.
The announcement comes after months of trade tensions between the US and India. In August, Trump imposed 50% tariffs on Indian exports to the US, doubling previous rates and specifically citing India's Russian oil purchases as a driving factor.
India has been one of Russia's top oil customers alongside China in recent years. Both countries have taken advantage of discounted Russian oil prices since the start of the Ukraine invasion.
Analysis suggests India saved between $2.5 billion to $12.6 billion since 2022 by purchasing discounted Russian crude compared to other sources, helping support its growing economy of 1.4 billion people.
Trump suggested that India's move would help accelerate the end of the Ukraine war, stating: "If India doesn't buy oil, it makes it much easier." He also mentioned his intention to convince China to follow suit: "Now I've got to get China to do the same thing."
The Indian embassy in Washington has not yet confirmed Modi's commitment. Markets will be closely watching for official statements from India and monitoring oil trading patterns in the coming weeks to assess the potential impact on global energy flows and prices.
Chart of the Day - Gold futures CFD (XAUUSD)

Most traders understand EA portfolio balance through the lens of traditional risk management — controlling position sizes, diversifying currency pairs, or limiting exposure per trade.
But in automated trading, balance is about deliberately constructing a portfolio where different strategies complement each other, measuring their collective performance, and actively managing the mix based on those measurements.
The goal is to create a “book” of EAs that can help diversify performance over time, even when individual strategies hit rough patches.
A diversified mix of EAs across timeframes and assets can, in some cases, reduce reliance on any single strategy. This approach reduces dependency on any single EA’s performance, smooths your overall equity curve, and builds resilience across changing market conditions.
It’s about running the right mix, identifying gaps in your coverage, and viewing your automated trading operation as an integrated whole rather than a collection of independent systems.
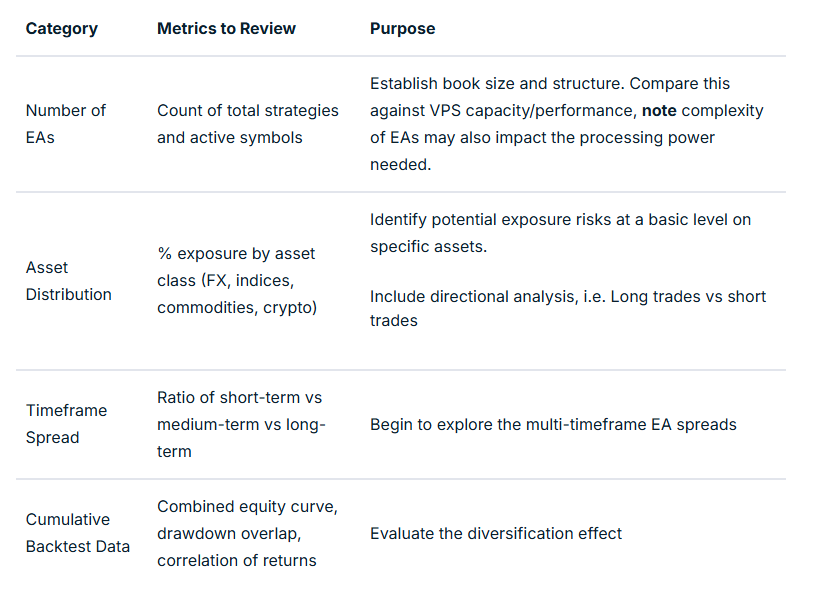
Basic Evaluation Metrics – Your Start Point
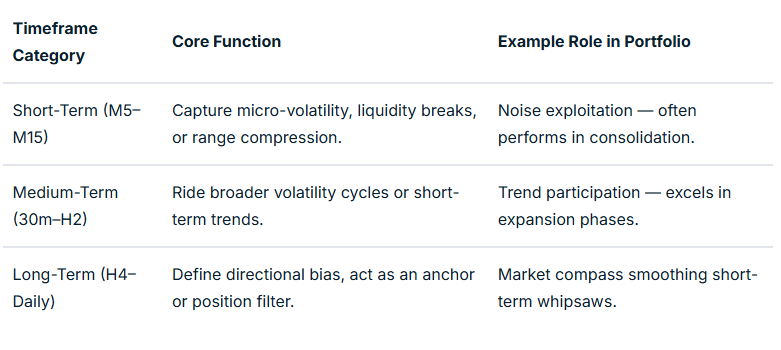
Temporal (timeframe) Balancing
When combined, a timeframe balance (even on the same model and instrument) can help flatten equity swings.
For example, a losing phase in a fast-acting M15 EA can often coincide with a profitable run in an H4 trend model.
Combining this with some market regime and sessional analysis can be beneficial.
Asset Balance: Managing Systemic Correlation Risk
Running five different EAs on USDJPY might feel diversified if each uses different entry logic, even though they share the same systemic market driver.
But in an EA context, correlation measurement is not necessarily between prices, but between EA returns (equity changes) relating to specific strategies in specific market conditions.
Two EAs on the same symbol might use completely different logic and thus have near-zero correlation.
Conversely, two EAs on a different symbol may feel as though they should offer some balance, but if highly correlated in specific market conditions may not achieve your balancing aim.
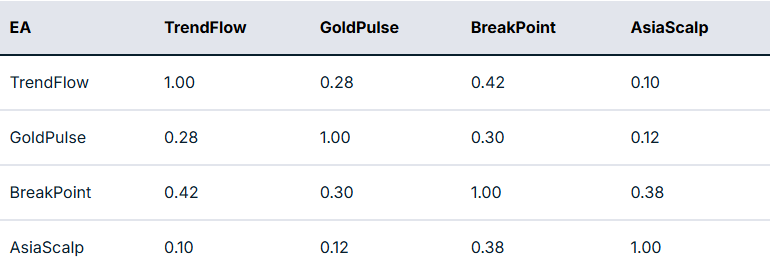
In practical terms, the next step is to take this measurement and map it to potential actionable interventions.
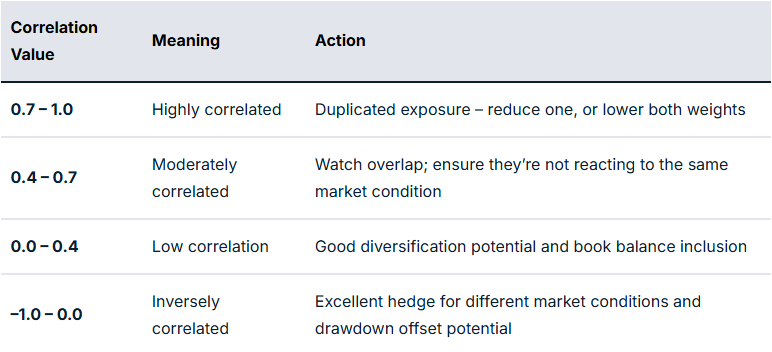
For example, if you have a EURUSD Trend EA and a GBPUSD Breakout EA with a correlation of 0.85, they are behaving like twins in performance related to specific market circumstances. And so you may want to limit exposure to some degree if you are finding that there are many relationships like this.
However, if your gold mean reversion EA correlates 0.25 compared to the rest of your book, this may offer some balance through reducing portfolio drawdown overlap.
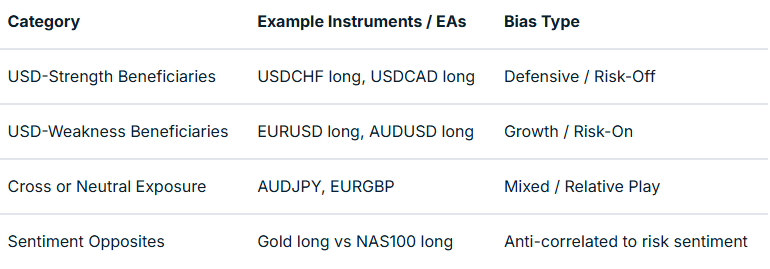
Directional and Sentiment Balance
Markets are commonly described as risk-on or risk-off. This bias at any particular time is very likely to impact EA performance, dependent on how well balanced you are to deal with each scenario.
You may have heard the old market cliché of “up the staircase and down the elevator shaft” to describe how prices may move in alternative directions. It does appear that optimisation for each direction, rather than EAs that trade long and short, may offer better outcomes as two separate EAs rather than one catch-all.
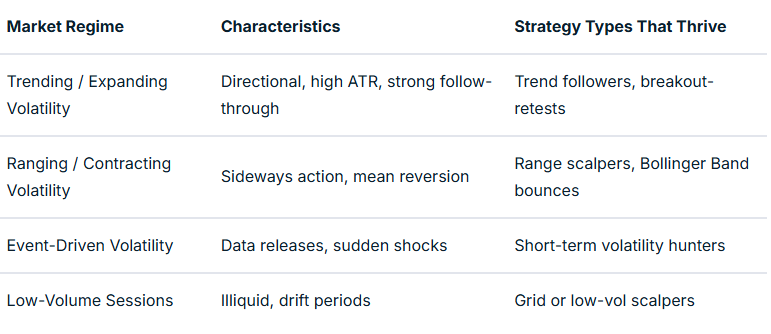
Market Regime and Volatility Balance
Trend and volatility states can have a profound impact on price action, whether as part of a discretionary or EA trading system. Much of this has a direct relationship to time of day, including the nature of individual sessions.
We have a market regime filter that incorporates trend and volatility factors in many EAs to account for this. This can be mapped and tested on a backtest and in a live environment to give evidence of strategy suitability for specific market conditions.
For example, mean reversion strategies may work well in the Asian session but less so in strongly trending markets and the higher volatility of the early part of the US session.
As part of balancing, you are asking questions as to whether you actually have EA strategies suited to different market regimes in place, or are you using these together to optimise book performance?
The table below summarises such an approach of regime vs market mapping:
Multi-Level Analysis: From Composition to Interaction
Once your book is structured, the challenge is to turn it into something workable. An additional layer of refinement that turns theory and measurement into something meaningful in action is where any difference will be made.
This “closing the circle” is based on evidence and a true understanding of how your EAs are behaving together. It is the step that takes you to the point where automation can begin to move to the next level.
Mapping relationships with robust and detailed performance evaluation will take time to provide evidence that these are actually making a difference in meeting balancing aims.
To really excel, you should have systems in place that allow ongoing evaluation of the approaches you are using and advise of refinements that may improve things over time.
What Next? – Implementing Balance in Practice
Theory must ultimately translate into an executable EA book. A plan of action with landmarks to show progress and maintain motivation is crucial in this approach.
Defining classification tags, setting risk weights, and building monitoring dashboards are all worth consideration.
Advanced EA traders could also consider a supervisory ‘Sentinel’ EA, or ‘mothership’ approach, to enable or disable EAs dynamically based on underlying market metrics and external information integrated into EA coding decision-making.
Final Thoughts
A balanced EA portfolio is not generated by accident; it is well-thought-out, evidence-based and a continuously developing architecture. It is designed to offer improved risk management across your EA portfolio and improved trading outcomes.
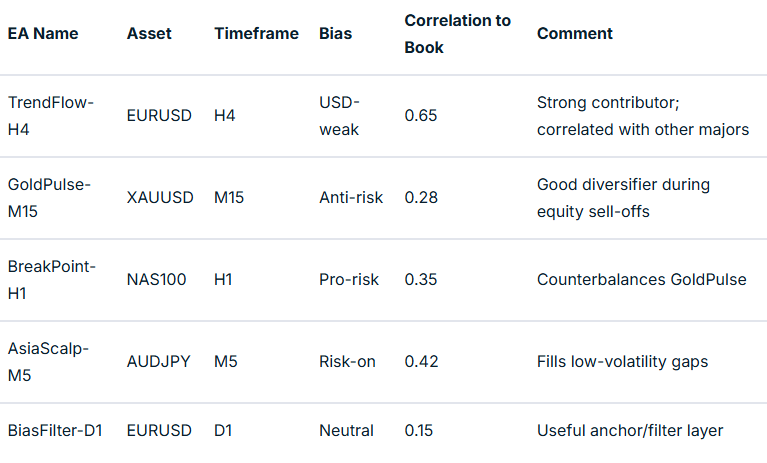
Your process begins with mapping your existing strategies by number, asset, and timeframe, then expands into analysing correlations, directional bias, and volatility regimes.
When you reach the stage where one EA’s drawdown is another’s opportunity, you are no longer simply trading models but managing a system of EA systems. To finish, ask yourself the question, “Could this approach contribute to improved outcomes over time?”. If your answer is “yes,” then your mission is clear.
If you are interested in learning more about adding EAs to your trading toolbox, join the new GO EA Programme (coming soon) by contacting [email protected].