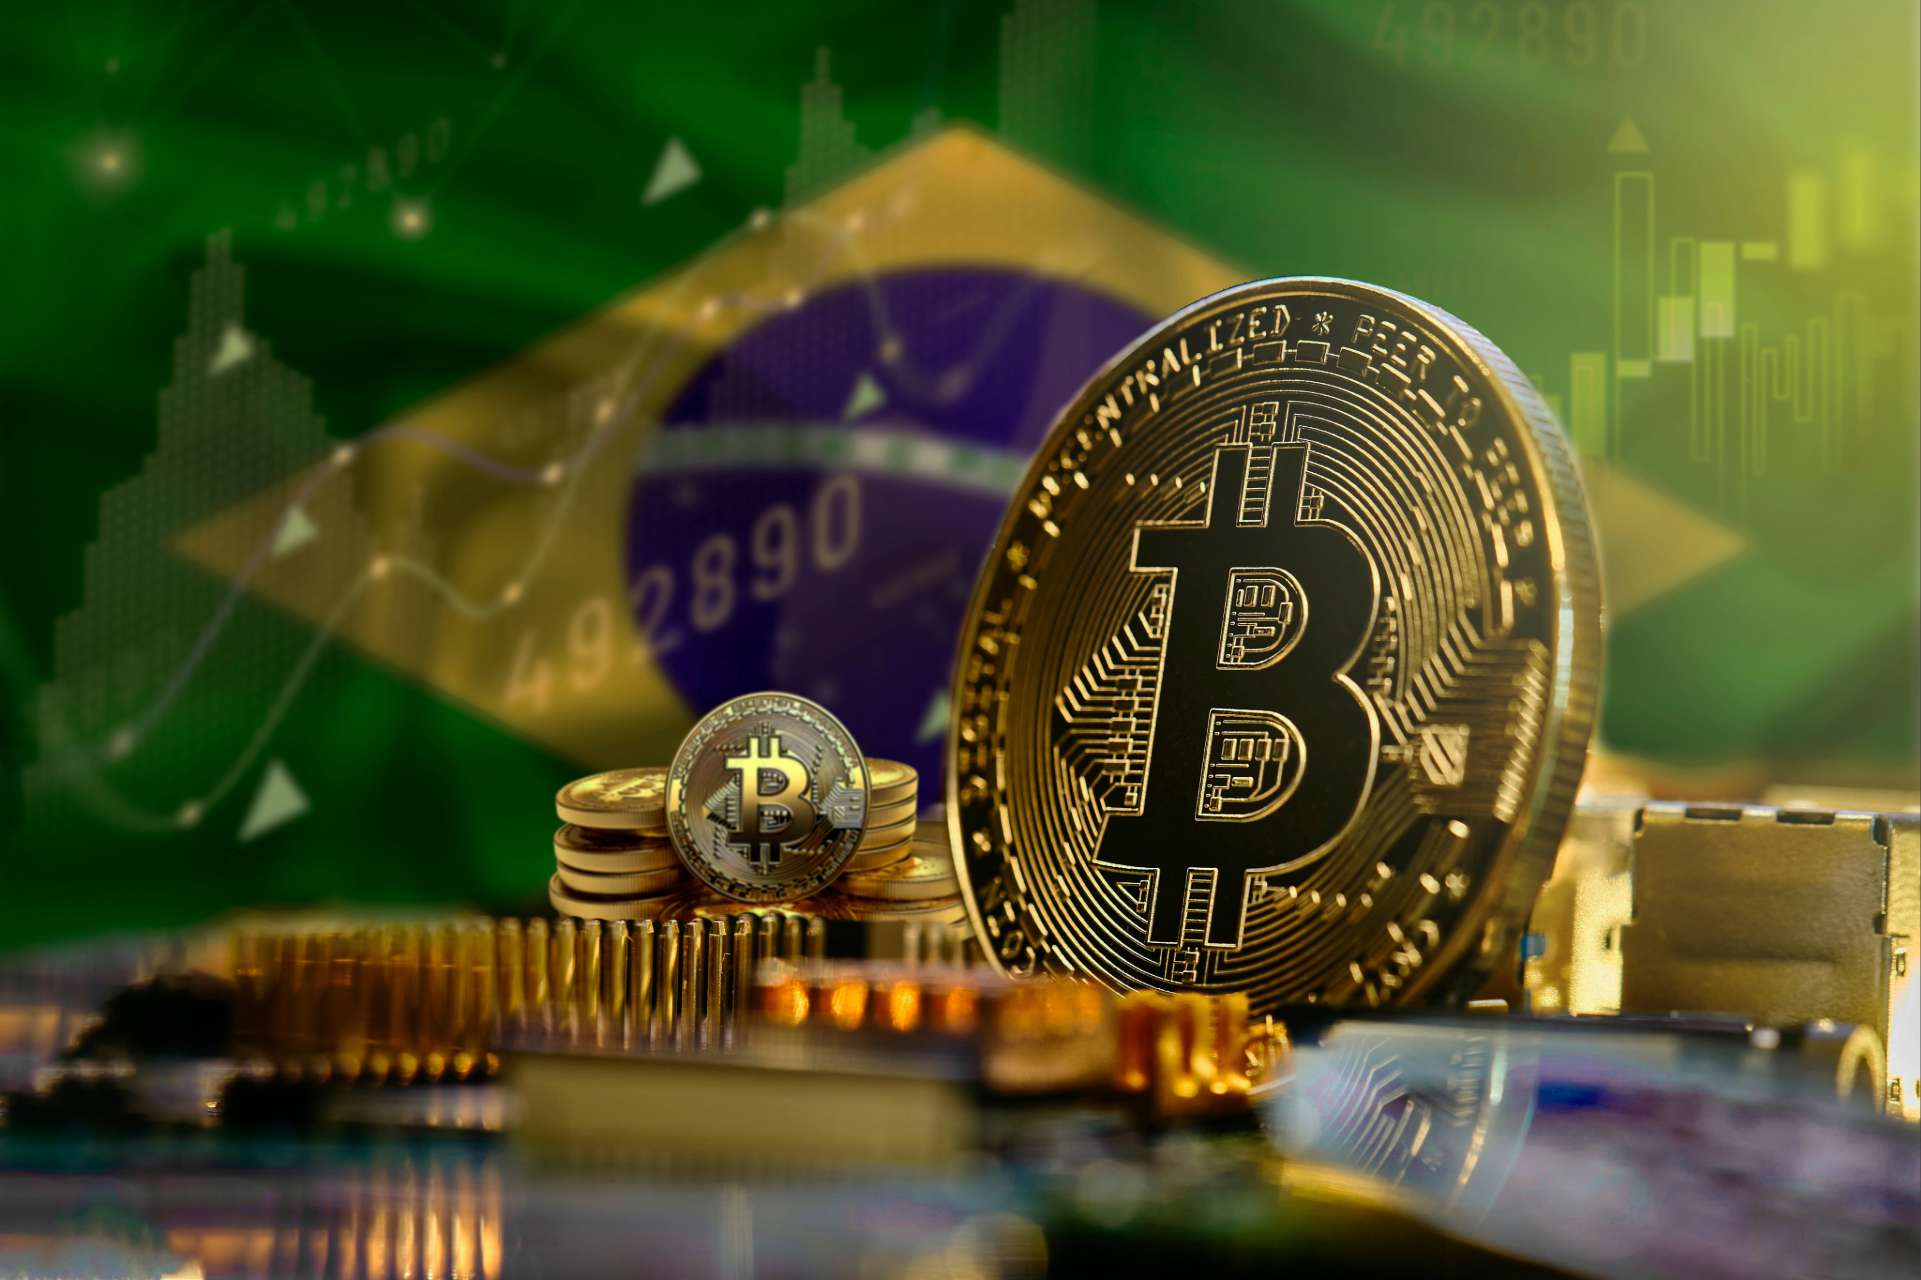
Bitcoin, the currency of tomorrow, a new age currency, has seen some severe ups and downs over the last few years. From reaching highs of nearly 70,000 dollars to dropping to lows of 17,000 the volatility and action around the cryptocurrency has been startling. Even compared to other traditional currencies the range and volatility of the price has been far more aggressive.
In fact, when compared to other more volatile tradable assets such as indices and equities, Bitcoin still stacks up with how volatile it is. For traders this is an important aspect to consider when deciding what to trade. Recent Chronology Early on, there was a thought that Bitcoin would become a hedge against inflation, or an alternative to Gold or Oil.
With the recent wave of record high inflation that has swept up much of the world the leading cryptocurrency failed this test, and this proved to be wishful thinking. In fact, Bitcoin showed itself to be quite the oppositive of a hedge and was rather much more aligned with growth assets such as the Nasdaq and the technology sector. Prior to May 2022, the Nasdaq and Bitcoin has a correlation of 0.82 out of 1.
In addition, with still so much unknown about how governments and Central Banks will come to treat the cryptocurrency and what regulations may be implemented there is a lot of uncertainty about how market regulation will affect the supply and demand. The chart indicates just how correlated the Nasdaq and Bitcoin were, sharing similar peaks in mid-November 2021 and following very similar price action until July 2022. However, after July there has been a shift in the correlation.
Today, Bitcoin is neither correlated strongly with either Gold or the NASDAQ and has carved out a niche for itself. Whilst the Nasdaq has continued to fall, Bitcoin has seemingly found its bottom. The price of Bitcoin has reclaimed its 50-day moving average which is its short-term support, and the price looks like it may continue to move up.
The range of Bitcoin has also become much tighter indicates, that the overall volatility has reduced and that the price has reached some level of equilibrium showing that neither the buy nor sell side has been able to gain any ascendancy. Due to how vicious the selling has been this may very well indicate the last of the selling. Importantly, even with the increased liquidity that has flowed into the asset from institutions and ETF’s, the price has still been able to find support and not fall int a liquidity vacuum.
Where it fits in? The recent price action brings up a more existential question which is where does Bitcoin fit in on the spectrum of safe to risky assets? Based on the information presented above there is no way that Bitcoin should at this stage be considered as a haven asset.
The price is still too volatile to be considered a safe asset. In addition, there is still so much unknown with how the price might react in the future, specifically regarding future regulations. On the other hand, Bitcoin has exhibited some characteristics of a safer asset, mainly, in recent times, its increasing resistance to high volatility and wild price fluctuations.
This may indicate that it is maturing as an asset. Therefore, at this stage of its life it may be best to classify Bitcoin in its own quasi- growth basket. When analysing Bitcoin for potential trading or investing opportunities it is important keep in mind that it does not act like a traditional asset.
By
GO Markets
The information provided is of general nature only and does not take into account your personal objectives, financial situations or needs. Before acting on any information provided, you should consider whether the information is suitable for you and your personal circumstances and if necessary, seek appropriate professional advice. All opinions, conclusions, forecasts or recommendations are reasonably held at the time of compilation but are subject to change without notice. Past performance is not an indication of future performance. Go Markets Pty Ltd, ABN 85 081 864 039, AFSL 254963 is a CFD issuer, and trading carries significant risks and is not suitable for everyone. You do not own or have any interest in the rights to the underlying assets. You should consider the appropriateness by reviewing our TMD, FSG, PDS and other CFD legal documents to ensure you understand the risks before you invest in CFDs. These documents are available here.
Latin America recorded $730 billion in crypto volume in 2025. Across the region, 57.7 million people now own some form of digital currency rankingslatam, a base that is growing faster than anywhere else in the world
As institutional capital arrives and regulation matures, these are the publicly traded names investors are watching closest.
Digital banking · 127M users across Brazil, Mexico and Colombia
Nubank could be one of the most direct listed proxies for LATAM's fintech and crypto boom. The company integrated cryptocurrency trading directly into its Nu app and partnered with Lightspark to embed the Bitcoin Lightning Network for faster and more cost-effective Bitcoin transactions.
In Q3 2025, revenue jumped 42% year-on-year to $4.17 billion, customer deposits rose 37% to $38.8 billion, and gross profit was up 35% to $1.81 billion.
The stock has returned roughly 36% over the past year and tripled the S&P 500's returns over the last three years. The company dominates Brazil, with over 60% of the adult population using Nubank.
Nu Holdings also recently secured conditional approval to launch Nubank N.A., a US national digital bank.However, the announcement triggered a pullback, with investors cautious about capital deployment timelines and expansion costs.
UBS has lowered its price target to $17.20, citing some market caution despite positive operational shifts.
What to watch
Credit quality trends in Brazil and Mexico.
Pace of USDC adoption via Nubank rewards.
US bank charter timeline and early cost disclosures.
2. MercadoLibre (NASDAQ: MELI)
E-Commerce/Fintech · 18 countries across Latin America
MercadoLibre is not a pure crypto play, but Mercado Pago (its fintech arm) has become one of the most important financial rails in LATAM. The company holds around 570 BTC on its balance sheet as a hedge against regional inflation, and has issued its own US dollar-pegged stablecoin, Meli Dólar.
Full year 2025 net revenue from Mercado Pago reached $12.6 billion, up 46% year-on-year, while total payment volume hit $278 billion, up 41%. Fintech monthly active users have grown close to 30% for ten consecutive quarters, and the credit portfolio nearly doubled to $12.5 billion year-on-year.
The catch for MercadoLibre is profitability. Overall margin compression of 5–6% is attributed to persistent investments in free shipping, credit card expansion, first-party commerce, and cross-border trade.
The stock has declined around 14.5% over the past six months, with the market repricing the stock around what management has framed as a deliberate investment phase heading into 2026.
The longer-term case remains compelling. Mercado Pago has introduced crypto-asset management and insurance products across its core markets, positioning it less as an e-commerce company and more as a full-scale digital bank with crypto infrastructure built in.
What to watch
Mercado Pago loan loss trends and credit portfolio quality.
Stablecoin integration and crypto volume through its payment network.
Whether the Argentina credit card launch can reach profitability.
Fintech/Bitcoin treasury · Brazil's first listed Bitcoin treasury company
Méliuz is the most direct equity expression of the corporate Bitcoin treasury trend in LATAM. In early 2025, Méliuz became the first publicly traded company in Latin America to formally adopt a Bitcoin treasury strategy, receiving shareholder approval to allocate cash reserves toward Bitcoin accumulation.
Rather than issuing cheap dollar-denominated debt to buy BTC, Méliuz uses share issuance and operational cash flow. The company also sells cash-secured put options on Bitcoin to generate yield, a playbook borrowed from Japanese Bitcoin treasury firm Metaplanet, keeping 80% of BTC holdings in cold storage
CASH3 essentially acts as a leveraged vehicle for BTC exposure, capturing upside intensely in bull cycles, but generating greater volatility on the way down, especially where debt is involved.
The stock surged approximately 170% in May 2025 following the announcement of the Bitcoin strategy.However, it has since pulled back to its April 2025 levels, broadly tracking Bitcoin's price action and highlighting the stock's volatility.
Pure-play Bitcoin treasury · LATAM's largest corporate Bitcoin holder
Where Méliuz is a fintech business that also holds Bitcoin, OranjeBTC is the opposite: a company whose entire purpose is Bitcoin accumulation.
The company listed on B3 in October 2025 through a reverse merger with education firm Intergraus, marking Brazil's first public debut of a firm whose business model centres entirely on Bitcoin accumulation.
OranjeBTC currently holds over 3,650 BTC and raised nearly $385 million in Bitcoin, with backing from notable investors including the Winklevoss brothers, Adam Back, FalconX, and Ricardo Salinas.
Its $210 million financing round was led by Itaú BBA, the investment arm of Brazil's largest bank, in a significant vote of institutional confidence.
In 2026, OBTC3 has fallen around 32% year-to-date, making it the hardest-hit of the two Brazilian Bitcoin treasury stocks.The stock hit an all-time high of 29.00 BRL on its listing day (October 7, 2025) and an all-time low of 6.06 BRL in February 2026.
It currently trades around 7.06 BRL, a steep discount to its debut, but one that closely mirrors Bitcoin's own pullback from peak levels.
OranjeBTC is the most volatile name on this list and should be treated as a high-beta Bitcoin vehicle. Liquidity is thinner than established names.
What to watch
Bitcoin per share trajectory.
Any capital raises or new BTC purchases.
Potential international listing ambitions.
How the market-value net asset value (mNAV) discount/premium evolves relative to Bitcoin's price.
5. Hashdex — HASH11 (B3: HASH11)
Crypto Asset Management · Brazil's leading crypto ETF issuer
Hashdex offers a different kind of exposure to crypto. Rather than a single company's balance sheet or business strategy, HASH11 is a diversified basket of crypto assets wrapped in the familiarity of a regulated Brazilian ETF structure.
Brazil hosts 22 ETFs offering full or partial exposure to crypto assets, with Hashdex funds attracting 180,000 investors and daily transaction volumes averaging R$50 million.
Hashdex launched the world's first spot XRP ETF (XRPH11) on Brazil's B3 in April 2025, tracking the Nasdaq XRP Reference Price Index and allocating at least 95% of net assets to XRP.
The company also operates single-asset ETFs for Bitcoin (BITH11), Ethereum (ETHE11) and Solana (SOLH11), alongside its flagship HASH11 multi-asset index fund.
In mid-2025, Hashdex launched a hybrid Bitcoin/Gold ETF (GBTC11) that dynamically adjusts allocations between the two assets.
For investors who want diversified crypto market exposure rather than single-asset risk, HASH11 is the most accessible on-ramp through Brazil's regulated equity infrastructure.
However, as a multi-asset crypto index, HASH11 is still subject to the broad performance of digital asset markets. And unlike the equity names on this list, there is no operating business creating independent value.
What to watch
Crypto market sentiment broadly.
Potential expansion of Hashdex products into the US market.
AUM growth as institutional adoption accelerates in Brazil.
Relative performance of HASH11 vs single-asset alternatives.
Institutional infrastructure is still in early innings — Deutsche Börse's Crypto Finance Group entered LATAM in early 2026, and local exchanges have opened over 200 BRL-denominated trading pairs since 2024. The pace of that buildout will set the tone for all five names.
Regulatory progress in Brazil, Mexico, and Chile is the key enabler for the next wave of capital. Any setbacks would hit the higher-beta names like OBTC3 and CASH3 hardest.
Stablecoin volume is the region's most reliable real-time signal. Despite a global slowdown in early 2025, LATAM still recorded $16.2 billion in trading volume between January and May, up 42% year-on-year. Watch whether that momentum holds — a reacceleration lifts all five; a reversal pressures them equally.
Latin America (LATAM) saw over $730 billion in crypto volume in 2025, a 60% year-on-year surge that made the region responsible for roughly 10% of global crypto activity.
In 2026, institutional players are starting to take the region seriously, regulation is crystallising, and the structural drivers from 2025 show no sign of fading. But the region is not a single story, and 2026 will test whether the current momentum is built on solid fundamentals or speculative optimism.
Quick facts
LATAM monthly active crypto users grew 18% year-on-year (YoY), three times faster than the US.
Argentina reached 12% monthly active user penetration, accounting for over a quarter of the region's crypto activity.
Over 90% of Brazilian crypto flows are now stablecoin-related.
Three LATAM countries rank in the global top 20: Brazil (5th), Venezuela (18th), Argentina (20th).
Peru's crypto app downloads grew 50% in 2025, with 2.9 million downloads.
From survival tool to financial infrastructure
Latin America did not embrace cryptocurrency because of speculation. It embraced it because traditional financial systems repeatedly failed ordinary people. Over the past 15 years, average annual inflation across the region's five largest economies ran at 13%, compared to just 2.3% in the US over the same period.
In Venezuela, it reached 65,000% in a single year. In Argentina, it exceeded 220% in 2024. For millions of people, holding savings in local currency was a slow act of self-destruction. Stablecoins became the natural response. Digital assets pegged to the US dollar offered a reliable store of value, borderless transferability, and access without a bank account.
Unlike in the West, where crypto is seen more as a speculative instrument, in LATAM it has become a necessary financial tool. However, adoption drivers are not entirely uniform across the region. Brazil and Mexico are institutional stories, driven by regulated market participation and established financial players.
Argentina and Venezuela remain store-of-value plays, with crypto serving as a direct hedge against fiat collapse. And Peru and Colombia are more yield-seeking markets, where crypto offers returns that traditional savings accounts cannot match.
How fast is LATAM adopting crypto?
LATAM’s on-chain crypto volume rose 60% year-on-year in 2025. The region has recorded nearly $1.5 trillion in cumulative volume since mid-2022, peaking at a record $87.7 billion in a single month in December 2024.
Monthly active crypto users across LATAM also grew 18% in 2025, three times faster than the US.
Stablecoins are the primary vehicle driving this adoption. Of the $730 billion received in 2025, $324 billion moved through stablecoin transactions, an 89% year-on-year surge. In Brazil, over 90% of all crypto flows are stablecoin-related, and in Argentina, stablecoins account for over 60% of activity.
Looking ahead, the Latin America cryptocurrency market is forecast to reach $442.6 billion by 2033, growing at a compound annual rate of 10.93% from 2025, according to IMARC Group.
For traders, the speed of adoption matters less as a headline than what is driving it: a region of 650 million people building parallel financial infrastructure in real time, with stablecoins as the foundation.
LATAM Crypto — By The Numbers
LATAM crypto by the numbers
Total on-chain volume
$730B
Total on-chain crypto volume received across LATAM in 2025 (~10% of global total)
+60% year-on-year
Stablecoin transaction volume
$324B
LATAM stablecoin transaction volume in 2025, reflecting surging demand for dollar-pegged assets
+89% year-on-year
Brazil's share of LATAM volume
~33%
Of all LATAM on-chain volume received by Brazil in 2025, making it the region's dominant crypto market
~250% annual growth
Annual remittance market
$142B
Annual remittance flows across Latin America, with an increasingly large share now settled in stablecoins
Stablecoin-settled
The institutional turn
For most of LATAM’s crypto history, adoption was bottom-up. Unbanked or underbanked retail users drove volumes through local exchanges. That picture is now changing at the top end of the market.
In February 2026, Crypto Finance Group, part of the leading global exchange operator Deutsche Börse Group, announced its expansion into Latin America, targeting banks, asset managers, and financial intermediaries seeking institutional-grade custody and trading infrastructure.
Traditional banks and fintechs are following suit. Nubank now rewards customers for holding USDC. Brazil's B3 exchange approved the world's first spot XRP and SOL ETFs, ahead of the US, in 2025. Centralised exchanges, including Mercado Bitcoin, NovaDAX, and Binance, have collectively listed over 200 new BRL-denominated trading pairs since early 2024.
In March 2025, Brazilian fintech Meliuz became the first publicly traded company in the country to launch a Bitcoin accumulation strategy, now holding 320 BTC.
“Crypto adoption in LatAm is already global-scale. What the market needs now is institutional-grade governance, and that’s exactly why we’re here,” — Stijn Vander Straeten, CEO of Crypto Finance Group
Crypto remittance use case
Latin America receives hundreds of billions of dollars annually from workers abroad, making remittances one of the most concrete and measurable crypto use cases in the region. Traditional transfer services charge an average of 6.2% per transaction. On a US$300 transfer, that is roughly US$20 in fees.
Blockchain-based infrastructure more broadly offers dramatic fee reductions. Bitcoin brings costs to around US$3.12 per US$100 transferred. While cheaper alternatives like XRP or Ethereum layer-2 infrastructure can reduce that to less than US$0.01.
For a migrant worker sending US$1,500 home to Peru, switching from a legacy bank saves more than the average Peruvian weekly wage in fees alone.
LATAM’s crypto regulatory environment
The variable that will most determine whether LATAM lives up to its 2026 potential is crypto regulation. And here, the picture is genuinely mixed.
Brazil leads the region with its Virtual Assets Law, which covers asset segregation, VASP licensing, AML/KYC requirements, and capital standards. It also implemented the Travel Rule for domestic VASP transfers, which came into force in February 2026. However, some more controversial proposals, including a US$100,000 cap on cross-border stablecoin transactions and a ban on self-custody wallet transfers, remain under active consultation.
Mexico's 2018 Fintech Law remains one of the world's earliest formal recognitions of virtual assets. Chile's 2023 Fintech Law established licences for exchanges, wallets, and stablecoin issuers, formally recognising digital assets as 'digital money.'
Bolivia reversed a decade-long crypto ban in June 2024 by authorising regulated digital asset transactions. Argentina introduced mandatory exchange registration in 2025. And El Salvador continues to expand tokenised economic initiatives despite removing Bitcoin's legal tender status.
Ten countries across the region now have formal crypto frameworks of some kind. But for traders, regulatory divergence remains a live risk, and given Brazil receiving nearly one-third of all LATAM crypto volume, any significant policy reversal there could have outsized consequences.
Brazil's institutional momentum is the most significant structural trend. With $318.8 billion in on-chain volume in 2025, Brazil effectively is the LATAM market.
The outcome of the Brazil stablecoin consultation could have a big influence. A restriction on foreign stablecoins in domestic payments would directly impact the most traded asset class in the region's dominant market.
Argentina is the volatility play. Monthly active user penetration of 12% and 5.4 million crypto app downloads in 2025 signal deep and growing retail engagement.
Colombia is an early-warning market to watch. The peso's 5.3% depreciation in 2025 and deepening fiscal crisis are driving stablecoin inflows in a pattern that mirrors Argentina's trajectory in earlier years. If Colombia's macro situation deteriorates further, crypto adoption could accelerate.
There is also an exchange concentration risk at play. Binance crypto exchange is the primary exchange for over 50% of LATAM crypto users. If the exchange faces any regulatory action, operational disruption, or competitive shock, it could have an outsized market impact.
Bottom line
Latin America's crypto market has entered a new phase. The structural drivers that caused initial crypto-demand in the region have not gone away: inflation, remittances, financial exclusion, and currency instability are all still at play.
What has changed is the layer being built on top of them. Institutional infrastructure, regulatory frameworks, corporate treasury adoption, and global exchange capital flowing into a region that was, until recently, largely self-contained.
Brazil's near-250% volume growth in 2025 and its position receiving nearly one-third of all LATAM crypto are the defining market developments. Its regulatory trajectory, stablecoin policy decisions, and ETF pipeline will effectively set the tone for the region in 2026.
For traders, the headline growth figures are real, but so are the concentration risks, regulatory uncertainties, and country-level divergences that sit beneath them.
For over 110 years, the Federal Reserve (the Fed) has operated at a deliberate distance from the White House and Congress.
It is the only federal agency that doesn’t report to any single branch of government in the way most agencies do, and can implement policy without waiting for political approval.
These policies include interest rate decisions, adjusting the money supply, emergency lending to banks, capital reserve requirements for banks, and determining which financial institutions require heightened oversight.
The Fed can act independently on all these critical economic decisions and more.
But why does the US government enable this? And why is it that nearly every major economy has adopted a similar model for their central bank?
The foundation of Fed independence: the panic of 1907
The Fed was established in 1913 following the Panic of 1907, a major financial crisis. It saw major banks collapse, the stock market drop nearly 50%, and credit markets freeze across the country.
At the time, the US had no central authority to inject liquidity into the banking system during emergencies or to prevent cascading bank failures from toppling the entire economy.
J.P. Morgan personally orchestrated a bailout using his own fortune, highlighting just how fragile the US financial system had become.
The debate that followed revealed that while the US clearly needed a central bank, politicians were objectively seen as poorly positioned to run it.
Previous attempts at central banking had failed partly due to political interference. Presidents and Congress had used monetary policy to serve short-term political goals rather than long-term economic stability.
So it was decided that a stand-alone body responsible for making all major economic decisions would be created. Essentially, the Fed was created because politicians, who face elections and public pressure, couldn’t be relied upon to make unpopular decisions when needed for the long-term economy.
Although the Fed is designed to be an autonomous body, separate from political influence, it still has accountability to the US government (and thereby US voters).
The President is responsible for appointing the Fed Chair and the seven Governors of the Federal Reserve Board, subject to confirmation by the Senate.
Each Governor serves a 14-year term, and the Chair serves a four-year term. The Governors' terms are staggered to prevent any single administration from being able to change the entire board overnight.
Beyond this “main” board, there are twelve regional Federal Reserve Banks that operate across the country. Their presidents are appointed by private-sector boards and approved by the Fed's seven Governors. Five of these presidents vote on interest rates at any given time, alongside the seven Governors.
This creates a decentralised structure where no single person or political party can dictate monetary policy. Changing the Fed's direction requires consensus across multiple appointees from different administrations.
The case for Fed independence: Nixon, Burns, and the inflation hangover
The strongest argument for keeping the Fed independent comes from Nixon’s time as president in the 1970s.
Nixon pressured Fed Chair Arthur Burns to keep interest rates low in the lead-up to the 1972 election. Burns complied, and Nixon won in a landslide. Over the next decade, unemployment and inflation both rose simultaneously (commonly referred to now as “stagflation”).
By the late 1970s, inflation exceeded 13 per cent, Nixon was out of office, and it was time to appoint a new Fed chair.
That new Fed chair was Paul Volcker. And despite public and political pressure to bring down interest rates and reduce unemployment, he pushed the rate up to more than 19 per cent to try to break inflation.
The decision triggered a brutal recession, with unemployment hitting nearly 11 per cent.
But by the mid-1980s, inflation had dropped back into the low single digits.
Pre-Volcker era inflation vs Volcker era inflation | FRED
Volcker stood firm where non-independent politicians would have backflipped in the face of plummeting poll numbers.
The “Volcker era” is now taught as a masterclass in why central banks need independence. The painful medicine worked because the Fed could withstand political backlash that would have broken a less autonomous institution.
Are other central banks independent?
Nearly every major developed economy has an independent central bank. The European Central Bank, Bank of Japan, Bank of England, Bank of Canada, and Reserve Bank of Australia all operate with similar autonomy from their governments as the Fed.
However, there are examples of developed nations that have moved away from independent central banks.
In Turkey, the president forced its central bank to maintain low rates even as inflation soared past 85 per cent. The decision served short-term political goals while devastating the purchasing power of everyday people.
Argentina's recurring economic crises have been exacerbated by monetary policy subordinated to political needs. Venezuela's hyperinflation accelerated after the government asserted greater control over its central bank.
The pattern tends to show that the more control the government has over monetary policy, the more the economy leans toward instability and higher inflation.
Independent central banks may not be perfect, but they have historically outperformed the alternative.
Turkey’s interest rates dropped in 2022 despite inflation skyrocketing
Why do markets care about Fed independence?
Markets generally prefer predictability, and independent central banks make more predictable decisions.
Fed officials often outline how they plan to adjust policy and what their preferred data points are.
Currently, the Consumer Price Index (CPI), Personal Consumption Expenditures (PCE) index, Bureau of Labor Statistics (BLS) monthly jobs reports, and quarterly GDP releases form expectations about the future path of interest rates.
This transparency and predictability help businesses map out investments, banks to set lending rates, and everyday people to plan major financial decisions.
When political influence infiltrates these decisions, it introduces uncertainty. Instead of following predictable patterns based on publicly released data, interest rates can shift based on electoral considerations or political preference, which makes long-term planning more difficult.
The markets react to this uncertainty through stock price volatility, potential bond yield rises, and fluctuating currency values.
The enduring logic
The independence of the Federal Reserve is about recognising that stable money and sustainable growth require institutions capable of making unpopular decisions when economic fundamentals demand them.
Elections will always create pressure for easier monetary conditions. Inflation will always tempt policymakers to delay painful adjustments. And the political calendar will never align perfectly with economic cycles.
Fed independence exists to navigate these eternal tensions, not perfectly, but better than political control has managed throughout history.
That's why this principle, forged in financial panics and refined through successive crises, remains central to how modern economies function. And it's why debates about central bank independence, whenever they arise, touch something fundamental about how democracies can maintain long-term prosperity.
ASX defence stocks are back on more watchlists and according to the Stockholm International Peace Research Institute (SIPRI), global military spending reached approximately US$2.718 trillion in 2024, up 9.4% in real terms.
Australia’s current defence settings are set out in the 2024 National Defence Strategy and related investment planning documents, which outline long-term capability funding priorities. Furthermore, Canberra has pointed to A$330 billion of capability investment through 2034, including added funding for surface combatants, preparedness, long-range strike and autonomous systems.
Here is the part most people miss: not all ASX defence stocks are the same trade. Some sit close to naval shipbuilding. Some are counter-drone names and some are smaller, higher-risk operators where one contract may matter much more than the market assumes.
These five names are not a buy list, rather they are a practical watchlist for investors trying to understand where procurement momentum may actually show up on the ASX.
1) Austal (ASX: ASB)
Austal is one of the ASX-listed companies most directly exposed to Australia’s naval shipbuilding pipeline, although contract execution, margins and delivery timing remain important variables.
They aren't just winning random contracts; they have signed a massive legal agreement (the Strategic Shipbuilding Agreement) that makes them the official partner for building Australia's next generation of mid-sized military ships in Western Australia.
In February 2026, the government gave Austal the green light on a $4 billion project. This isn't for just one ship, it’s for 8 "Landing Craft Heavy" vessels. These are huge transport ships (about 100 metres long) designed to carry heavy tanks and equipment directly onto a beach. But here is the part most people miss, shipbuilding is a marathon, not a sprint.
As you can see in the delivery timeline, while construction starts in 2026, the final ship won't be delivered until 2038. For an investor, this means Austal has a "guaranteed" stream of income for the next 12 years, but they have to be very good at managing their costs over that long period to actually make a profit.
2) DroneShield (ASX: DRO)
If you have seen footage of small drones disrupting modern battlefields, DroneShield is building part of the "off switch". Its focus is counter-drone technology, including systems that detect, disrupt or defeat drones using electronic warfare, sensors and software-led tools, rather than relying only on traditional munitions.
By early 2026, DroneShield had moved beyond the label of a promising start-up and into a much larger commercial phase. It reported FY2025 revenue of A$216.5 million, up 276% from FY2024, and said it started FY2026 with A$103.5 million in committed revenue.
One point the market may overlook is the software layer in the model. DroneShield reported A$11.6 million in Software as a Service (SaaS) revenue in FY2025 and said it is working towards SaaS making up 30% of revenue within five years. Its subscription model includes software updates for deployed systems, which adds a growing stream of recurring revenue alongside hardware sales.
Among ASX defence stocks, DroneShield is one of the most direct ways to follow the counter-UAS theme. It is also one of the names where sentiment can swing quickly, because growth stories can rerate both up and down when order timing changes.
EOS builds both the "brain" and the "muscle" for military platforms. It is best known for remote weapon systems, which allow operators to control armed turrets from inside protected vehicles, and for high-energy laser systems aimed at counter-drone defence. EOS has said its unconditional backlog reached about A$459.1 million in early 2026, following a series of contract wins through 2025. That points to a much larger base of secured work, although delivery timing and revenue conversion still matter.
EOS signed a €71.4 million, about A$125 million, contract with a European customer for a 100-kilowatt high-energy laser weapon system. EOS says the system is designed for a low cost per shot and can engage up to 20 drones a minute. The Australian Government has set aside A$1.3 billion over 10 years for counter-drone capability acquisition, and EOS has disclosed that it was part of a successful LAND 156 bid team. That does not guarantee future revenue, but it does support medium-term visibility in a market the company is already targeting.
EOS reads as a rebound story, but one that still depends on execution. The company has reoriented around remote weapon systems, counter-drone systems and lasers, all areas tied to stronger defence spending. The key question is whether it can keep converting backlog and pipeline into delivered revenue while maintaining balance-sheet discipline.
4) Codan (ASX: CDA)
Codan is sometimes left out of casual defence stock lists because it is more diversified. That may be an oversight. In its H1 FY26 results, Codan said its Communications business designs mission-critical communications for global military and public safety markets. Communications revenue rose 19% to A$221.8 million. The company also said DTC delivered strong growth from defence and unmanned systems demand, with unmanned systems revenue up 68% to A$73 million. Codan said about half of that unmanned revenue was linked to operational defence applications in conflict zones.
This is where the story becomes more nuanced. In a basket of ASX defence stocks, Codan may offer a different profile, with less pure headline sensitivity, broader operating diversification and meaningful exposure to military communications and unmanned systems without being a single-theme name. That diversification may also mean the stock does not always trade like a pure-play defence name.
HighCom sits at the speculative end of this list, and it should be labelled that way. The company says its two continuing businesses are HighCom Armor, which supplies ballistic protection, and HighCom Technology, which supplies and maintains small and medium uncrewed aerial systems, counter-uncrewed aerial systems, and related engineering, integration, maintenance and logistics support for the ADF and other aligned regional militaries.
In H1 FY26, revenue from continuing operations fell 59% to A$10.9 million, while EBITDA moved to a A$5.4 million loss from a A$1.9 million profit a year earlier. HighCom also disclosed A$5.1 million in HighCom Technology revenue, including A$3.5 million from small uncrewed aerial systems (SUAS) spare parts and A$1.6 million from sustainment services provided to the Australian Department of Defence.
So yes, HighCom is one of the more financially sensitive ASX defence stocks on the board. But it is also the kind of smaller name that can show how procurement filters down into support, sustainment and specialist protection gear.
Key market observations
Track program milestones, not just political headlines. Contract awards, manufacturing starts, delivery schedules and sustainment work often matter more than a single announcement day.
Separate pure-play exposure from diversified exposure. DroneShield and EOS are closer to concentrated defence technology themes, while Codan brings communications exposure within a broader business mix.
Watch sovereign capability themes in Australia. Austal and EOS are tied to local manufacturing, integration and Australian supply chains, which supports the broader sovereign capability theme in this group.
Pay attention to balance sheets and cash conversion. Procurement momentum can be real even when timing gets messy. HighCom's latest half is a reminder of that.
Defence headlines can look immediate. Earnings usually are not. Austal's major naval work stretches into the next decade. EOS contracts are delivered over multiple years. DroneShield's order flow appears strong, but the company still separates committed revenue from broader pipeline opportunity. HighCom shows the other side of the coin. Exposure to procurement does not automatically translate into smooth financial execution.
References to ASX-listed defence stocks are general information only, not a recommendation to buy, sell or hold any security or CFD. These stocks can be highly volatile and are sensitive to contract timing, government policy, geopolitics, execution risk and market conditions. Backlog, pipeline and revenue expectations are not guarantees of future performance.
Three central banks are deciding rates simultaneously, Brent crude is swinging wildly around US$100 a barrel, and a war in the Middle East is rewriting the inflation outlook in real time. Whatever happens this week could set the tone for markets for the rest of 2026.
Quick facts
The Reserve Bank of Australia (RBA) announces its next cash rate decision on Tuesday, with markets now pricing a 66% chance of a second hike to 4.1%.
Some analysts have warned the Iran war could push US inflation to 3.5% by year-end and delay Fed rate cuts until September, making this week's FOMC dot plot the most closely watched in years.
Brent crude is flirting with US$100 a barrel after Iran launched what state media described as its "most intense operation since the beginning of the war."
RBA: Will Australia hike again?
The RBA raised the cash rate for the first time in two years to 3.85% at its February meeting after inflation picked up materially in the second half of 2025.
The question now is whether it moves again before even seeing the next quarterly CPI print, which isn't due until 29 April.
Deputy Governor Andrew Hauser acknowledged ahead of the meeting that policymakers face a genuinely divided decision, shaped by conflicting economic signals at home and growing instability abroad.
Financial markets currently assign around a 66% probability to another hike, with a May increase considered virtually certain regardless of what happens Monday.
The FOMC meets on March 17–18, with the policy statement scheduled for 2:00 pm ET on March 18 and Chair Jerome Powell's press conference at 2:30 pm. CME FedWatch shows a 99% probability that the Fed holds rates at 3.50% to 3.75%.
The real action is in the Summary of Economic Projections (SEP) and dot plot. The current median dot shows one 25-basis-point cut for 2026. If it shifts to two cuts, that is dovish and bullish for risk assets. If it shifts to zero cuts or adds a rate hike into the projection, markets could react in the other direction.
Further complicating matters, Powell's term as Federal Reserve Chair expires on May 23, 2026. Kevin Warsh is the leading candidate to replace him, viewed as more hawkish on monetary policy. Any comment from Powell on this transition could move markets independently of the rate decision itself.
Bank of Japan: Further tightening could be brought forward
The BOJ meets on March 18–19, with the decision expected Thursday morning Tokyo time. The current policy rate sits at 0.75% (a 30-year high), and the January 2026 meeting produced a hold in an 8-1 vote.
Governor Ueda has categorised the March meeting as "live," noting the timeline for further tightening could be "brought forward" if Shunto spring wage negotiations yield stronger-than-expected results.
Those results are due to begin flowing in during the week, making them the critical input for the BOJ's decision. Nomura expects 2026 Shunto wage hikes to come in around 5.0%, including seniority, with base pay growth of approximately 3.4%. If results confirm that trajectory, the case for a March hike strengthens considerably.
The complication is the global backdrop. Japan imports roughly 90% of its energy needs, and oil around US$100 per barrel is pushing up import costs and threatening to add inflationary pressure. A BOJ hike into a global oil shock would be an unusually bold move.
Most market participants still lean toward a hold at this meeting, with April or July seen as the more likely timing for the next move.
Brent crude briefly touched US$119.50 per barrel earlier in the week before dropping 17% to below US$80, then rebounding toward US$95 on mixed signals from Washington about the Strait of Hormuz.
As of Thursday, Brent was back over US$100 as Iran launched fresh attacks on commercial shipping and the IEA reserve release failed to bring meaningful relief.
In the scenario where a longer conflict inflicts damage to energy infrastructure, analysts estimate CPI could rise to 3.5% by the end of 2026, with gasoline prices approaching US$5 per gallon in the second quarter.
For this week, oil acts as a macro meta-variable. Every geopolitical headline, ceasefire signal, tanker attack, reserve release, and Trump comment could move equities, bonds and currencies in real time.
US-Israeli strikes on Iran launched on 28 February sent Brent crude surging past US$119 a barrel, gold above US$5,200, and defence stocks to all-time highs.
Against that backdrop, investors are focusing on a small group of commodity-linked names that may remain sensitive to further moves in oil, LNG and gold. The key question is whether the shock proves sustained, or whether a ceasefire, shipping normalisation, or policy action removes part of the geopolitical risk premium.
1. ExxonMobil (NYSE: XOM)
ExxonMobil has been one of the clearest beneficiaries of the price surge. Shares hit a record high of US$159.60 in early March and are up approximately 28% year-to-date.
The company produces 4.7 million barrels of oil equivalent per day, has a Permian Basin breakeven of around US$35/barrel, and is committed to US$20 billion in buybacks for 2026.
Wells Fargo raised its price target to US$183 from US$156 following the escalation, while broader analyst consensus sits around US$140–$144. However, XOM is already trading above many consensus targets, and disruption to its LNG partner QatarEnergy poses a near-term operational headwind.
Chevron touched a new 52-week high of US$196.76 in early March and has risen approximately 24% year-to-date.
The company's Brent breakeven for dividends and capital expenditure sits around US$50/barrel. This means that at current Oil prices above US$90, it is generating significant free cash flow.
However, Chevron has temporarily halted operations at a gas field off Israel's coast following missile activity in the region, and the stock has since pulled back more than 1% as the conflict directly affects its operations.
What to watch
Direct operational updates from Chevron's Middle East and Israeli assets.
Any further halts that could weigh on near-term production.
With Qatar having halted output after Iranian drone strikes, buyers across Asia and Europe are scrambling for alternative supply. Woodside, as one of Australia's largest LNG producers and exporters, sits outside the conflict zone and is well-positioned to benefit from rerouted demand.
Analysts caution that actual substitution takes time due to shipping and contract constraints, meaning the price uplift may be more durable than a simple spot trade. European TTF benchmark gas prices surged over 50% in a week, amplifying the margin environment for non-Middle Eastern LNG producers.
What to watch
The pace and timeline of any Qatar LNG production restart.
If QatarEnergy remains offline for weeks, Woodside could begin re-contracting European buyers at elevated spot prices.
An Australian dollar move higher could be a headwind worth tracking for USD-denominated earnings.
4. Cheniere Energy (NYSE: LNG)
Alongside Woodside, Cheniere is the most direct US beneficiary of the Qatar LNG disruption. As the largest LNG exporter in the United States, it saw intraday strength at the start of the conflict week.
US domestic energy production has buffered American consumers from the worst of the shock, but the export premium has widened as European and Asian buyers pay up for non-Gulf supply.
The trade is "geopolitically sensitive," and any resolution could reverse upside quickly. But for as long as Hormuz and Gulf gas infrastructure remain compromised, Cheniere is positioned to benefit structurally.
What to watch
Any diplomatic breakthrough that reopens Gulf shipping lanes.
Announcements of new long-term offtake contracts signed at current elevated prices.
Gold surged 5.2% in a single session on 1 March, touching US$5,246/oz, as markets sought safe-haven assets. Newmont, the world's largest gold producer, has seen its reserves effectively revalued at these prices.
It is up alongside gold's 24% year-to-date gain, and its all-in sustaining costs remain largely fixed.
However, Gold miners sold off sharply on 4 March, and Newmont fell nearly 8% in a single session as broader risk-off deleveraging hit precious metals equities.
The stock has recovered since, but volatility remains high. For longer-duration investors, analysts note that "safe" mining jurisdictions such as Canada, Australia, and Nevada are commanding fresh premiums as Middle East instability raises the value of geopolitically secure supply.
What to watch
Whether gold can hold above US$5,000/oz.
A prolonged conflict could accelerate an M&A cycle in junior gold miners.
A ceasefire or broad equity deleveraging event as the primary risk to monitor.
Lockheed Martin reached a new all-time high of US$676.70 on 3 March, up over 4% for the day. Its F-35 fighters, precision-guided munitions, THAAD systems, and HIMARS rocket artillery are central to the ongoing air campaign.
The US Department of Defence is moving to replenish munitions stockpiles, and Trump's stated ambition to raise the US defence budget to US$1.5 trillion by 2027 adds a longer-term structural tailwind beyond the immediate conflict.
Defence stocks are rising amid classic geopolitical risk pricing, but investors should note that actual contract flow takes time to translate into earnings, and valuations already reflect considerable optimism.
What to watch
The pace of US Department of Defence munitions replenishment orders.
How quickly contract wins translate into backlog growth.
Barrick is tracking gold's historic run alongside Newmont, with the stock up sharply year-to-date. It sits at a roughly US$78 billion market capitalisation and is reporting record free cash flow projections as its all-in sustaining costs remain well below current spot prices.
Like Newmont, it experienced a sharp single-session selloff of more than 8% during the broader 4 March deleveraging event, before partially recovering.
Royalty and streaming companies such as Wheaton Precious Metals (WPM) are being favoured by some investors as a more inflation-protected way to access gold upside, given their lower operational cost exposure. But Barrick remains one of the world’s largest listed gold miners, with earnings that are highly sensitive to changes in the gold price
What to watch
Gold's ability to hold above US$5,000/oz.
Any Barrick moves toward junior miner acquisitions.
Energy cost inflation, as rising fuel prices could begin to squeeze miner operating margins.