
Market news & insights
Stay ahead of the markets with expert insights, news, and technical analysis to guide your trading decisions.

The latest move in oil has put energy names back in focus. Over the past six months, Exxon Mobil and Baker Hughes have outperformed Brent crude on a normalised basis, Chevron has remained broadly constructive, SLB has lagged the commodity and Woodside's broker consensus has been more measured.
When crude moves, the impact rarely stays contained to the commodity itself. Higher oil prices can affect inflation expectations, shipping costs and corporate margins across the global economy.
What the latest move is showing
There are three broad ways companies can benefit from firmer oil prices:
- Producing oil and gas, by selling the commodity at a higher price
- Providing services and equipment to producers
- Transporting oil around the world
Each of the names below represents one of those exposure types, with a different risk profile when crude rises.
1. Exxon Mobil (NYSE: XOM)
Over the past six months, Exxon Mobil has outperformed Brent crude, with its share price up nearly 35% compared with about 30% for Brent. As of 11 March 2026, both were trading just over 3% below their all-time highs, while Exxon remained closer to its 52-week high.
Exxon Mobil is one of the world's largest integrated oil companies, with exposure spanning exploration, production, refining and chemicals. When oil prices rise, its upstream business may benefit from wider margins, while its scale and diversification can help cushion weaker parts of the cycle.
Exxon Mobil (XOM) vs. Brent Crude 3-month performance

Analyst consensus: Buy
According to TradingView data, analyst sentiment towards Exxon is broadly positive. Of the 31 analysts tracked, 15 rate the stock Strong Buy or Buy, 13 rate it Hold, 1 rates it Sell and 2 rate it Strong Sell.
That positive view is linked to Exxon's balance sheet strength and higher-margin production. The most optimistic analysts project a 1-year price target as high as US$183.00. The average price target is US$145.00, which sits about 3.6% below the current trading price.

2. Chevron (NYSE: CVX)
Chevron is another global integrated major that has benefited from the recent move higher in crude, with its shares trading near 52-week highs. Like Exxon, Chevron operates across the value chain, including upstream production, refining and marketing.
Chevron's completed acquisition of Hess adds Guyana and other upstream assets, which some analysts see as supportive over time. That said, the earnings impact remains subject to integration, project execution and commodity price risks.
Exxon Mobil vs Chevron performance, 6-month chart

Analyst consensus: Buy
Chevron is viewed similarly to Exxon, with broker sentiment remaining broadly constructive. Recent TradingView aggregates show 30 analysts covering the stock over the past three months, with 17 rating it Strong Buy or Buy, 11 at Hold, 1 at Sell and 1 at Strong Sell.
Analysts have highlighted Chevron's diversified portfolio and the potential contribution from Hess, although commodity price volatility and execution risk may keep some more cautious.

3. SLB (NYSE: SLB)
SLB, previously known as Schlumberger, is one of the world's largest oilfield services and technology providers. It supplies tools, equipment and software that help producers find, drill and complete wells more efficiently.
Over the past six months, SLB has lagged Brent crude, with the share price trading in a choppier range and remaining below its recent peak. That suggests the stronger oil backdrop has not been fully reflected in the share price.
That pattern is not unusual for oilfield services companies, where customer spending decisions often follow moves in the underlying commodity rather than move in lockstep with them. Any future re-rating would depend on factors including producer capital spending, contract timing, service pricing, offshore activity and broader market conditions. A firmer oil price should not be assumed to translate automatically into a firmer SLB share price.
SLB vs Brent crude, 1-month normalised performance

Consensus: Buy
According to TradingView data, third-party analyst consensus on SLB is Buy. Of the 33 analysts covering the stock, 27 rate it Strong Buy or Buy, 4 rate it Hold and 2 rate it Sell or Strong Sell.
That indicates constructive broker sentiment, although the gap between oil prices and SLB's recent share-price performance suggests investors may still want clearer evidence of improving service demand and pricing before the stock fully reflects the stronger commodity backdrop.

4. Baker Hughes (NASDAQ: BKR)
Baker Hughes is another major oilfield services and equipment provider, with additional exposure to industrial segments such as LNG and power infrastructure. Even when oil prices are not at extreme highs, advances in drilling technology and lower break-even costs have helped keep many shale plays profitable, supporting demand for its services.
The company has also been described as well positioned because of its balance sheet and its exposure to ongoing exploration and production activity. In a period of higher, or even stable-to-firm, oil prices, that mix of services and energy technology may create several revenue drivers.
Over the past six months, Baker Hughes has materially outperformed Brent crude on a normalised basis. Brent traded in a much tighter range for most of the period before moving higher late, while BKR climbed more steadily and reached a significantly stronger cumulative gain. That suggests BKR's share price benefited not only from the backdrop in oil, but also from company-specific optimism and broader support for oilfield services and energy technology names.
BKR vs Brent crude, 6-month normalised performance

Analyst consensus: Buy
According to TradingView data, Baker Hughes is categorised as Strong Buy. Based on 25 analysts who provided ratings over the past three months, 16 rated the stock Strong Buy, 3 rated it Buy, 4 rated it Hold, 1 rated it Sell and 1 rated it Strong Sell.
Overall, broker sentiment towards Baker Hughes is broadly positive, with more than three quarters of covering analysts rating the stock either Strong Buy or Buy, while most of the remainder were at Hold. That supportive analyst view appears to reflect BKR's exposure to both traditional oilfield services and broader energy and industrial technology markets, including LNG infrastructure.

5. Woodside Energy (ASX: WDS)
Woodside Energy gives the list an Australia-based producer with significant exposure to LNG and oil markets. Its earnings are closely tied to realised commodity prices, which makes the stock sensitive to shifts in crude and gas pricing, as well as broader global energy demand.
Compared with some of the larger US energy names, broker sentiment towards Woodside appears more measured. Investors are balancing the company's global LNG exposure and leverage to stronger energy prices against softer recent realised prices, project and execution risks, and longer-term regulatory and decarbonisation pressures.
Analyst consensus: Hold
According to TradingView data, Woodside is rated Neutral/Hold. Of 15 analysts, 2 rate it Strong Buy, 4 rate it Buy, 7 rate it Hold, 1 rates it Sell and 1 rates it Strong Sell.
The average 12-month price target is A$29.20 versus a current price of about A$30.28, implying downside of roughly 3.6%. Relative to the larger US energy names in this list, that points to a more cautious broker view.

6. Global oil tanker operators
Oil tanker companies can benefit when firmer oil prices, OPEC+ policy shifts and geopolitical tension increase long-distance shipments and disrupt usual trade routes. When oil volumes travel further, 'tonne-mile' demand can support tanker day rates and profitability even when the broader energy market is volatile.
Analyst consensus: N/A
This is a broader industry category rather than a single publicly traded stock, so there is no single broker consensus to cite. Analyst views would need to be assessed at the company level, such as Frontline plc (FRO), Euronav (EURN) or Scorpio Tankers (STNG).
More broadly, the sector is cyclical. Any benefit from tighter shipping markets can reverse if routes normalise, freight rates fall or supply increases.

Risks and constraints
Higher oil prices do not remove risk for these names.
- If prices rise too far, too fast, demand destruction and policy responses can weigh on future earnings.
- Political decisions from OPEC+ or other major producers can reverse a rally by increasing supply.
- Services and tanker companies are highly cyclical. When the cycle turns, pricing power can fade quickly.
- Company-specific issues, including project execution, realised pricing and capital spending, still matter.
Taken together, these names may benefit from firmer oil prices, but they also carry sector-specific, geopolitical and company-level risks that deserve close attention.
Key market observations
- Woodside provides LNG and oil exposure, although current broker sentiment is more neutral than for the larger US names.
- Tanker operators may benefit when freight markets tighten, though that trade remains highly cyclical and route-dependent.
- SLB and Baker Hughes may benefit if firmer oil prices translate into more drilling and completion activity, but the share-price response has been mixed.
- Exxon Mobil and Chevron offer direct exposure to stronger upstream margins, supported by diversified operations.
References in this article to Exxon Mobil, Chevron, SLB, Baker Hughes, Woodside, tanker operators, analyst consensus ratings and price targets are included for general market commentary only and do not constitute a recommendation or offer in relation to any financial product or security. Third-party data, including consensus ratings and target prices, may change without notice and should not be relied on in isolation. Energy and shipping exposures are cyclical and can be materially affected by commodity price volatility, realised pricing, production changes, project execution, geopolitical disruptions, freight market conditions, regulatory developments and shifts in investor sentiment. Any views about potential beneficiaries of higher oil prices are subject to significant uncertainty.


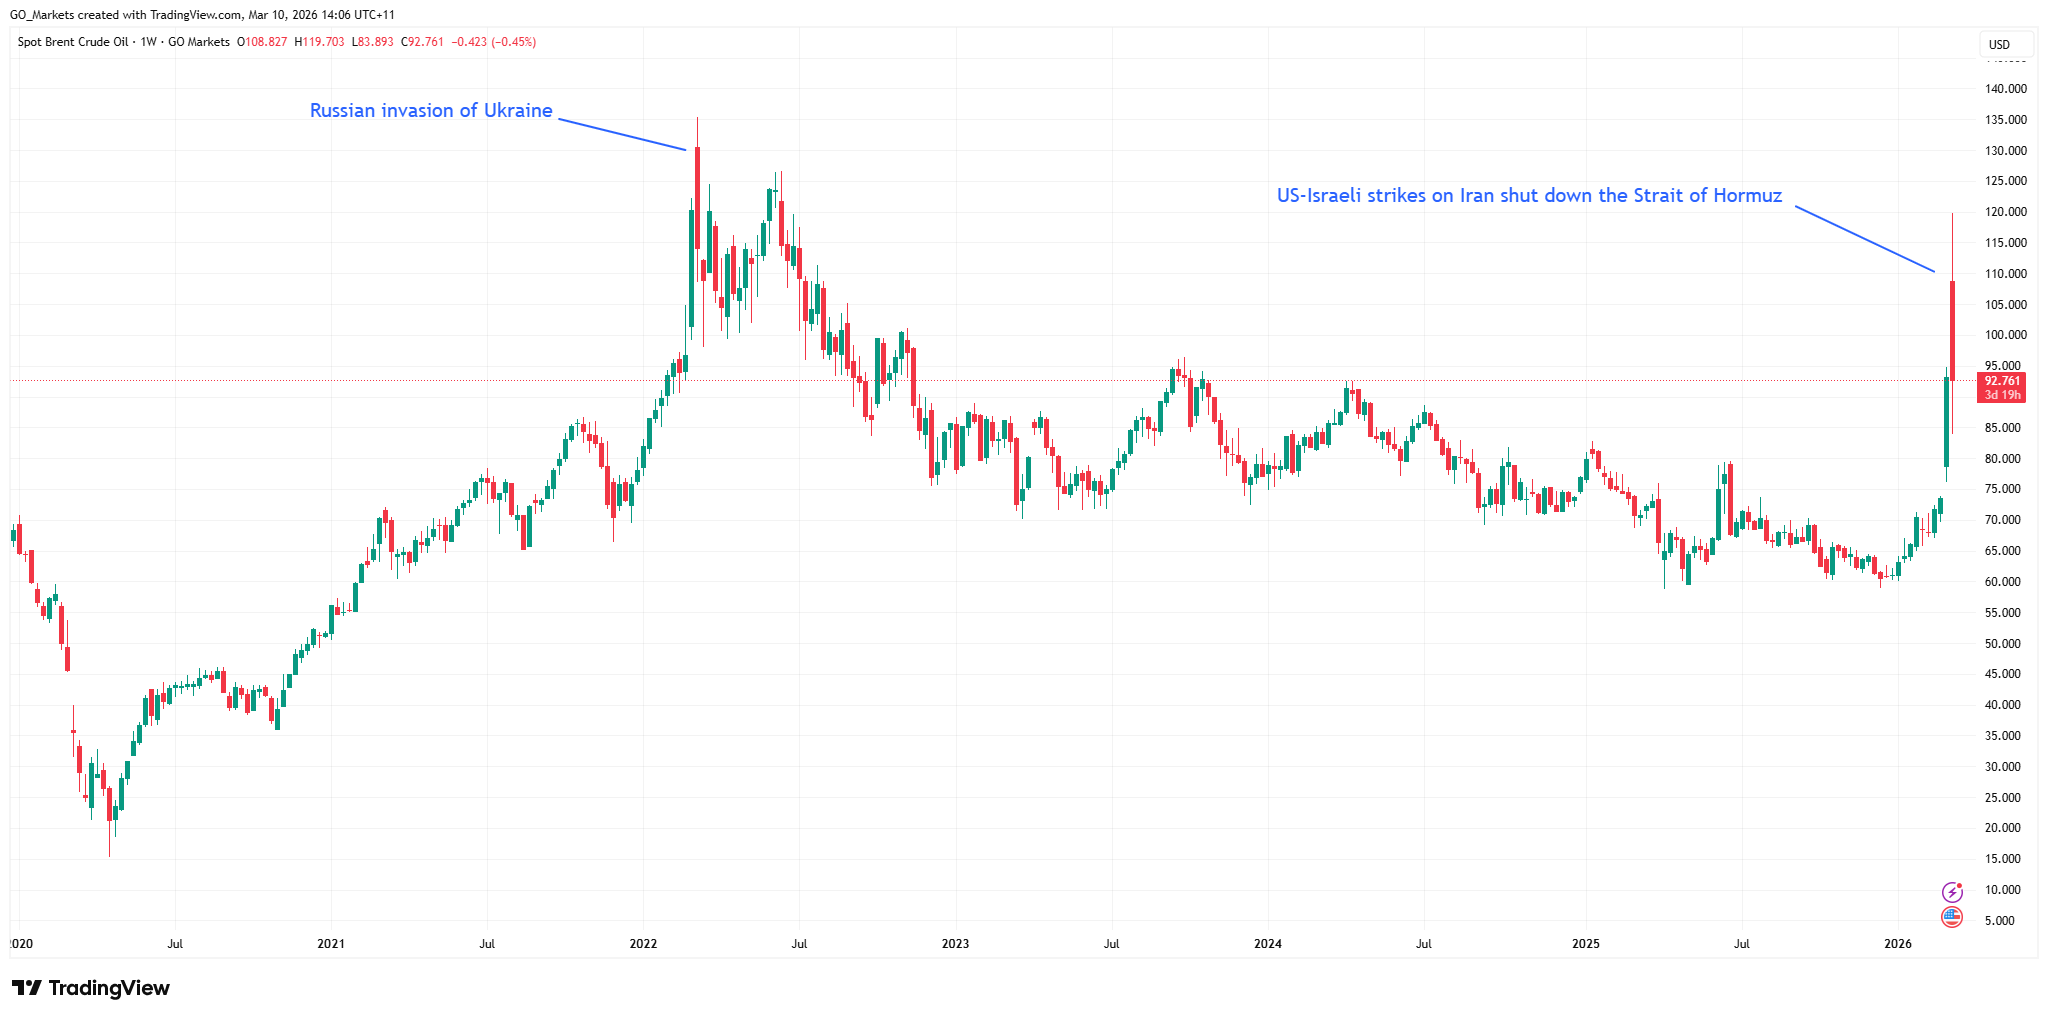
Oil smashed US$100 a barrel as US-Israeli strikes on Iran shut down the Strait of Hormuz, triggering the biggest single-day crude spike since the Russian invasion of Ukraine.
Quick facts
- Brent Crude intraday peak: US$119.50/bbl (up ~50% in 10 days)
- Reported vessel traffic through the Strait of Hormuz fell to <20% of average
- Analysts estimate up to ~20% of global seaborne oil flows could be affected if disruption persists (largest since the 1956 Suez Crisis)
Why have oil prices spiked?
Oil markets woke up on 9 March 2026 to joint U.S.-Israeli strikes on Iranian oil depots that sent Brent crude to an intraday peak of US$119.50 a barrel (its highest level since the start of the Russia-Ukraine war) before settling back near US$90.
Iran's Revolutionary Guard has threatened to target any tanker transiting the Strait of Hormuz, collapsing vessel traffic to near-zero.
The strait carries roughly 20% of the world's daily seaborne oil supply, and analysts are describing the disruption as the largest since the Suez Crisis of 1956–57. Crude had already risen around 16% in the week before the strikes as markets priced in escalating tensions.
Middle East escalation: oil, VIX and volatility scenarios
ExxonMobil's chief economist, Tyler Goodspeed, has said the distribution of probable outcomes skews heavily toward the Strait remaining effectively closed for longer than markets currently expect.
Meanwhile, Donald Trump has played down the need to release strategic petroleum reserves, calling any short-term price pain a small cost for global safety. The G7 is discussing a coordinated SPR release, which briefly pulled prices back toward US$110 before late-session trading moved them lower on fresh Trump commentary about a potentially “swift end” to the conflict.
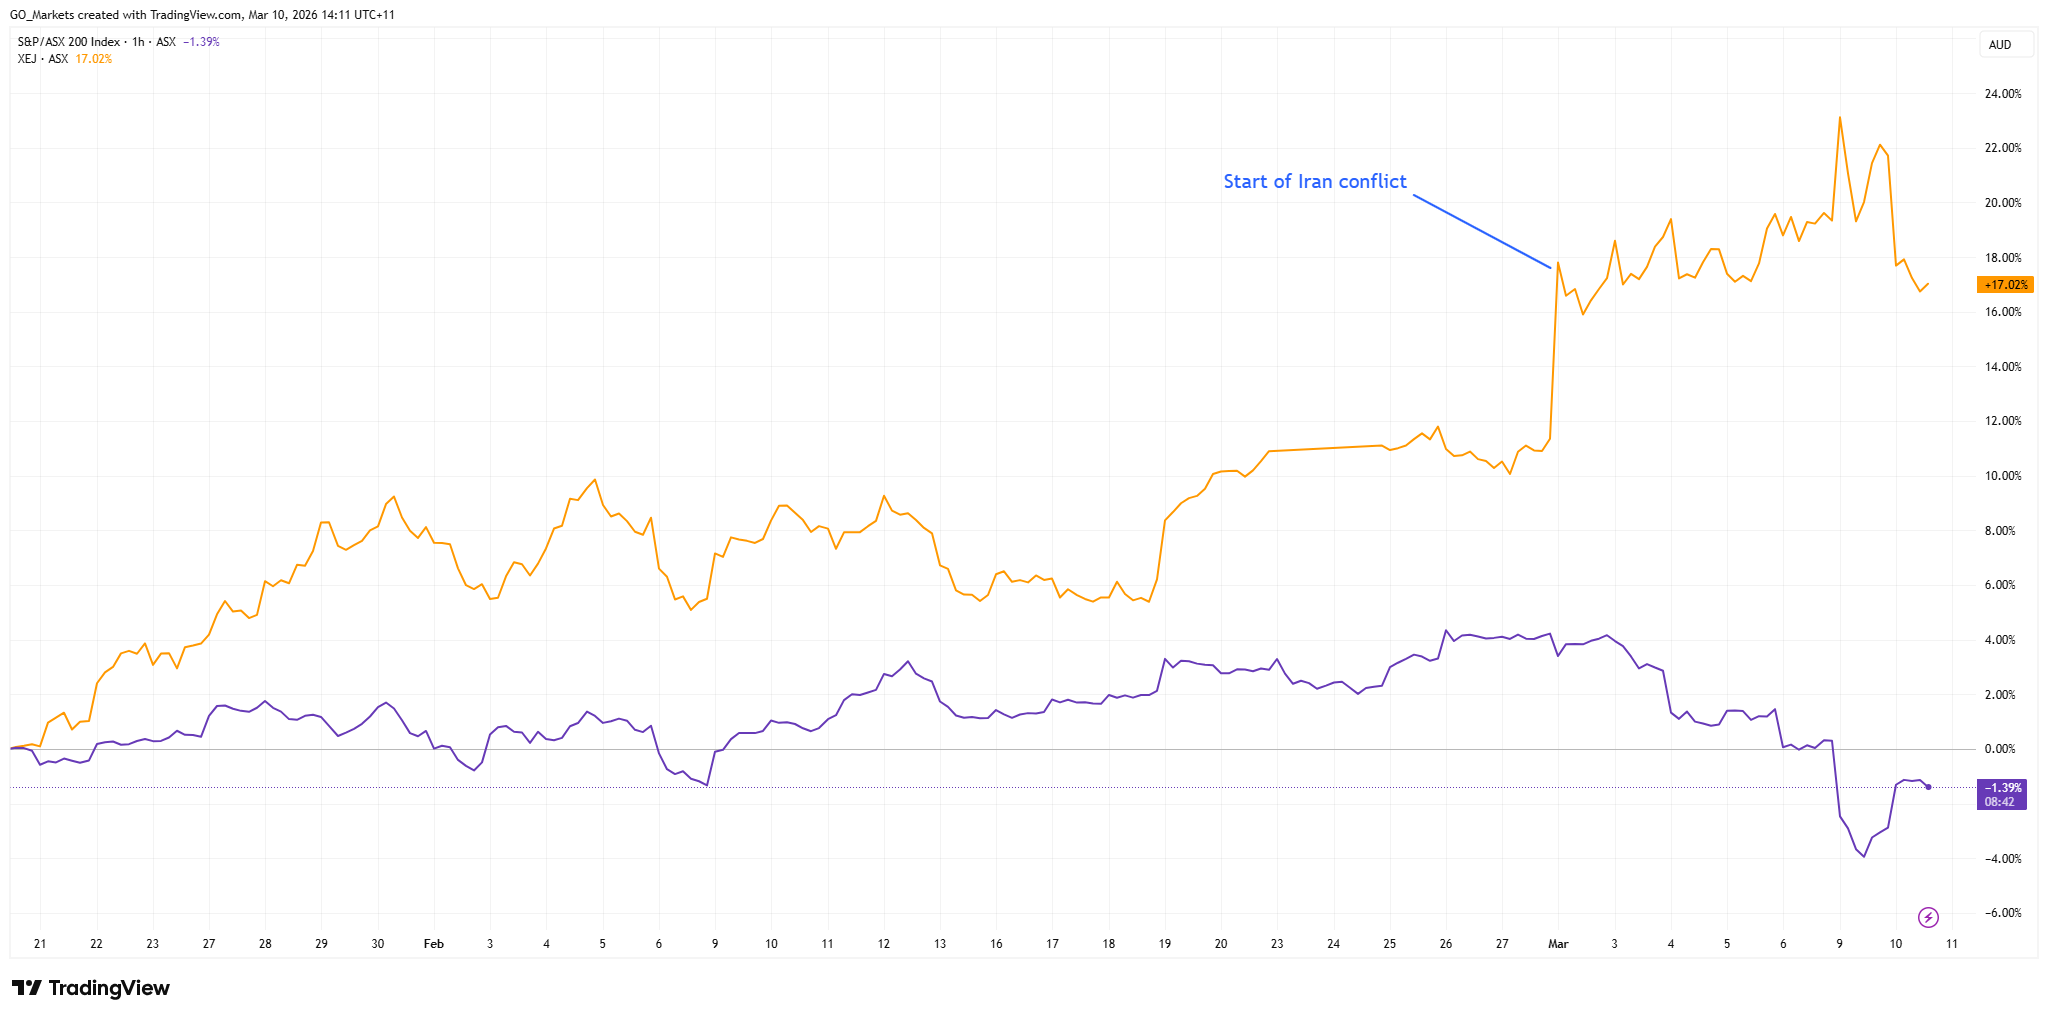
Market Reaction
The ASX response has been sharply split. The broader ASX 200 fell as investors priced in inflation and potential demand destruction, with materials stocks like BHP sinking close to 6%. Energy was the only sector in the green. The IMF estimates that every sustained 10% rise in oil prices adds 0.4% to global inflation and reduces global growth by 0.15%.
If oil holds above US$100 for an extended period, recession risk in major importing economies could rise materially. ASX energy investors are navigating a world where the same tailwind for producers could become a headwind for global demand.
Top 5 ASX energy stocks to watch
1. Woodside Energy Group (ASX: WDS)
Woodside is Australia’s largest listed oil and gas producer and is often closely watched when energy prices rise. Woodside operates Pluto LNG in the Pilbara with a 90% stake, the North West Shelf LNG project, and a growing international portfolio. Shares hit a fresh 52-week high and have risen 33% since January.
Fully franked dividends add yield support; the company recently paid an 83.4-cent-per-share final dividend. For cautious investors, Woodside is a potential entry point in the sector right now.
2. Santos Ltd (ASX: STO)
Santos is the ASX's second-largest oil and gas producer with a market cap of nearly A$23 billion, and it offers a compelling production growth story on top of the price tailwind.
The Barossa gas project shipped its first LNG cargo in January 2026, and production is expected to grow around 30% by 2027 as Barossa and the Pikka project in Alaska ramp up together.
CEO Kevin Gallagher sold A$5.6 million in stock in late February to cover personal tax obligations, which some investors have flagged as a caution signal, but the growth fundamentals remain intact.
3. Karoon Energy (ASX: KAR)
A mid-cap pure-play oil producer with 100% interests in the Bauna and Patola offshore oil fields in Brazil's Santos Basin, plus the Who Dat assets in the Gulf of Mexico, it was the biggest mover on the entire ASX 200 in recent sessions.
With a market cap near A$1.25 billion and a Price to Earnings (P/E) ratio of 7, the stock is extraordinarily sensitive to oil price movements. Karoon generated a free cash flow margin of approximately 45% against a base case of US$65 per barrel. At current prices, the cash flow profile could improve dramatically.
A new dividend of A$0.031 per share has been declared alongside 2026 production guidance. The risk is symmetrical: if the war premium fades and oil drifts back toward the mid-US$60s, the pullback could be as sharp as the rally.
4. Ampol Ltd (ASX: ALD)
Ampol is Australia's largest integrated fuel company, operating the Lytton oil refinery in Brisbane alongside a national fuel retail and distribution network and Z Energy in New Zealand.
Higher oil prices are a double-edged sword for Ampol. They improve crude inventory value and refining margins, but can compress consumer demand over time.
A planned A$1.1 billion acquisition of EG Australia's fuel and convenience network adds a structural growth catalyst independent of the oil price. A 100%-franked trailing yield of 3.2% could also provide income support.
5. Beach Energy (ASX: BPT)
Beach Energy has underperformed the broader ASX energy sector over the past year, weighed down by reserve replacement challenges and a difficult recent earnings period.
However, the company beat half-year FY2026 estimates by 13.5%, and management maintained full-year production guidance of 19.7–22.0 million barrels of oil equivalent.
Beach's asset base spans the Cooper and Eromanga Basins, the Otway Basin, the Perth Basin's Waitsia LNG export project, and New Zealand.
A 6.1% dividend yield with a payment due in March 2026, and the stock's low beta of 0.20 means it could offer materially less volatility than peers.
CEO Brett Woods has flagged M&A interest in East Coast gas assets and a target of 35% emissions intensity reduction by 2030. A sustained high-oil environment could arrest Beach's production decline trend.
What to watch next
Energy markets are moving on fear and geopolitics rather than fundamentals, which means the trade can reverse as fast as it started. The key question is whether this is a brief war premium or the start of a sustained structural disruption.
A prolonged Hormuz closure could push Brent even higher and keep ASX energy stocks elevated. A swift diplomatic resolution or coordinated G7 SPR release could snap oil back downwards and reverse much of the recent move.
Sitting over both scenarios is the question of recession: if oil holds above US$100 for six to eight weeks, markets may begin pricing in central bank responses and demand destruction, which could ultimately weigh on the Energy sector that is outperforming today.

US inflation data on Wednesday is the week's centrepiece, but with oil nearing seven-month highs, Bitcoin (BTC) sentiment shifting, and the Australian dollar at three-year highs, traders have plenty to navigate in the week ahead.
Quick Facts
- US inflation rate (February) is the key binary event for rate cut pricing and equity direction.
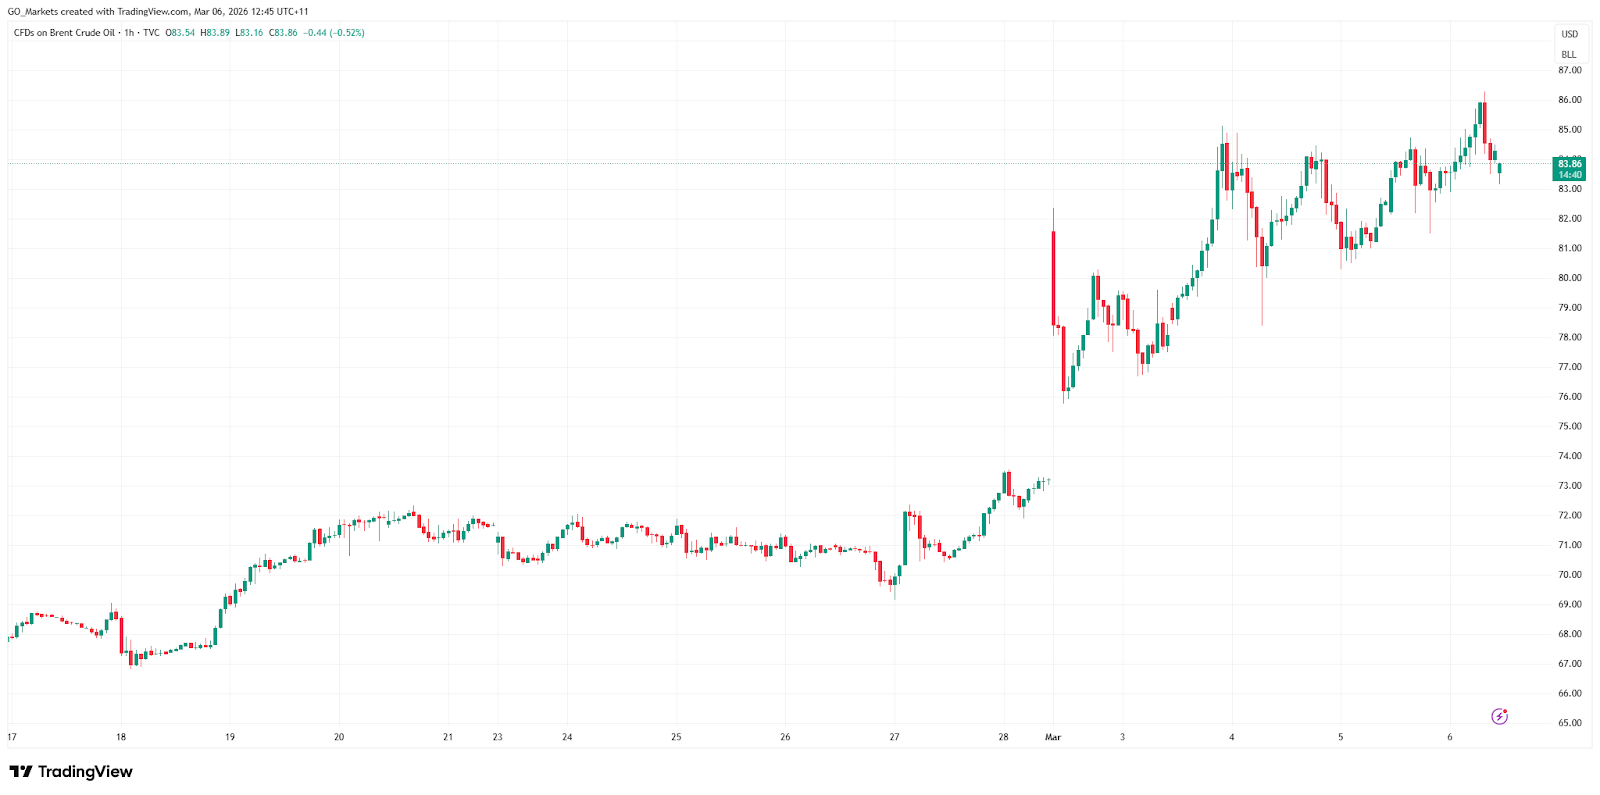
- Brent crude is trading around US$82–84/bbl, near seven-month highs, with a $4–$10 geopolitical risk premium baked in from Iran/Hormuz tensions.
- Bitcoin is trading above US$70,000 as of 6 March, a potential trend change if it holds through the week.
United States: inflation in focus
Last month’s US inflation reading showed prices rising 2.4% year-on-year, still well above the Fed's 2% target.
February's inflation rate, due Wednesday, will be scrutinised for signs that tariff pass-through or rising energy costs are pushing prices back up, or whether the slow grind lower is still intact.
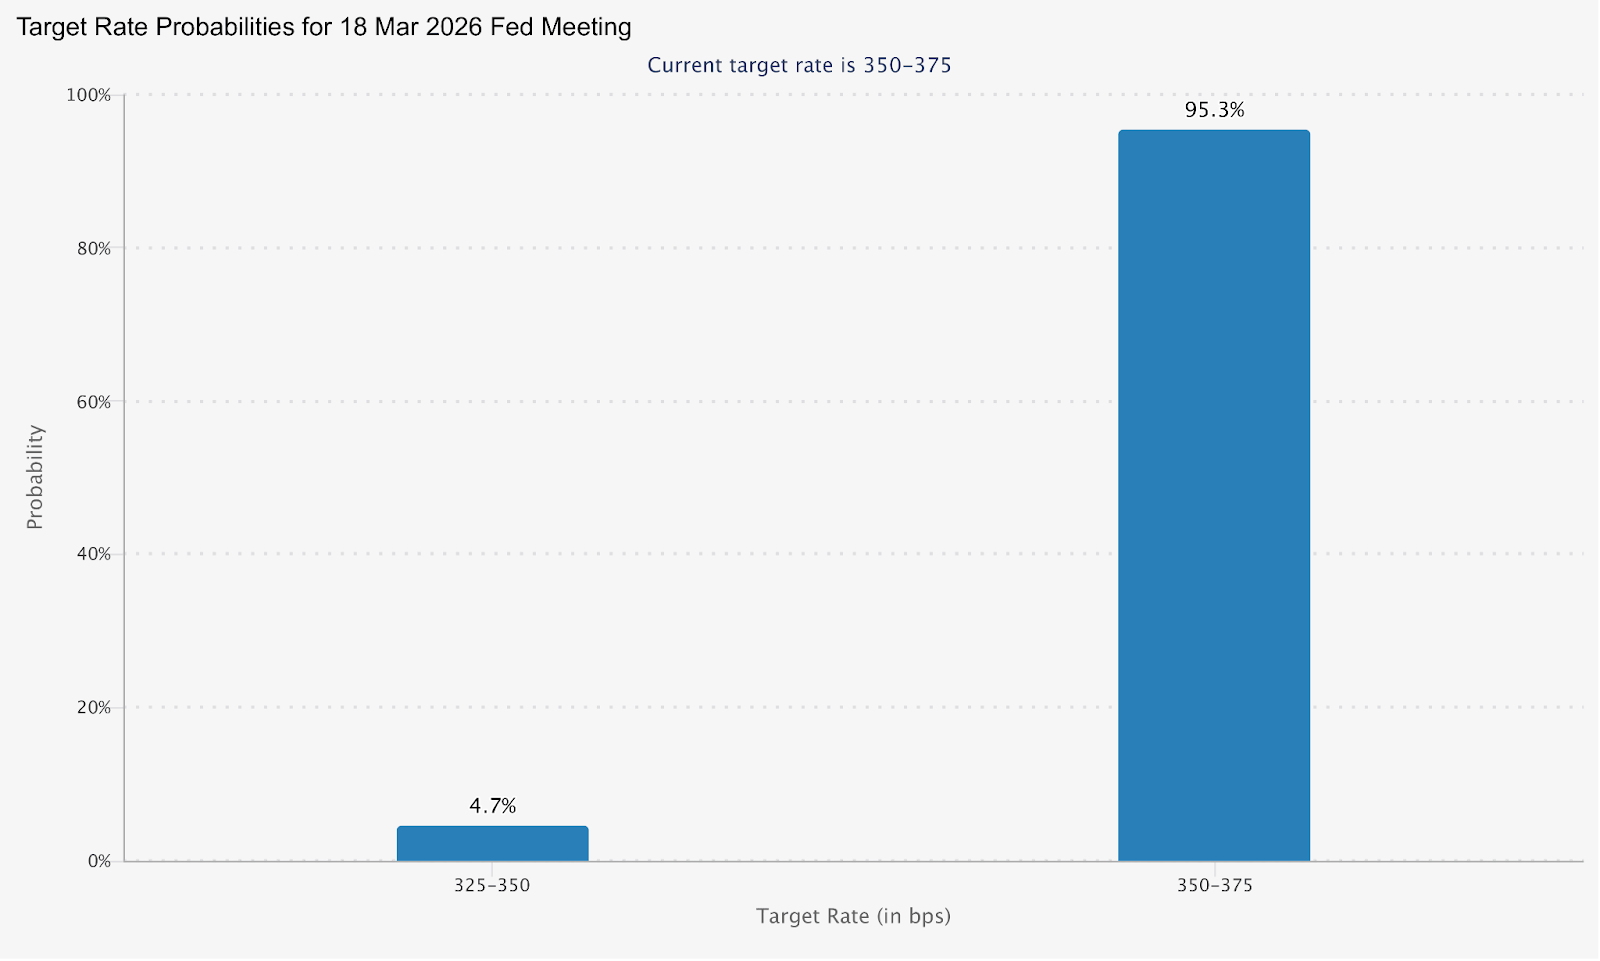
The March FOMC meeting on 17–18 March is now priced at only an 4.7% probability of a cut. A higher-than-expected inflation print this week could potentially push rate cut expectations further out.
A softer read opens the door to renewed cut pricing and potential relief across risk assets.
Key Dates
- US Inflation Rate (February CPI): Wednesday 11 March, 12:30 am (AEDT)
Monitor
- Core vs. headline inflation divergence as evidence of tariff pass-through in goods prices.
- 2-year and 10-year treasury yield sensitivity to the print.
- USD direction and FedWatch repricing in the lead up to the 18 March FOMC decision.
Oil: elevated and event-sensitive
Brent is currently trading around US$83–85 per barrel, with a 52-week range spanning $58.40 to $85.12, reflecting the dramatic move triggered by the Middle East conflict.
Analysts estimate the geopolitical risk premium already baked into oil at US$4–$10 per barrel, and average 2026 Brent forecasts have been lifted to US$63.85/bbl, up from US$62.02 in January.
The EIA's Short-Term Energy Outlook forecasts Brent to average $58/bbl in 2026, well below the current spot price.
The gap between spot and the forecast baseline could be a useful frame for traders this week: any de-escalation signal from the Middle East could rapidly close that gap.
Monitor
- Strait of Hormuz developments and any diplomatic signals from Iran nuclear talks.
- EIA weekly oil inventory data.
- Oil's knock-on to inflation expectations and whether it shifts central bank posture.
- Energy sector equity performance relative to the broader market.
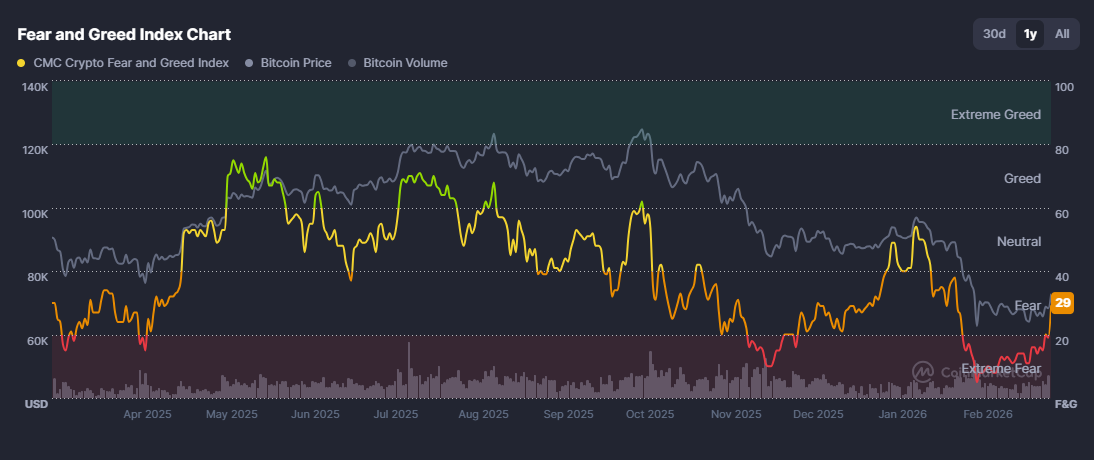
Bitcoin: sentiment watch
BTC has been attempting to stabilise after a brutal 53% correction over the past 17 weeks, fuelled by escalating geopolitical tensions and renewed tariff concerns.
However, yesterday saw a 8% jump back above $72,000, and the crypto “fear and greed index” jumped up to 29 (fear), up from below 20 (extreme fear), where it has been sitting for over a month, indicating a potential sentiment shift.
A cooler-than-expected US inflation print on Wednesday could provide further fuel for the breakout; a hot print risks potentially pulling BTC back below the US$70,000 level it has just reclaimed.
Monitor
- Inflation print reaction on Wednesday as the primary macro catalyst for the move.
- Any rotation into altcoins following BTC strength.
- ETF inflow/outflow data as confirmation of institutional participation.
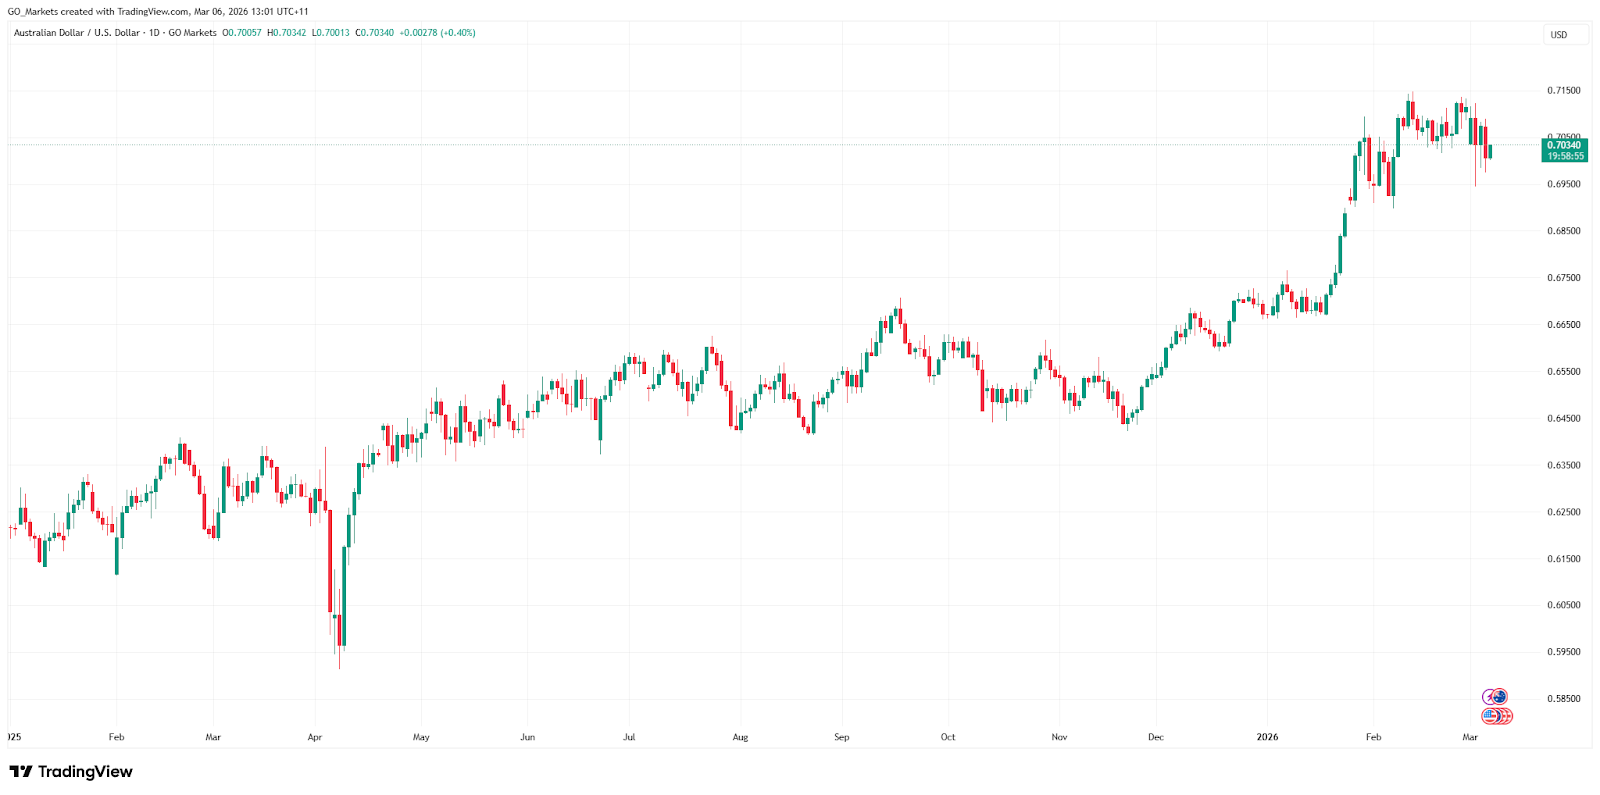
AUD/USD: Hawkish RBA meets geopolitical crosswinds
The Aussie is trading near more than three-year highs and heading for its fourth consecutive monthly gain, up more than 6% year-to-date, making it the top-performing G10 currency in 2026.
The driver is a clear policy divergence. RBA Governor Michele Bullock signalled the March policy meeting is "live" for a possible rate increase, and warned that an oil price shock from Iran tensions could reignite domestic inflationary pressures.
Market pricing now suggests around a 28% chance of a 25bp hike at the upcoming meeting, while fully pricing in tightening through May, and around a 75% chance of another increase to 4.35% by year-end.
This hawkish read, set against a Fed on hold and facing dovish political pressure, creates a potential structural tailwind for the Aussie.
Monitor
- AUD/USD reaction to Wednesday's US inflation data.
- RBA rate hike probability repricing through the week.
- Iron ore and commodity prices as secondary AUD drivers.
- China demand signals, given Australia's export exposure.

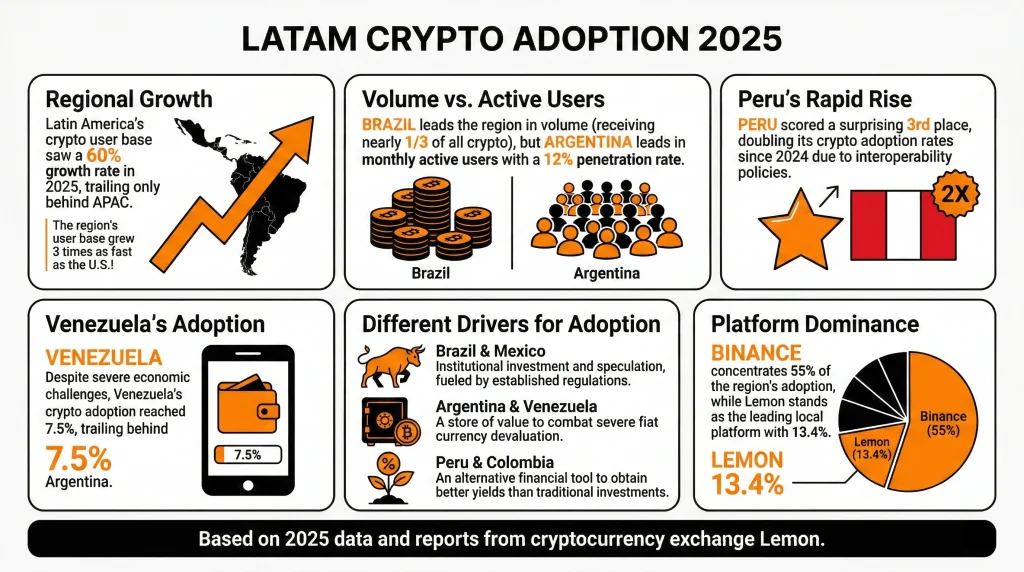
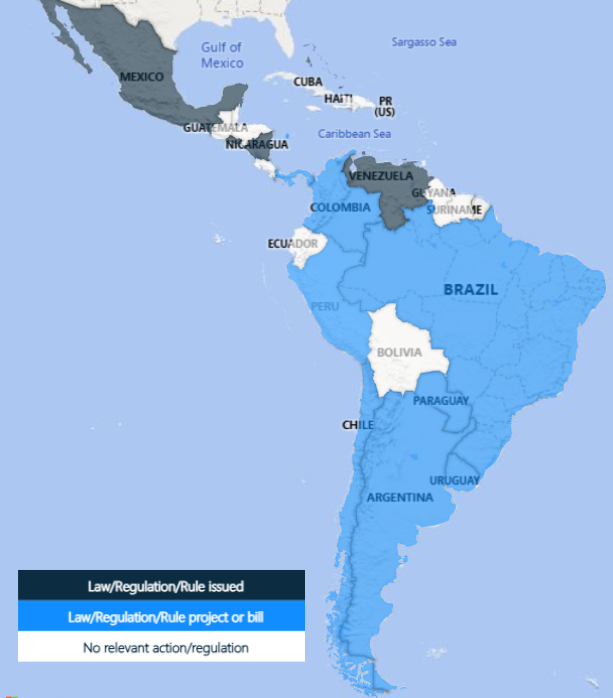
Latin America (LATAM) saw over $730 billion in crypto volume in 2025, a 60% year-on-year surge that made the region responsible for roughly 10% of global crypto activity.
In 2026, institutional players are starting to take the region seriously, regulation is crystallising, and the structural drivers from 2025 show no sign of fading. But the region is not a single story, and 2026 will test whether the current momentum is built on solid fundamentals or speculative optimism.
Quick facts
- LATAM monthly active crypto users grew 18% year-on-year (YoY), three times faster than the US.
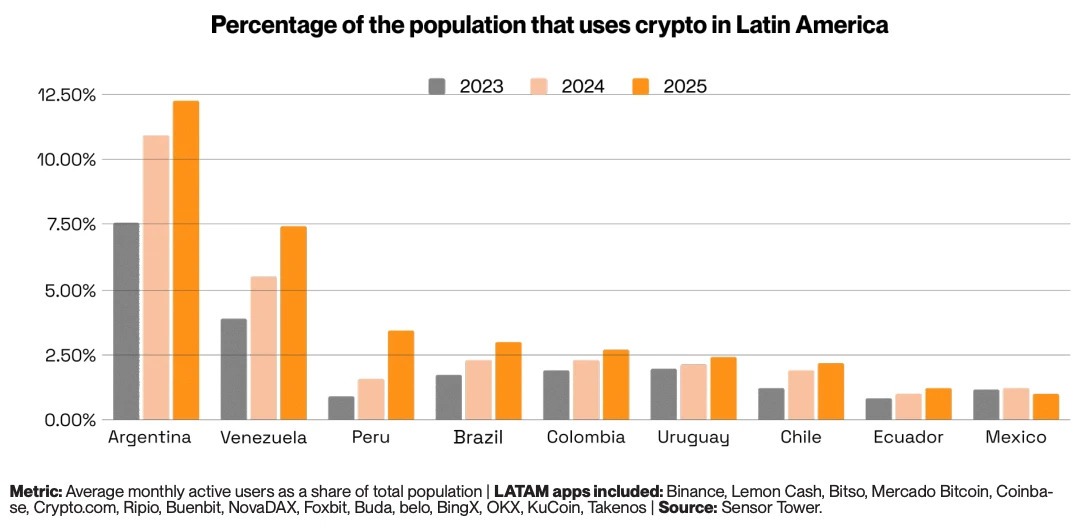
- Argentina reached 12% monthly active user penetration, accounting for over a quarter of the region's crypto activity.
- Over 90% of Brazilian crypto flows are now stablecoin-related.
- Three LATAM countries rank in the global top 20: Brazil (5th), Venezuela (18th), Argentina (20th).
- Peru's crypto app downloads grew 50% in 2025, with 2.9 million downloads.
From survival tool to financial infrastructure
Latin America did not embrace cryptocurrency because of speculation. It embraced it because traditional financial systems repeatedly failed ordinary people. Over the past 15 years, average annual inflation across the region's five largest economies ran at 13%, compared to just 2.3% in the US over the same period.
In Venezuela, it reached 65,000% in a single year. In Argentina, it exceeded 220% in 2024. For millions of people, holding savings in local currency was a slow act of self-destruction. Stablecoins became the natural response. Digital assets pegged to the US dollar offered a reliable store of value, borderless transferability, and access without a bank account.
Unlike in the West, where crypto is seen more as a speculative instrument, in LATAM it has become a necessary financial tool. However, adoption drivers are not entirely uniform across the region. Brazil and Mexico are institutional stories, driven by regulated market participation and established financial players.
Argentina and Venezuela remain store-of-value plays, with crypto serving as a direct hedge against fiat collapse. And Peru and Colombia are more yield-seeking markets, where crypto offers returns that traditional savings accounts cannot match.
How fast is LATAM adopting crypto?
LATAM’s on-chain crypto volume rose 60% year-on-year in 2025. The region has recorded nearly $1.5 trillion in cumulative volume since mid-2022, peaking at a record $87.7 billion in a single month in December 2024.
Monthly active crypto users across LATAM also grew 18% in 2025, three times faster than the US.
Stablecoins are the primary vehicle driving this adoption. Of the $730 billion received in 2025, $324 billion moved through stablecoin transactions, an 89% year-on-year surge. In Brazil, over 90% of all crypto flows are stablecoin-related, and in Argentina, stablecoins account for over 60% of activity.
Looking ahead, the Latin America cryptocurrency market is forecast to reach $442.6 billion by 2033, growing at a compound annual rate of 10.93% from 2025, according to IMARC Group.
For traders, the speed of adoption matters less as a headline than what is driving it: a region of 650 million people building parallel financial infrastructure in real time, with stablecoins as the foundation.
The institutional turn
For most of LATAM’s crypto history, adoption was bottom-up. Unbanked or underbanked retail users drove volumes through local exchanges. That picture is now changing at the top end of the market.
In February 2026, Crypto Finance Group, part of the leading global exchange operator Deutsche Börse Group, announced its expansion into Latin America, targeting banks, asset managers, and financial intermediaries seeking institutional-grade custody and trading infrastructure.
Traditional banks and fintechs are following suit. Nubank now rewards customers for holding USDC. Brazil's B3 exchange approved the world's first spot XRP and SOL ETFs, ahead of the US, in 2025. Centralised exchanges, including Mercado Bitcoin, NovaDAX, and Binance, have collectively listed over 200 new BRL-denominated trading pairs since early 2024.
In March 2025, Brazilian fintech Meliuz became the first publicly traded company in the country to launch a Bitcoin accumulation strategy, now holding 320 BTC.
“Crypto adoption in LatAm is already global-scale. What the market needs now is institutional-grade governance, and that’s exactly why we’re here,” — Stijn Vander Straeten, CEO of Crypto Finance Group
Crypto remittance use case
Latin America receives hundreds of billions of dollars annually from workers abroad, making remittances one of the most concrete and measurable crypto use cases in the region. Traditional transfer services charge an average of 6.2% per transaction. On a US$300 transfer, that is roughly US$20 in fees.
Blockchain-based infrastructure more broadly offers dramatic fee reductions. Bitcoin brings costs to around US$3.12 per US$100 transferred. While cheaper alternatives like XRP or Ethereum layer-2 infrastructure can reduce that to less than US$0.01.
For a migrant worker sending US$1,500 home to Peru, switching from a legacy bank saves more than the average Peruvian weekly wage in fees alone.
LATAM’s crypto regulatory environment
The variable that will most determine whether LATAM lives up to its 2026 potential is crypto regulation. And here, the picture is genuinely mixed.
Brazil leads the region with its Virtual Assets Law, which covers asset segregation, VASP licensing, AML/KYC requirements, and capital standards. It also implemented the Travel Rule for domestic VASP transfers, which came into force in February 2026. However, some more controversial proposals, including a US$100,000 cap on cross-border stablecoin transactions and a ban on self-custody wallet transfers, remain under active consultation.
Mexico's 2018 Fintech Law remains one of the world's earliest formal recognitions of virtual assets. Chile's 2023 Fintech Law established licences for exchanges, wallets, and stablecoin issuers, formally recognising digital assets as 'digital money.'
Bolivia reversed a decade-long crypto ban in June 2024 by authorising regulated digital asset transactions. Argentina introduced mandatory exchange registration in 2025. And El Salvador continues to expand tokenised economic initiatives despite removing Bitcoin's legal tender status.
Ten countries across the region now have formal crypto frameworks of some kind. But for traders, regulatory divergence remains a live risk, and given Brazil receiving nearly one-third of all LATAM crypto volume, any significant policy reversal there could have outsized consequences.
What traders should watch
Brazil's institutional momentum is the most significant structural trend. With $318.8 billion in on-chain volume in 2025, Brazil effectively is the LATAM market.
The outcome of the Brazil stablecoin consultation could have a big influence. A restriction on foreign stablecoins in domestic payments would directly impact the most traded asset class in the region's dominant market.
Argentina is the volatility play. Monthly active user penetration of 12% and 5.4 million crypto app downloads in 2025 signal deep and growing retail engagement.
Colombia is an early-warning market to watch. The peso's 5.3% depreciation in 2025 and deepening fiscal crisis are driving stablecoin inflows in a pattern that mirrors Argentina's trajectory in earlier years. If Colombia's macro situation deteriorates further, crypto adoption could accelerate.
There is also an exchange concentration risk at play. Binance crypto exchange is the primary exchange for over 50% of LATAM crypto users. If the exchange faces any regulatory action, operational disruption, or competitive shock, it could have an outsized market impact.
Bottom line
Latin America's crypto market has entered a new phase. The structural drivers that caused initial crypto-demand in the region have not gone away: inflation, remittances, financial exclusion, and currency instability are all still at play.
What has changed is the layer being built on top of them. Institutional infrastructure, regulatory frameworks, corporate treasury adoption, and global exchange capital flowing into a region that was, until recently, largely self-contained.
Brazil's near-250% volume growth in 2025 and its position receiving nearly one-third of all LATAM crypto are the defining market developments. Its regulatory trajectory, stablecoin policy decisions, and ETF pipeline will effectively set the tone for the region in 2026.
For traders, the headline growth figures are real, but so are the concentration risks, regulatory uncertainties, and country-level divergences that sit beneath them.

On February 28, 2026, as the joint US and Israeli attack began, the numbers on the screens started moving in ways that felt clinical, even as the reality on the ground with the tragic deaths of civilian casualties in Iran, felt anything but. Markets, as they say, do not have a moral compass, rather they have a weighing machine and right now, they are weighing the transition of the entire global economy from a "just-in-time" model to a "just-in-case" cycle.
What markets were signalling
On March 2, the index tape stayed cautious while defence rose. Historically, conflicts can speed up restocking and orders but how big it gets (and how fast) still depends on budgets, approvals and delivery bottlenecks.
The Winners
1. Hanwha Aerospace (012450.KS)
Hanwha is one of the more actively traded names linked to the “K-Defence” theme, a company markets increasingly view as a scalable supplier into a tightening global artillery and munitions cycle. Capacity and delivery credibility.
When replenishment becomes urgent, the ability to produce at scale often matters as much as the platform itself. Export demand tied to systems like the K9 Thunder and Chunmoo has reinforced the narrative of durable order flow even when outcomes still hinge on budgets, approvals and delivery timelines.
Key things that can move sentiment: order-book updates, production cadence, and any follow-on export announcements.
2. Northrop Grumman (NOC)
Northrop moved into focus as investors repriced exposure to strategic modernisation and large, long-running programs. Defence markets often seen as mission-critical can persist across cycles. It’s less about one quarter and more about whether momentum stays steady if modernisation priorities remain in place (and whether timelines shift if they don’t).
Key variables that can move sentiment: Procurement pace, contract timing, and program-related funding language.
3. RTX Corporation (RTX)
RTX returned to the centre of the tape as investors priced an interceptor replenishment cycle and the economics of high-tempo air defence. Attrition is expensive and when usage rates rise, governments typically have to replenish inventories and, in many cases, fund production expansion which can extend backlog and lift revenue visibility.
Key variables that can move sentiment: Replenishment orders, manufacturing expansion indicators, and delivery throughput.
4. Lockheed Martin (LMT)
Lockheed drew attention as markets focused on missile-defence demand and the question every procurement desk faces in a high-tempo environment: how fast can inventories be rebuilt? If utilisation stays elevated, the winners tend to be the contractors best positioned to scale production and deliver reliably. Lockheed’s missile defence exposure keeps it closely tied to that replenishment narrative.
Key variables that can move sentiment: production ramp signals, unit economics, and budget-driven order cadence.
5. BAE Systems (BA.L)
With an £83.6 billion backlog and a central role in the AUKUS submarine program, BAE moved into focus as parts of Europe signalled higher defence spending ambitions. The stock rose 6.11% to a 52-week high amid a “risk-off” rotation, with traders watching AUKUS milestones and European air and missile defence procurement, including “Sky Shield”.
Key variables that can move sentiment: A potential catalyst is any clear step-up in German spending that lifts order flow across BAE’s European units, while key risks include a sharp spike in UK gilt yields, renewed pound sterling volatility, or “threat of peace” profit-taking.
The Losers: not every ‘war stock’ rises
6. AeroVironment (AVAV)
AeroVironment surged 18% at the open before falling 17% intraday after reports that the US Space Force was reopening a US$1.4 billion contract. The move highlights how procurement processes and contract risk can drive volatility, even in supportive thematic environments.
7. Kratos Defence (KTOS)
Kratos sits in the drone and loitering munition theme that gained attention as the Middle East conflict intensified. The stock still sold off after earnings, highlighting a common defence-sector risk. Kratos announced a large follow-on equity offering in the US$1.2 billion to US$1.4 billion range, the move strengthens the balance sheet and can support future program investment.
For traders focused on short-term “conflict premium” narratives, dilution can quickly change the setup. Even when demand conditions appear supportive, the market may reprice the stock if each shareholder ultimately owns a smaller portion of the business.
8. Intuitive Machines (LUNR)
Some speculative space-tech names lagged as investors appeared to favour companies with more established defence-linked revenue.
9. Boeing (BA)
Boeing was down around 2.5% on the session. While its defence division is meaningful, its commercial business can be more sensitive to aviation demand, airspace disruptions and oil-price moves.
10. Spirit AeroSystems (SPR)
Spirit AeroSystems remains closely tied to the global aircraft production cycle as a major aerostructures supplier. Recent results showed widening losses despite higher sales, reflecting ongoing production cost increases on major aircraft programs. These pressures have weighed on investor confidence in the near-term outlook. The planned acquisition by Boeing may ultimately reshape the company’s position in the supply chain, but execution risk and production stability remain central to how the market prices the stock.
What to watch next
- Escalation vs de-escalation: A shift toward diplomacy or ceasefire discussions can quickly change sentiment around defence stocks.
- Oil and shipping: Energy spikes can tighten financial conditions and pressure cyclical sectors.
- Budgets and awards: Price moves can sometimes precede contract decisions, with clarity arriving when awards are finalised.
- Production capacity: Companies with proven production and delivery track records often attract the most investor attention.
- Supply chain constraints: Rare earths, propulsion and electronics remain potential bottlenecks that can limit how quickly production scales.
The longer term lens
The 2026 Iran conflict is first and foremost a human tragedy. For markets, it may also represent a shift in how national security spending is prioritised within fiscal frameworks. If defence spending remains elevated over a multi year horizon, companies with scalable manufacturing capacity and integrated technology stacks could attract sustained investor attention. That said, markets move in cycles. Structural themes can persist, but they can also reprice quickly when assumptions change. Staying analytical and risk aware remains critical.
References to specific companies, sectors or market movements are provided for general market commentary only and do not constitute a recommendation, offer or solicitation to buy or sell any financial product.Market reactions to geopolitical or macroeconomic events can be volatile and unpredictable, and outcomes may differ materially from expectations.

Volatility doesn't discriminate. But it can punish the unprepared.
Stops getting hit on moves that reverse within minutes. Premiums on short-dated options climbing. And the yen no longer behaving as the reliable hedge it once was.
For traders across Asia, navigating this environment means asking harder questions about risk, timing, and the assumptions baked into strategies built for calmer markets.
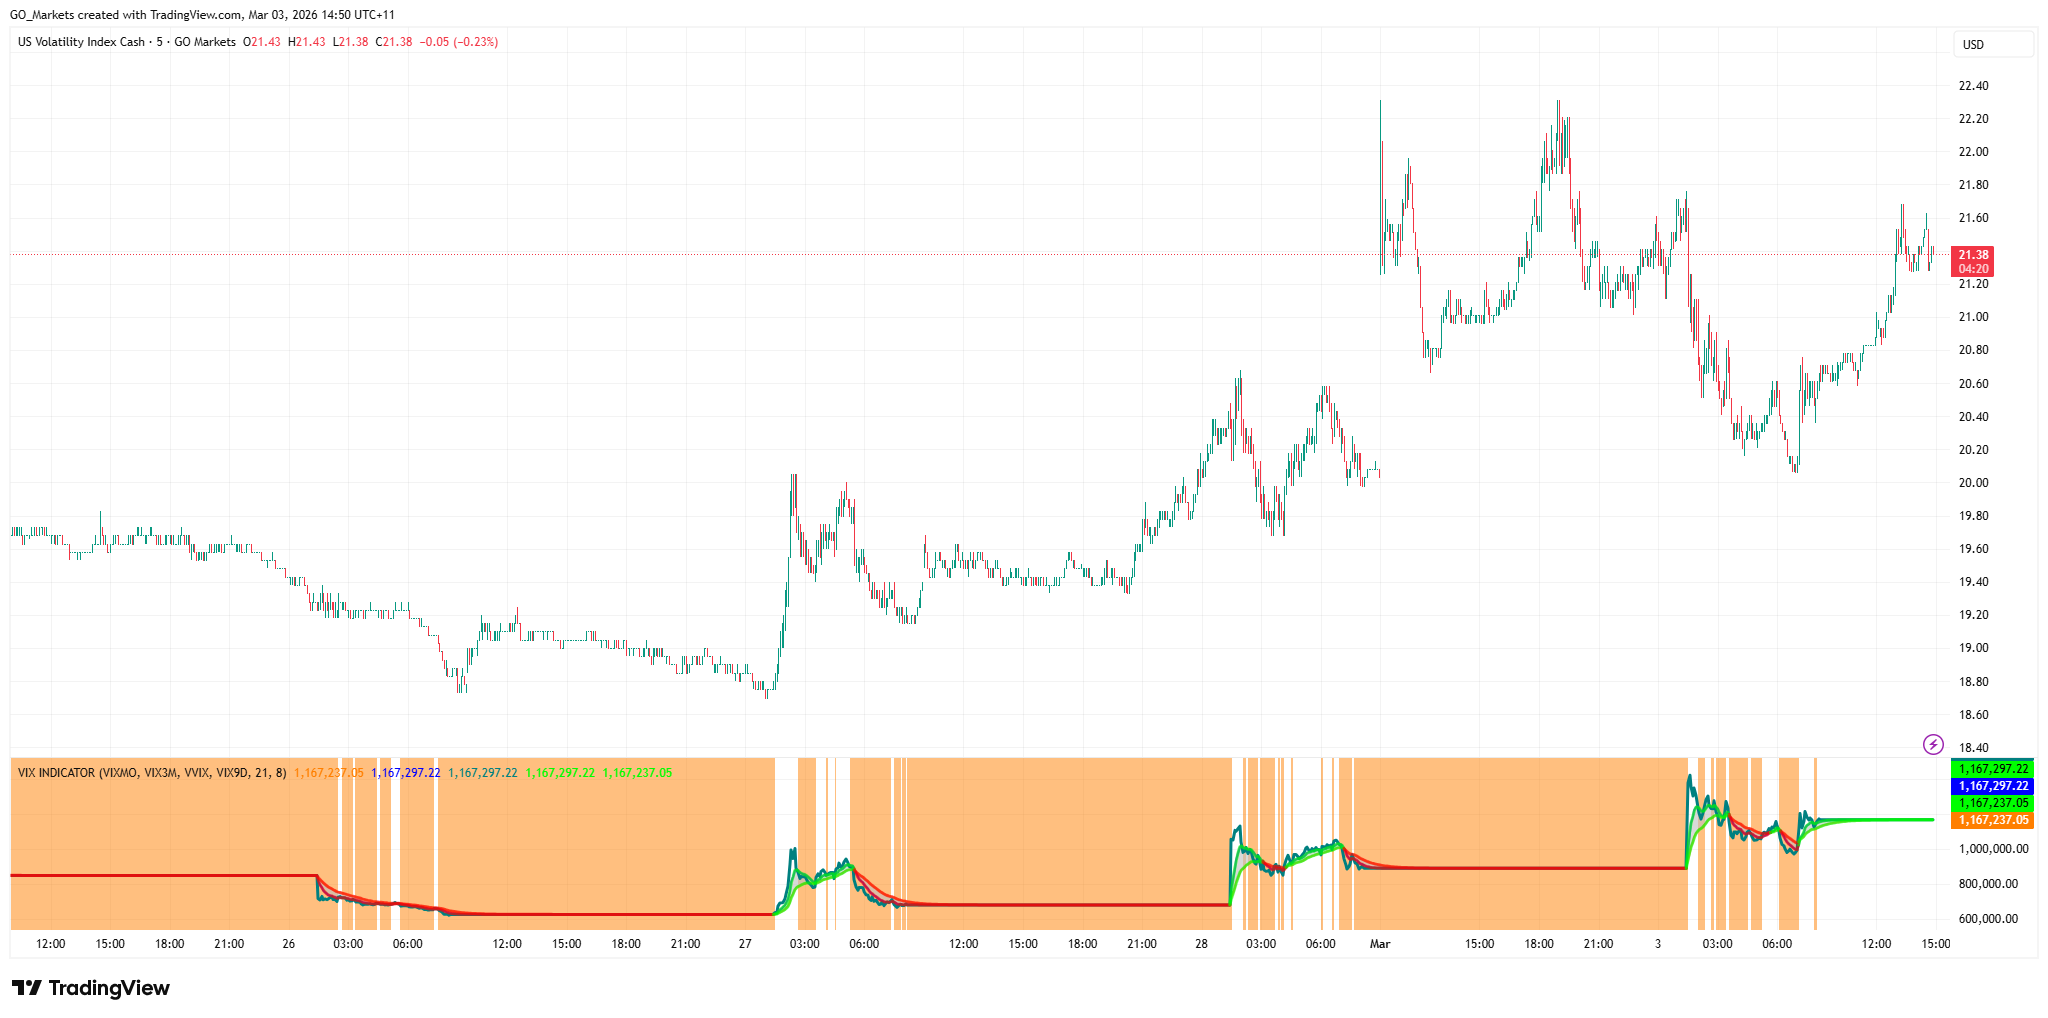
1. How do I trade VIX CFDs during a geopolitical shock?
The CBOE Volatility Index (VIX) measures the market’s expectation of 30-day implied volatility on the S&P 500. It is often called the “fear gauge.” During geopolitical shocks such as the current Iran escalations, sanctions announcements, and surprise central bank actions, the VIX can spike sharply and quickly.
What makes VIX CFDs different in a shock
VIX itself is not directly tradeable. VIX CFDs are typically priced off VIX futures, which means they carry contango drag in normal conditions.
During a geopolitical shock, several things can happen at once
- Spot VIX may spike immediately while near-term futures lag, creating a disconnect.
- Spreads on VIX CFDs can widen significantly as liquidity thins.
- Margin requirements may change intraday as broker risk models adjust.
- VIX tends to mean-revert after spikes, so timing and duration are critical.
What this means for Asian-hours traders
Asian market hours mean many geopolitical events can break while local traders are active or just starting their session.
A shock that hits during Tokyo hours may already be priced into VIX futures before Sydney opens.
Some traders use VIX CFD positions as a short-term hedge against equity portfolios rather than a directional trade. Others trade the reversion (the move back toward historical averages once the initial spike fades). Both approaches carry distinct risks, and neither guarantees a specific outcome.
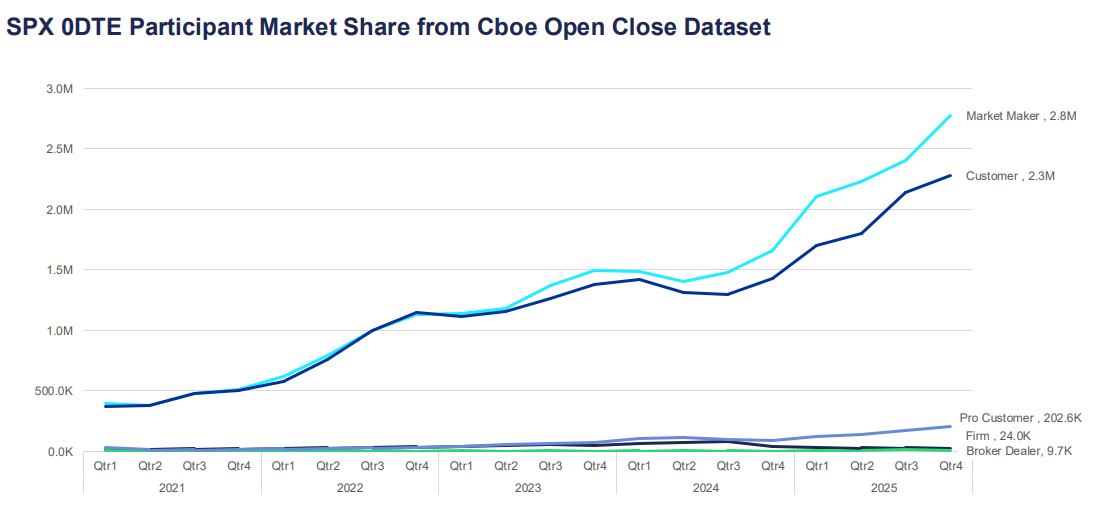
2. Why are my 0DTE options premiums so expensive right now?
Zero days-to-expiry (0DTE) options expire on the same day they are traded. They have become one of the fastest-growing segments of the options market, now representing more than 57% of daily S&P 500 options volume according to Cboe global markets data.
For Asian-based participants accessing US options markets, elevated premiums during volatile periods can feel like mispricing, but usually reflects structural pricing factors.
Why premiums spike
Options pricing is driven by intrinsic value and time value. For 0DTE options, there is almost no time value left, which might suggest they should be cheap but the implied volatility component compensates for that.
When uncertainty increases, sellers may demand greater compensation for the risk of sharp intraday moves.
This can be reflected in
- Higher implied volatility inputs.
- Wider bid-ask spreads.
- Faster adjustments in delta and gamma hedging.
In higher-VIX environments, hedging flows can contribute to short-term feedback loops in the underlying index. This can amplify price swings, particularly around key levels.
What this means for Asian-hours traders
Many 0DTE options contracts see their most active pricing and hedging flows during US trading hours. Entering positions during the Asian session may mean facing stale pricing or wider spreads.
If you are seeing expensive premiums, it may reflect the market accurately pricing the risk of a large same-day move. Whether that premium is worth paying depends on your view of the likely intraday range and your risk tolerance, not on the absolute dollar figure alone.
3. How do I adjust my algorithmic trading bot for a high-VIX environment?
Many algorithmic trading systems are built on parameters calibrated during lower-volatility regimes. When VIX spikes, those parameters can become outdated quickly.
The regime mismatch problem
Most trading algorithms use historical data to set position sizes, stop distances, and entry thresholds. That data reflects the conditions during which the system was tested. If VIX moves from 15 to 35, the statistical assumptions underpinning those settings may no longer hold.
Common failure modes in high-VIX environments include
- Stops triggered repeatedly by noise before the intended directional move occurs.
- Position sizing based on fixed-dollar risk, which becomes relatively small compared to actual intraday ranges.
- Correlation assumptions between assets breaking down.
- Slippage on execution that erodes edge.
Approaches some algorithmic traders consider
Rather than running a single fixed set of parameters, some systems incorporate a volatility regime filter. This is a real-time check on VIX or ATR that triggers a switch to different settings when conditions shift.
Approach adjustments that some traders review in high-VIX environments
- Widen stop distances proportionally to ATR to reduce noise-driven exits.
- Reduce position size to maintain constant dollar risk relative to wider expected ranges.
- Add a VIX threshold above which the system pauses or moves to paper trading mode.
- Reduce the number of simultaneous positions, as correlations tend to rise during market stress.
No adjustment eliminates risk. Backtesting new parameters on historical high-VIX periods can provide some indication of likely performance, though past conditions are not a reliable guide to future outcomes.
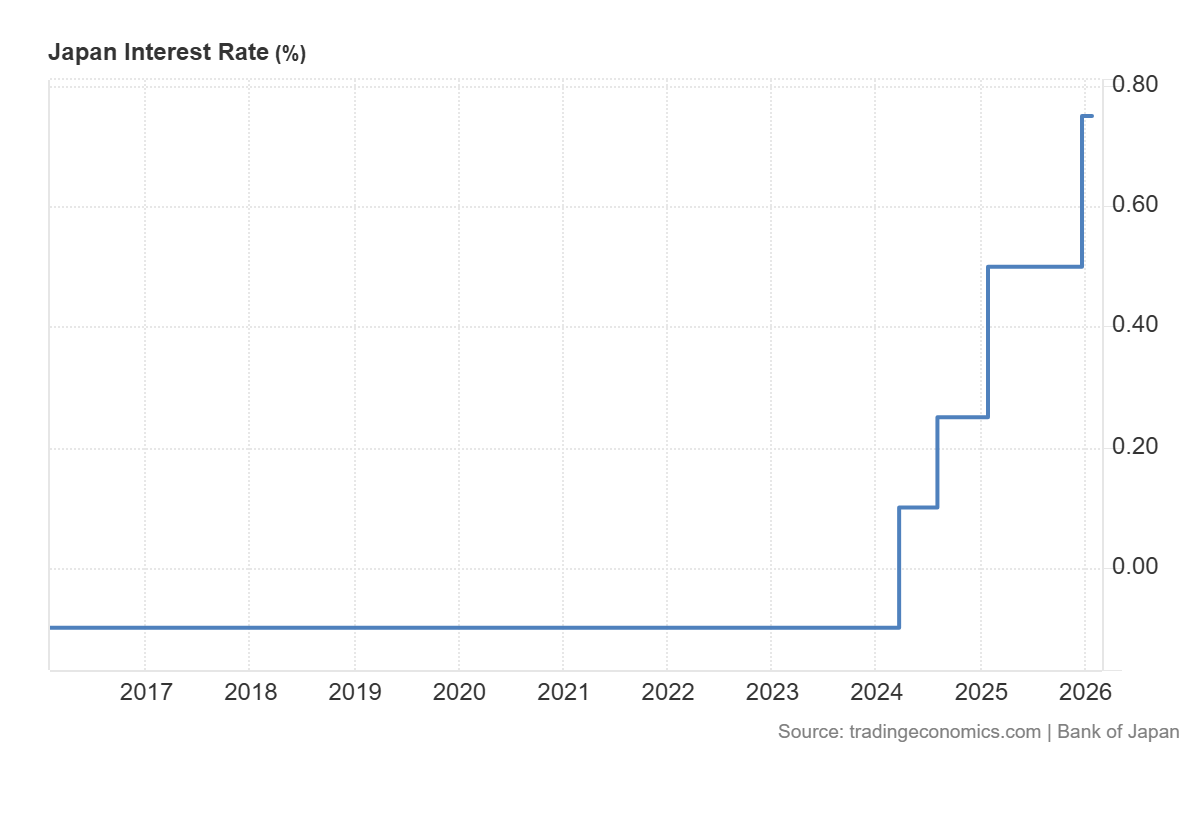
4. Is the Japanese Yen (JPY) still a reliable safe-haven trade?
During periods of global risk aversion, capital has historically flowed into JPY as investors unwind carry trades and seek lower-volatility holdings. However, the reliability of this dynamic has become more conditional.
Why has the yen historically moved as a safe haven?
Japan’s historically low interest rates made JPY the funding currency of choice for carry trades and when risk-off sentiment hits, those trades unwind quickly, creating demand for yen.
Additionally, Japan’s large net foreign asset position means Japanese investors tend to repatriate capital during crises, further supporting JPY.
What has changed
The Bank of Japan’s shift away from ultra-loose monetary policy in recent years has complicated the traditional safe-haven dynamic.
As Japanese interest rates rise:
- The scale of carry trade positioning may change.
- USD/JPY can become more sensitive to interest rate spreads.
- BoJ communication and domestic inflation data may influence JPY independently of global risk appetite.
The yen can still behave as a safe haven, particularly during sharp equity sell-offs. But it may respond more slowly or inconsistently compared to earlier cycles when the policy divergence between Japan and the rest of the world was more extreme.
What to watch
For traders monitoring JPY as a safe-haven signal, BoJ meeting dates, Japanese CPI releases, and real-time US-Japan rate spread data have become more relevant inputs than they were a few years ago.
5. How do I avoid ‘whipsawing’ on energy CFDs?
Whipsawing describes the experience of entering a trade in one direction, getting stopped out as the price reverses, then watching the price move back in the original direction.
Energy CFDs, particularly crude oil, are especially prone to this in volatile markets. And for traders in Asia, the combination of thin liquidity during local hours and sensitivity to geopolitical headlines can make this particularly challenging.
Why energy CFDs whipsaw
Crude oil is sensitive to a wide range of headline drivers: OPEC+ production decisions, US inventory data, geopolitical supply disruptions, and currency moves.
In high-volatility environments, the market can react strongly to each headline before reversing when the next one arrives.
- Price spikes on a headline, stops are triggered on short positions.
- Traders re-enter long, expecting continuation.
- A second headline or profit-taking reverses the move.
- Long stops are hit. The cycle repeats.
Approaches traders may consider to manage whipsaw risk
Some traders choose to change their risk controls in volatile conditions (for example, reviewing stop placement relative to volatility measures). However these may increase losses; execution and slippage risks can rise sharply in fast markets
Other approaches that some traders review:
- Avoid trading crude oil CFDs in the 30 minutes before and after major scheduled data releases.
- Use a longer timeframe chart to identify the prevailing trend before entering on a shorter timeframe, reducing the chance of trading against larger institutional flows.
- Scale into positions in stages rather than committing full size on initial entry.
- Monitor open interest and volume to distinguish between moves with genuine participation and low-liquidity fakeouts.
Whipsawing cannot be eliminated entirely in volatile energy markets. The goal of risk management in these conditions is not to predict which moves will hold, but to ensure that losses on false moves are smaller than gains when a genuine directional move follows.
Practical considerations for volatile Asian markets
Asian markets carry structural characteristics that interact with volatility differently from US or European markets:
- Thinner liquidity during local hours can exaggerate moves on thin volume, particularly in energy and FX CFDs.
- Events in China, including PMI releases, trade data, and PBOC policy signals, can move regional indices.
- BoJ policy decisions have become a more active driver of JPY and Nikkei volatility in recent years.
- Overnight gaps from US session moves are a persistent structural risk for traders unable to monitor positions around the clock.
- Margin requirements on leveraged products can change at short notice during high-VIX periods.
Frequently asked questions about volatility in Asian markets
What does a high VIX reading mean for Asian equity indices?
VIX measures expected volatility on the S&P 500, but elevated readings typically reflect global risk aversion that flows across markets. Asian indices such as the Nikkei 225, Hang Seng, and ASX 200 can often see increased volatility and negative correlation with sharp VIX spikes.
Can 0DTE options be traded during Asian hours?
Access depends on the platform and the specific instrument. US equity index 0DTE options are most actively priced during US trading hours. Asian traders may face wider spreads and less representative pricing outside those hours.
Are algorithmic trading strategies inherently riskier in high-volatility conditions?
Strategies calibrated during low-volatility periods may perform differently in high-VIX environments. Regular review of parameters against current market conditions is prudent for any systematic approach.
Has the JPY safe-haven trade changed permanently?
The Bank of Japan’s policy normalisation has introduced new dynamics, but JPY has continued to strengthen during some risk-off episodes. It may be more conditional on the nature of the shock and the BoJ’s concurrent posture.
What is the best way to set stops on energy CFDs in high-volatility conditions?
There is no universally best method. Many traders reference ATR to calibrate stop distances to prevailing conditions rather than using fixed levels. This does not guarantee exit at the desired price and does not eliminate whipsaw risk.

Volatility has a way of showing up uninvited.
One day the ASX is drifting quietly... and the next, margin requirements rise, stops do not fill where expected, and portfolios open with uncomfortable overnight gaps.
If you have been searching for answers, you are not alone. Some of the most searched questions about volatility among Australian traders relate to margin calls, slippage, overnight gaps, leveraged exchange traded funds (ETFs), and tools such as average true range (ATR).
Here is what is happening.
Why this matters now
Global markets have become more sensitive to interest rates, inflation data, geopolitics and technology-driven flows. When liquidity thins and uncertainty rises, price swings widen. That is volatility.
And volatility doesn’t just affect price direction, it changes how trades are executed, how much capital is required, and how risk behaves beneath the surface.
Translation: Volatility is not just about bigger moves, rather, it’s about faster moves and thinner liquidity - that’s when the mechanics of trading matter most.
Want a real-world volatility case study?
Why did my broker increase margin requirements?
One of the most searched questions about volatility is why margin requirements increase without warning.
When markets become unstable, brokers may increase margin requirements on contracts for difference (CFDs) and other leveraged products. Larger price swings can increase the risk of accounts moving into negative equity thus raising margin requirements reduces available leverage and can help manage exposure during extreme conditions.
What this can mean in practice
-A margin call may occur even if price has not moved significantly.
-Effective leverage can drop quickly.
-Positions may need to be reduced at short notice.
Margin adjustments are typically a response to changing market risk, not a random decision. In highly volatile markets, it is prudent to assume margin settings can change quickly, therefore many traders choose to review position sizes and available buffers in light of that risk.
What is slippage and why didn’t my stop fill at my price?
Another frequently searched topic is slippage.
Slippage can occur when a stop order triggers and is executed at the next available price, the outcome can depend on the order type, market liquidity and gaps. In calm markets, the difference may be small whereas in fast markets, prices can gap beyond the stop level.
Common drivers include
-Major economic or earnings releases.
-Thin liquidity.
-Crowded stop levels.
-Overnight sessions.
Stop-loss orders generally prioritise execution rather than price certainty and during periods of high volatility, this distinction becomes important. Adjusting position size and placing stops with reference to typical price movement may be more effective than simply tightening stops in unstable conditions.
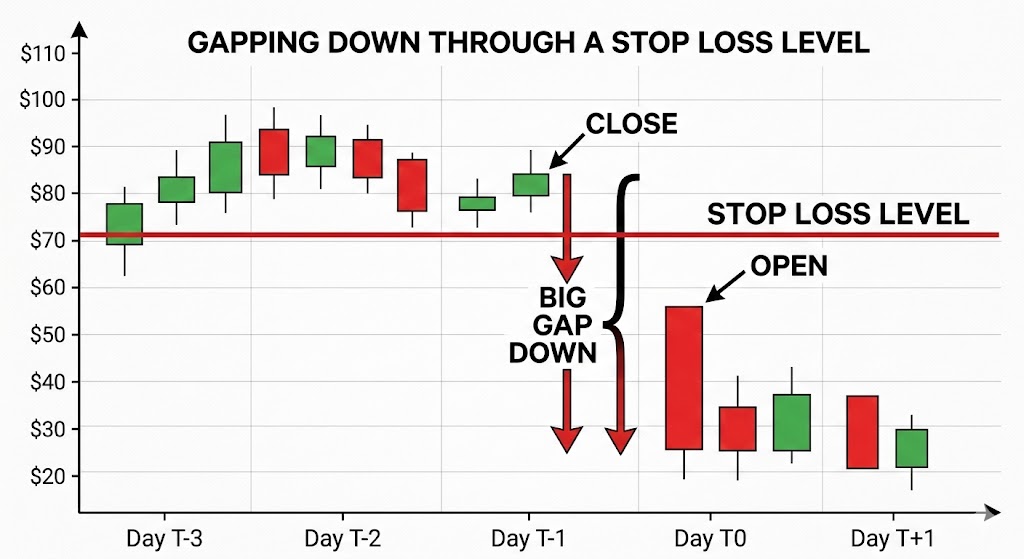
How do I manage overnight gapping on the ASX?
Australia trades while the United States sleeps, and vice versa. This time zone difference is, sadly, one reason overnight gap risk is frequently searched by Australian traders. If US markets fall sharply, the ASX may open lower the following morning, with no opportunity to exit between the close and the open.
Examples of risk-management approaches market traders may use include
-Index hedging using ASX 200 futures or CFDs*.
-Partial hedging during high risk events.
-Reducing exposure ahead of major macro announcements.
Hedging can offset part of a move, but it introduces basis risk as individual stocks may not move in line with the broader index.
There is no perfect protection, only trade-offs between cost, complexity and risk reduction.
*CFDs are complex instruments and come with a high risk of losing money due to leverage.
What are the key risks of leveraged or inverse ETFs in volatile markets?
Leveraged and inverse ETFs are often searched during periods of heightened volatility.
While these products typically reset daily, they aim to deliver a multiple of the index’s daily return, not its long-term return. In a volatile, sideways market, daily compounding can erode value even if the index finishes near its starting level.
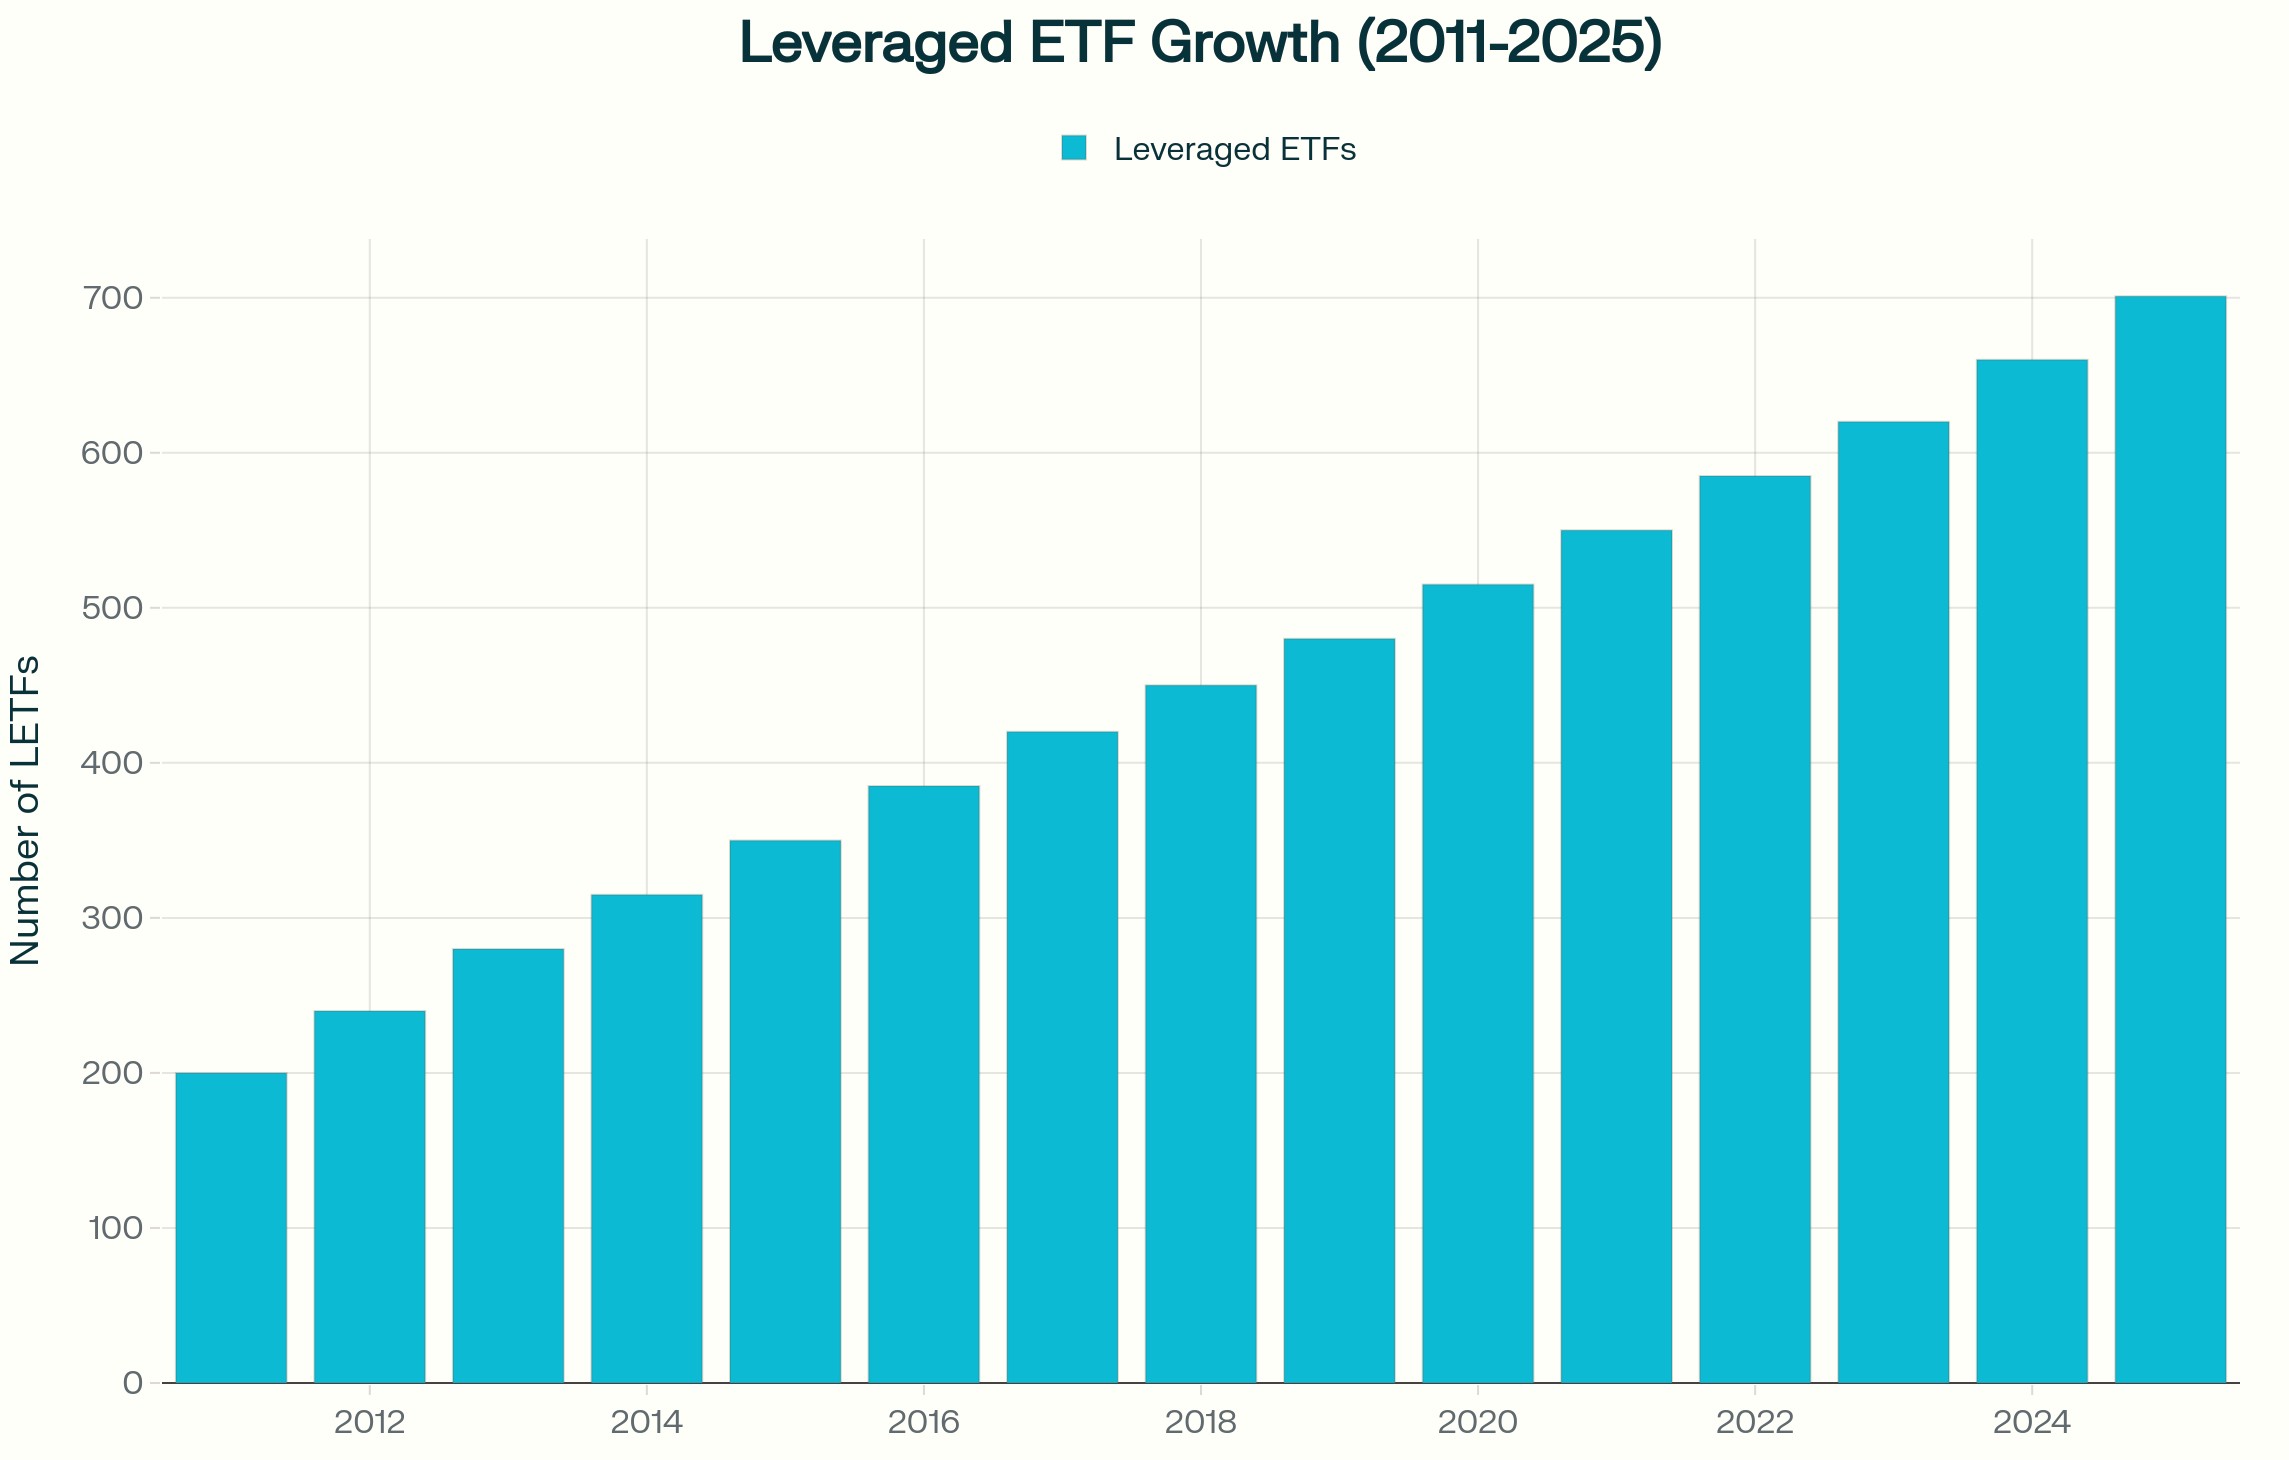
This occurs because gains and losses compound asymmetrically. A fall of 10 percent requires a gain of more than 10 percent to recover. When that effect is multiplied daily, outcomes can diverge materially from the underlying index over time.
Such instruments may be used tactically by some market participants. They are generally not designed as long-term hedging tools and understanding their structure is essential before using them in a strategy.
How can ATR be used to inform stop placement?
Average true range (ATR) is a commonly used indicator for measuring volatility.
ATR estimates how much an asset typically moves over a given period, including gaps. Rather than setting a stop at an arbitrary percentage, some traders reference ATR and place stops at a multiple, such as two or three times ATR, to reflect prevailing conditions.
When volatility rises, ATR expands and that can imply wider stops or smaller position sizes if overall risk is to remain constant. The shift is from asking, “How far am I willing to lose?” to asking, “What is a normal move in current conditions?"
Practical considerations in volatile markets
During periods of elevated volatility, traders may consider
- Allowing for the possibility of margin changes
- Sizing positions conservatively if volatility increases
- Recognising that stop-loss orders do not guarantee a specific exit price
- Reviewing exposure ahead of major economic events
- Understanding the daily reset mechanics of leveraged ETFs
- Using volatility measures such as ATR to inform stop placement
- Maintaining adequate cash buffers
Volatility does not reward prediction alone. Preparation and risk awareness may assist traders in understanding potential risks, but outcomes remain unpredictable.
Read: Global volatility and how to trade CFD
What this means for Australian traders
Australian markets face specific structural considerations cpmapred to Asian and US Markets. Overnight gap risk is influenced by US trading hours and resource heavy indices such as the ASX can respond quickly to commodity price movements and data from China. Currency exposure, including AUD and US dollar (USD) moves, can add another layer of variability.
Volatility is not uniform across regions. It behaves differently depending on market structure and liquidity depth.
Frequently asked questions about volatility
What causes sudden spikes in market volatility?
Interest rate decisions, inflation data, geopolitical developments, earnings surprises and liquidity constraints are common triggers.
Why do brokers increase margin during volatile markets?
To reduce leverage exposure and manage risk when price swings widen.
Can stop-loss orders fail during volatility?
They can experience slippage if markets gap beyond the stop level, meaning execution may occur at a worse price than expected. In fast or illiquid markets, this difference can be significant.
Are leveraged ETFs suitable for long term hedging?
They are generally structured for short-term exposure due to daily resets. Whether they are appropriate depends on your objectives, financial situation and risk tolerance.
How can volatility be measured before placing a trade?
Tools such as ATR, implied volatility indicators and historical range analysis can help quantify prevailing conditions.
Risk warning: Periods of heightened volatility can lead to rapid price movements, margin changes and execution at prices different from those expected. Risk-management tools such as stop-loss orders and volatility indicators may assist in assessing market conditions but cannot eliminate the risk of loss, particularly when using leveraged products.