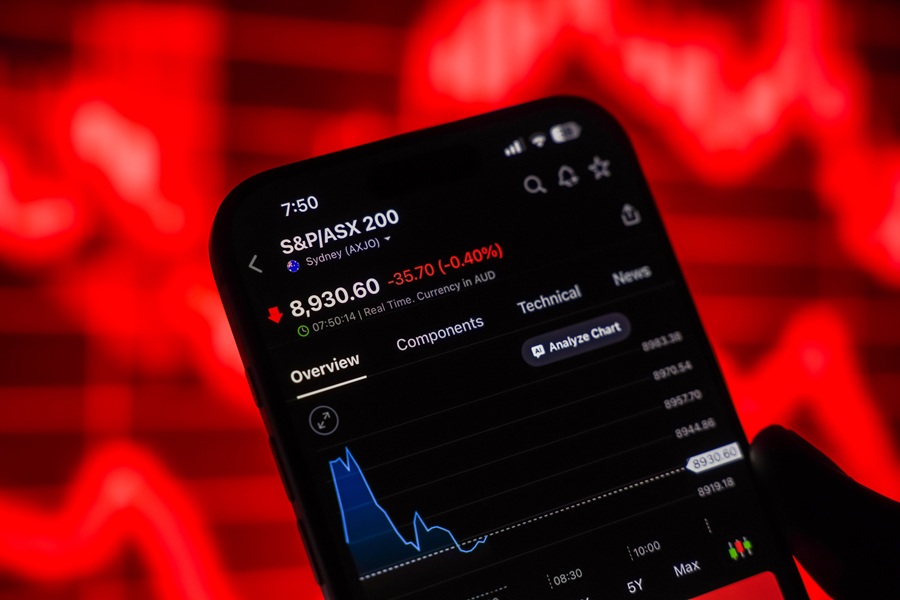
Thirteen ASX-listed companies report this August, with margins, dividends and guidance in focus.
Australia's August reporting season is moving into focus against a market running at different speeds. Resource stocks delivered their strongest financial-year performance since 2006, while some industrial and consumer-facing businesses continued to navigate persistent inflation.
Here is the macro backdrop, the key themes across major sectors and the reporting calendar.
01 | Setting the scene
The August 2026 macro environment
Two forces are set to shape how markets interpret this season's results: the interest rate outlook and the effect of household cost pressures on company revenue, margins and guidance.
Reserve Bank of Australia
4.35% cash rate
The Reserve Bank of Australia (RBA) increased the cash rate three times in 2026, lifting it to 4.35% in May before leaving it unchanged in June.
The next monetary policy decision is due on 4 August 2026, during the early stages of reporting season. This may increase the significance of company commentary on funding costs and consumer demand.
S&P/ASX 200 return
6.1% total return
The S&P/ASX 200 Index recorded a total return of 6.1% during the 2025 to 2026 financial year (FY26). This was below its longer-term average total return of about 9.6%.
Performance varied considerably by sector. Resources outperformed, while several technology, healthcare and consumer-facing companies had a more difficult year.
Consumer sentiment
Elevated cost pressures
Higher borrowing costs and persistent inflation continue to place pressure on household budgets.
Consumer-facing companies may report softer sales volumes, even where higher prices have supported headline revenue. Commentary on customer demand, discounting and margins may therefore be closely watched.
The earnings outlook
Projections for the FY27
After a period of uneven earnings growth, some market forecasts point to stronger earnings growth during the 2026 to 2027 financial year (FY27).
A result that meets FY26 expectations may still receive a cautious market reaction if the outlook for revenue, margins or cash flow weakens.
Select a sector to explore some of the issues that may feature in company results and management commentary.
Banking
Note: While Commonwealth Bank (CBA) releases its full-year results, peer banks ANZ, NAB and Westpac operate on a different financial calendar and will provide third-quarter (Q3) trading updates this month.
Net interest margins: Competition for deposits and mortgages may continue to affect net interest margins (NIMs), which measure the difference between interest earned and interest paid.
Bad debts and credit provisions: Arrears, impaired loans and provisions may provide further information about household and business credit conditions.
Capital management: Investors may look for updates on dividends, surplus capital and share buyback programs, alongside the outlook for credit growth.
Materials and mining
Commodity demand: Global industrial activity may remain an important influence on commodity prices, revenue and guidance.
Copper investment: Companies may provide further detail on copper projects, development costs and expected production.
Iron ore costs: Unit costs and operational discipline may remain in focus as iron ore prices fluctuate.
Cost inflation: C1 cash costs and all-in sustaining costs (AISC) may show how labour, energy and equipment expenses are affecting margins.
Consumer and retail
Changing spending patterns: Consumers may continue to prioritise essential purchases and lower-priced products over some discretionary categories.
Volume and price: Revenue growth may reflect higher prices rather than an increase in the number of products sold.
Margin management: Labour, supply chain and input costs may affect how effectively retailers protect margins.
Healthcare and real estate
Plasma margins: Collection costs, volumes and operating efficiency may remain important for companies exposed to plasma-derived therapies.
Data centre investment: Data centre development and capital expenditure (capex) may feature in commentary from some industrial and logistics property groups.
Property valuations: Interest rates, capitalisation rates and funding costs may influence valuations and development decisions.
03 | Income
Dividend expectations and payout resilience
Dividend policies vary significantly across companies and sectors. A single payout ratio range may not accurately represent the broader S&P/ASX 200.
Headline dividends are therefore only one part of the picture. Other considerations include cash flow, debt, capital expenditure (capex) requirements, franking levels and the company's stated payout policy.
Typical ASX 200 payout ratio band
Indicative range: 60% to 80% of net profit after tax (NPAT)
0%Typical band100%
Within typical range
Outside typical range
FACTORS SUPPORTING PAYOUTS
Companies with strong operating cash flow, manageable debt and fewer major investment requirements may have greater flexibility to maintain dividends.
This does not guarantee that current payout or franking levels will continue.
FACTORS PRESSURING PAYOUTS
Weaker cash generation, rising capex, higher financing costs or declining margins may place pressure on dividends or franking levels.
Any change to the dividend can be assessed alongside the company's balance sheet, cash flow statement and outlook.
04 | The calendar
The late July and August 2026 reporting calendar
The following calendar covers the 13 large ASX-listed companies that GO Markets is tracking this season, with reporting dates between 29 July and 27 August.
Result types include half-year 2026 (HY26), FY26 and Q3 updates.
13 companies
Ticker
Company
Sector
Result
Indicative date
RIO
Rio Tinto
Materials
HY26
29 July
WBC
Westpac Banking Corp
Banking
Q3 update
10 August
CBA
Commonwealth Bank
Banking
FY26
12 August
ANZ
ANZ Group Holdings
Banking
Q3 update
13 August
TLS
Telstra Group
Communications
FY26
13 August
NAB
National Australia Bank
Banking
Q3 update
17 August
BHP
BHP Group
Materials
FY26
18 August
CSL
CSL Limited
Healthcare
FY26
18 August
GMG
Goodman Group
Real estate
FY26
20 August
FMG
Fortescue
Materials
FY26
24 August
WDS
Woodside Energy
Energy
HY26
25 August
WOW
Woolworths Group
Consumer staples
FY26
26 August
WES
Wesfarmers
Consumer discretionary
FY26
27 August
Calendar note: Dates are indicative and may be revised by the companies.
The information provided is of general nature only and does not take into account your personal objectives, financial situations or needs. Before acting on any information provided, you should consider whether the information is suitable for you and your personal circumstances and if necessary, seek appropriate professional advice. All opinions, conclusions, forecasts or recommendations are reasonably held at the time of compilation but are subject to change without notice. Past performance is not an indication of future performance. Go Markets Pty Ltd, ABN 85 081 864 039, AFSL 254963 is a CFD issuer, and trading carries significant risks and is not suitable for everyone. You do not own or have any interest in the rights to the underlying assets. You should consider the appropriateness by reviewing our TMD, FSG, PDS and other CFD legal documents to ensure you understand the risks before you invest in CFDs. These documents are available here. Any references to Australian or international shares, sectors, indices, ETFs, crypto-related stocks or other instruments are provided for market commentary and watchlist purposes only and do not constitute a recommendation, offer or solicitation to buy, sell or hold any financial product or adopt any investment strategy. International markets may involve additional risks, including currency fluctuations, regulatory differences, market structure differences, reduced liquidity and higher volatility. Company-specific, sector-specific and macroeconomic risks may also affect performance.
Commentary on geopolitical developments, economic data, central bank decisions, earnings, policy changes and other global or financial market events is based on information available at the time of publication and may change without notice. Such events can lead to sudden market moves, price gaps, reduced liquidity, wider spreads and increased volatility, particularly in leveraged products such as CFDs. Forward-looking statements, expectations and scenario analysis are inherently uncertain and should not be relied on as guarantees of future market behaviour or outcomes.
Part three of GO Markets’ index trading series, explaining how the ASX 200 tracks leading Australian companies and reflects domestic market conditions.
The US cattle inventory has dropped to a 75-year low, but ASX agribusinesses react with contrasting margins. Compare balance sheet exposure with rural agency turnover.