The Bollinger Band reversal is a mean-reversion strategy that looks for the price to temporarily overextend beyond its typical range before snapping back inside.It consists of three lines:
An upper band
A lower band
A 20-period simple moving average (SMA) in the middle.
The Upper band and Lower band are set at a default level two standard deviations from the SMA.When the price closes outside one of the bands, it often signals significant price momentum. This level of momentum is often followed by "move exhaustion” and subsequently pulls back to a more usual state. If the next move returns price inside the bands, this may offer a possible reversal opportunity. This setup can happen on any timeframe on any asset.As always with any chart pattern, the pattern can only be thought of as complete when there is a confirmation candle. Confluence factors such as where the candle sits in relation to the range (e.g., in the top half for a bullish trade) and increased volume are often considered part of a complete trading plan in the Bollinger Band reversal setup.
Bearish Bollinger Band Reversal
A bearish reversal occurs when the price moves sharply above the upper band, showing extreme buying pressure, but then closes back inside the band. This can suggest the price may have become overextended, and sellers are attempting to regain control.
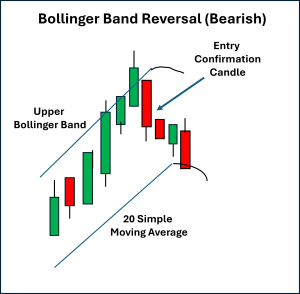
B: Over-extension → a candle closes outside the band, showing unsustainable momentum.
C: Re-entry with confirmation → a subsequent bearish candle closes back inside the band, confirming the reversal.
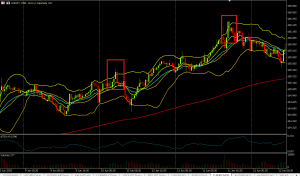
The EURJPY 30-minute chart below shows two examples of this setup in action:
Bullish Bollinger Band Reversal
A bullish reversal can be seen on a chart when the price falls below the lower band, showing extreme selling pressure, but then closes back inside the lower band. This suggests that the downward trend in price is becoming exhausted, and buyers are stepping in.
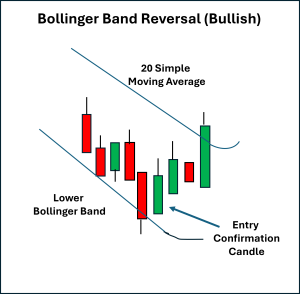
B: Over-extension → a candle closes outside the band, showing unsustainable downside pressure.
C: Re-entry with confirmation → a subsequent bullish candle closes back inside the band, validating the reversal.
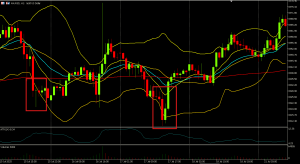
The Gold Futures CFD 1-hourly chart below shows two examples of this setup in action:
Stop Placement and Exits
Initial risk management stops are generally placed just beyond the candle that closed outside the band:
In bearish setups: the stop goes above the high of the candle that closed outside the upper band.
In bullish setups: the stop goes below the low of the candle that closed outside the lower band.
Exit strategies often include:
Using the 20-period SMA (the “mean” in the mean reversion) as a potential profit target or signal to trail the initial stop level.
Using a set risk-to-reward ratio, such as 2:1.
Final Thoughts
The Bollinger Band reversal is a popular mean reversion strategy that takes advantage of price extremes. Traders who are developing a formal trading plan with this setup wait for a close outside the bands, a re-entry of price inside the bands (in the opposite direction), and a confirmation candle.In essence, traders are attempting to capitalise on the pullback.It is important to note that price can “walk the bands” for an extended time, so risk management with stop placements should be part of any plan using this setup.Practicing across different market conditions, asset classes, and timeframes will help identify where Bollinger Band reversals are most effective and how best to integrate them into your trading toolbox.
By
Mike Smith
Mike Smith (MSc, PGdipEd)
Client Education and Training
The information provided is of general nature only and does not take into account your personal objectives, financial situations or needs. Before acting on any information provided, you should consider whether the information is suitable for you and your personal circumstances and if necessary, seek appropriate professional advice. All opinions, conclusions, forecasts or recommendations are reasonably held at the time of compilation but are subject to change without notice. Past performance is not an indication of future performance. Go Markets Pty Ltd, ABN 85 081 864 039, AFSL 254963 is a CFD issuer, and trading carries significant risks and is not suitable for everyone. You do not own or have any interest in the rights to the underlying assets. You should consider the appropriateness by reviewing our TMD, FSG, PDS and other CFD legal documents to ensure you understand the risks before you invest in CFDs. These documents are available here.
Every trader has had that moment where a seemingly perfect trade goes astray.
You see a clean chart on the screen, showing a textbook candle pattern; it seems as though the market planets have aligned, and so you enthusiastically jump into your trade.
But before you even have time to indulge in a little self-praise at a job well done, the market does the opposite of what you expected, and your stop loss is triggered.
This common scenario, which we have all unfortunately experienced, raises the question: What separates these “almost” trades from the truly higher-probability setups?
The State of Alignment
A high-probability setup isn’t necessarily a single signal or chart pattern. It is the coming together of several factors in a way that can potentially increase the likelihood of a successful trade.
When combined, six interconnected layers can come together to form the full “anatomy” of a higher-probability trading setup:
Context
Structure
Confluence
Timing
Management
Psychology
When more of these factors are in place, the greater the (potential) probability your trade will behave as expected.
Market Context
When we explore market context, we are looking at the underlying background conditions that may help some trading ideas thrive, and contribute to others failing.
Regime Awareness
Every trading strategy you choose to create has a natural set of market circumstances that could be an optimum trading environment for that particular trading approach.
For example:
Trending regimes may favour momentum or breakout setups.
Ranging regimes may suit mean-reversion or bounce systems.
High-volatility regimes create opportunity but demand wider stops and quicker management.
Investing time considering the underlying market regime may help avoid the temptation to force a trending system into a sideways market.
Simply looking at the slope of a 50-period moving average or the width of a Bollinger Band can suggest what type of market is currently in play.
Sentiment Alignment
If risk sentiment shifts towards a specific (or a group) of related assets, the technical picture is more likely to change to match that.
For example, if the USD index is broadly strengthening as an underlying move, then looking for long trades in EURUSD setups may end up fighting headwinds.
Setting yourself some simple rules can help, as trading against a potential tidal wave of opposite price change in a related asset is not usually a strong foundation on which to base a trading decision.
Key Reference Zones
Context also means the location of the current price relative to levels or previous landmarks.
Some examples include:
Weekly highs/lows
Prior session ranges, e.g. the Asian high and low as we move into the European session
Major “round” psychological numbers (e.g., 1.10, 1000)
A long trading setup into these areas of market importance may result in an overhead resistance, or a short trade into a potential area of support may reduce the probability of a continuation of that price move before the trade even starts.
Market Structure
Structure is the visual rhythm of price that you may see on the chart. It involves the sequences of trader impulses and corrections that end up defining the overall direction and the likelihood of continuation:
Uptrend: Higher highs (HH) and higher lows (HL)
Downtrend: Lower highs (LH) and lower lows (LL)
Transition: Break in structure often followed by a retest of previous levels.
A pullback in an uptrend followed by renewed buying pressure over a previous price swing high point may well constitute a higher-probability buy than a random candle pattern in the middle of nowhere.
Compression and Expansion
Markets move through cycles of energy build-up and release. It is a reflection of the repositioning of asset holdings, subtle institutional accumulation, or a response to new information, and may all result in different, albeit temporary, broad price scenarios.
Compression: Evidenced by a tightening range, declining ATR, smaller candles, and so suggesting a period of indecision or exhaustion of a previous price move,
Expansion: Evidenced by a sudden breakout, larger candle bodies, and a volume spike, is suggestive of a move that is now underway.
A breakout that clears a liquidity zone often runs further, as ‘trapped’ traders may further fuel the move as they scramble to reposition.
A setup aligned with such liquidity flows may carry a higher probability than one trading directly into it.
Confluence
Confluence is the art of layering independent evidence to create a whole story. Think of it as a type of “market forensics” — each piece of confirmation evidence may offer a “better hand’ or further positive alignment for your idea.
There are three noteworthy types of confluence:
Technical Confluence – Multiple technical tools agree with your trading idea:
Moving average alignment (e.g., 20 EMA above 50 EMA) for a long trade
A Fibonacci retracement level is lining up with a previously identified support level.
Momentum is increasing on indicators such as the MACD.
Multi-Timeframe Confluence – Where a lower timeframe setup is consistent with a higher timeframe trend. If you have alignment of breakout evidence across multiple timeframes, any move will often be strengthened by different traders trading on different timeframes, all jumping into new trades together.
3. Volume Confluence – Any directional move, if supported by increasing volume, suggests higher levels of market participation. Whereas falling volume may be indicative of a lesser market enthusiasm for a particular price move.
Confluence is not about clutter on your chart. Adding indicators, e.g., three oscillators showing the same thing, may make your chart look like a work of art, but it offers little to your trading decision-making and may dilute action clarity.
Think of it this way: Confluence comes from having different dimensions of evidence and seeing them align. Price, time, momentum, and participation (which is evidenced by volume) can all contribute.
Timing & Execution
An alignment in context and structure can still fail to produce a desired outcome if your timing is not as it should be. Execution is where higher probability traders may separate themselves from hopeful ones.
Entry Timing
Confirmation: Wait for the candle to close beyond the structure or level. Avoid the temptation to try to jump in early on a premature breakout wick before the candle is mature.
Retests: If the price has retested and respected a breakout level, it may filter out some false breaks that we will often see.
Then act: Be patient for the setup to complete. Talking yourself out of a trade for the sake of just one more candle” confirmation may, over time, erode potential as you are repeatedly late into trades.
Session & Liquidity Windows
Markets breathe differently throughout the day as one session rolls into another. Each session's characteristics may suit different strategies.
For example:
London Open: Often has a volatility surge; Range breaks may work well.
New York Overlap: Often, we will see some continuation or reversal of morning trends.
Asian Session: A quieter session where mean-reversion or range trading approaches may do well
Trade Management
Managing the position well after entry can turn probability into realised profit, or if mismanaged, can result in losses compounding or giving back unrealised profit to the market.
Pre-defined Invalidation
Asking yourself before entry: “What would the market have to do to prove me wrong?” could be an approach worth trying.
This facilitates stops to be placed logically rather than emotionally. If a trade idea moves against your original thinking, based on a change to a state of unalignment, then considering exit would seem logical.
Scaling & Partial Exits
High-probability trade entries will still benefit from dynamic exit approaches that may involve partial position closes and adaptive trailing of your initial stop.
Trader Psychology
One of the most important and overlooked components of a higher-probability setup is you.
It is you who makes the choices to adopt these practices, and you who must battle the common trading “demons” of fear, impatience, and distorted expectation.
Let's be real, higher-probability trades are less common than many may lead you to believe.
Many traders destroy their potential to develop any trading edge by taking frequent low-probability setups out of a desire to be “in the market.”
It can take strength to be inactive for periods of time and exercise that patience for every box to be ticked in your plan before acting.
Measure “You” performance
Each trade you take becomes data and can provide invaluable feedback. You can only make a judgment of a planned strategy if you have followed it to the letter.
Discipline in execution can be your greatest ally or enemy in determining whether you ultimately achieve positive trading outcomes.
Bringing It All Together – The Setup Blueprint
Final Thoughts
Higher-probability setups are not found but are constructed methodically.
A trader who understands the “higher-probability anatomy” is less likely to chase trades or feel the need to always be in the market. They will see merit in ticking all the right boxes and then taking decisive action when it is time to do so.
It is now up to you to review what you have in place now, identify gaps that may exist, and commit to taking action!
One of the most impactful books I’ve ever read is “The 7 Habits of Highly Effective People: Powerful Lessons in Personal Change” by Stephen Covey.
When it was first published in 1989, it quickly became one of the most influential works in business and personal development literature, and retained its place on bestseller lists for the next couple of decades.
The compelling, comprehensive, and structured framework for personal growth presented in the book has undoubtedly inspired many to rethink how they organise their lives and priorities, both professionally and personally.
Although its lessons were originally designed for self-improvement and positive structured growth, the underlying principles are universal, making them easily transferable to many areas of life, including trading.
In this article, you will explore how each of Covey’s seven original habits can be reframed within a trading context, in an attempt to offer a structure that may help guide you to becoming the best trader you can be.
1. Be Proactive
Being proactive means recognising that we have the power to choose our responses and to shape outcomes through appropriate preparation with subsequent planned reactions.
In a Trading Context:
For traders, this means anticipating potential problems before they arise and putting measures in place to better mitigate risk.
Rather than waiting for issues to unfold, the proactive trader identifies potential areas of concern and ensures that they have access to the right tools, resources, and people to prepare effectively, whatever the market may throw at them.
What This Means for You:
Being proactive may involve seeking out quality education and services, maintaining access to accurate and timely market information, continually assessing risk and opportunity, and having systems to manage those risks within defined limits.
Consequences of Non-Action:
Inadequate preparation and a lack of defined systems often lead to poor trading decisions and less-than-desired outcomes.
Failing to assess risk properly can result in significant and often avoidable losses.
By contrast, a proactive approach builds resilience and confidence, ensuring that when challenges arise, your response is measured and less emotionally driven by what is happening on the screen in front of you.
2. Begin with the End in Mind
Covey's second habit is about defining purpose. It suggests that effective people are more likely to achieve what is possible if they start with a clear understanding of their destination, so every action aligns with that ultimate vision.
In a Trading Context:
Ask yourself: What is my true purpose for trading?
Many traders may instinctively answer “to make money,” but money is surely only a vehicle to achieve something else in your world for you and those you care about, not a purpose per se.
You need to clarify what trading success really means for you.
Is it a greater degree of financial independence through increased income or capital growth, the freedom of having more time, achieving a personal challenge of becoming an effective trader, or a combination of any of these?
What This Means to You:
Try framing your purpose as, “I must become a better trader so that I can…” and complete a list with your genuine reasons for tackling the market and its challenges.
This helps you establish meaningful short-term development goals that keep you moving toward your vision. Keep that purpose visible, as a note near your trading screen that reminds you why you are doing this.
Consequences of Non-Action:
Traders with a clearly defined purpose are more likely to stay disciplined and consistent.
Those without one often drift, chasing short-term gains without direction. There is ample evidence that formalising your development in whatever context through goal setting can significantly increase the likelihood of success. Why would trading be any different?
Surely the bottom-line question to ask yourself is, “Am I willing to risk my potential by trading without purpose?”
3. Put First Things First
This habit is about time management and prioritisation. This involves focusing your efforts and energy on what truly matters. As part of the exploration of this concept, Covey emphasised distinguishing between what is important and what is merely urgent.
In a Trading Context:
Trading demands commitment, learning, and reflection.
It is not just about screen time but about using that time effectively.
Managing activities to ensure your effort is spent wisely on planning, measuring, journaling and performance evaluation, and refining systems, accordingly, are all critical to sustaining both improvements in results and balance.
What This Means to You:
Traders often believe they need to spend more time trading when what they really need is to focus on better time allocation.
It is logical to suggest that prioritising activities that can often contribute directly to improvement, such as system testing, reviewing performance, analysing results, and refining your strategy, is worthwhile.
These high-value tasks can help traders focus their time more deliberately and systematically.
Consequences of Non-Action:
If you fail to control your trading time effectively, you will be more likely to spend much of it on low-impact activities that produce little progress.
Over time, this not only hurts your results but also reduces the real “hourly value” of your trading effort.
In business terms, and of course, you should be treating your trading as you would any business activity; poor prioritisation can inflate your costs and diminish your potential trading outcomes.
4. Think Win: Win
Covey's fourth habit encouraged an attitude of mutual benefit, where seeking solutions that facilitate positive outcomes for all parties.
In a Trading Context:
In trading, this concept must be adapted to suggest that developing a mindset that recognises every well-executed plan as a win, even when an individual trade results in a loss.
Some trading ideas will simply not work out, and so some losses are inevitable, but if they remain within defined limits, they should not be viewed as failures but rather as a successful adherence to a trading plan. In the aim of developing consistency in action, and the widely held belief that this is one of the cornerstones of effective trading, then it surely is a win to fulfil this.
So, in simple terms, the real “win” lies in a combination of maintaining discipline, following your system, and controlling risk beyond just looking at the P/L of a single trade.
What This Means to You:
Building and trading clear, unambiguous systems that you follow consistently has got to be the goal.
This process produces reliable data that you can later analyse and subsequently use to refine specific strategies and personal performance.
When you do this, every outcome, whether profit or loss, can serve as valuable feedback.
For example, a controlled loss that fits your plan is proof that your system works and that you are protecting your capital.
Alternatively, a trailing stop strategy, which means you exit trades in a timely way and give less profit back to the market, provides positive feedback that your system has merit in achieving outcomes.
Consequences of Non-Action:
Without this mindset shift, traders can become emotionally reactive, interpreting normal drawdowns as personal defeats.
This fosters loss aversion and other biases that can erode decision-making quality if left unchecked. Through the process of redefining “winning,” you are potentially safeguarding both your capital and, importantly, your trading confidence (a key component of trading discipline).
5. Seek First to Understand and Then Take Action
Covey's fifth habit emphasises empathy, the act of listening and aiming to fully understand before responding. In trading, this principle translates to understanding the market environment before taking any action.
In a Trading Context:
Many traders act impulsively, driven by excitement or fear, which often results in entering trades without taking into account the full context of what is happening in the market, and/or the potential short-term influences on sentiment that may increase risk.
This “minimalisation bias,” defined as acting on limited information, will rarely produce consistent results. Instead, adopt a process that begins with observation and comprehension.
What This Means to You:
Establishing a daily pre-trading routine is critical. This may include a review of key markets, sentiment indicators, and potential catalysts for change, such as imminent key data releases. Understanding what the market is telling you before you decide what to do is the aim of having this sort of daily agenda.
This approach may not only improve trade selection but also enable you to get into a state of psychological readiness that can facilitate decision-making quality throughout the session.
Consequences of Non-Action:
Failing to prepare for the trading day ahead can mean not only exposing yourself to unnecessary risk but also arguably being more likely to miss potential opportunities.
A trader who acts without understanding is vulnerable both psychologically and financially. Conversely, being forewarned is being forearmed. When you aim to understand markets first before any type of trading activity, your actions are more likely to be deliberate, grounded, and more effective.
6. Synergise
Synergy in Covey's model means valuing differences and combining the strengths of those around you to create outcomes greater than the sum of their parts.
In a Trading Context:
In trading, synergy refers to the integration of multiple systems and disciplines that work together. This includes your plan, your record keeping and performance management processes, your time management, and your emotional balance.
No single system is enough; success comes from the synergy of elements that support and inform one another.
What This Means to You:
Integrating learning and measurement is an integral part of your trading development process. Journaling, for example, allows you to assess not only your technical performance but also your behavioural consistency.
This self-awareness allows you to refine your plan and so helps you operate with greater confidence.
The synergy between rational analysis and emotional composure is what is more likely to lead to consistently sound trading decisions.
Consequences of Non-Action:
When logic and emotion are out of balance, decision-making will inevitably suffer.
If your systems are incomplete, ambiguous, or poorly connected to the reality of your current level of understanding, competence and confidence, your results are likely to be inconsistent. Building synergy across all areas of your trading practice, including that of evaluation and development in critical trading areas, will help create cohesion, efficiency, and better performance.
7. Sharpen the Saw
Covey's final habit focuses on continuous learning and refinement, including maintaining and improving the tools at your disposal and skills and knowledge that allow you to perform effectively.
In a Trading Context:
In trading, this translates to creating a plan to achieve ongoing, purposeful learning.
Even small insights can make a large difference in results. Effective traders continually refine their knowledge, ask new questions, and apply lessons from experience.
What This Means to You:
Trading learning can, of course, take many forms. Discovering new indicators that may offer some confluence to price action, testing different strategies, exploring new markets, or simply understanding more about yourself as a trader.
There is little doubt that active participation in learning keeps you engaged, adaptable and sharp. Even making sure you ask at least one question at a seminar or webinar or making a simple list at the end of each session of the "3 things I learned", can be invaluable in developing momentum for your growth as a trader.
Your record-keeping and performance metrics should generate fresh questions that can guide future development.
Consequences of Non-Action:
Without direction in your learning, your progress is likely to slow.
I often reference that when someone talks about trading experience in several years, this is only meaningful if there has been continuous growth, rather than staying in the same place every year (i.e. only one year of meaningful experience)
Passive trading learning, for example, reading an article without applying, watching a webinar without engagement, or measuring without closing the circle through putting an action plan together for your development, can all lead to stagnation.
It is fair to suggest that taking shortcuts in trading learning is likely to translate directly into shortcuts in result success.
Active, focused development is essential for sustained improvement.
Are You Ready for Action?
Stephen Covey’s The 7 Habits of Highly Effective People presented a timeless model for self-development and purposeful living.
When applied to trading, these same habits form a powerful framework for consistency, focus, and growth.
Trading is a pursuit that demands both technical skill and emotional strength. Success is rarely about finding the perfect system, but about developing the right habits that support consistent, rational decision-making over time.
By integrating the principles of Covey’s seven habits into your trading practice, you create a foundation not only for profitability but for continual personal growth.
A market bubble occurs when asset prices rise far beyond any reasonable valuation.
It is driven by speculation, emotion, and the belief that prices will continue rising indefinitely.
For traders, the challenge is more about finding a way to manage a bubble, rather than just identifying that one exists.
By their very nature, bubbles can persist far longer than any logical analysis suggests. There are opportunities as they develop, but timing their peak is virtually impossible.
Understanding their characteristics and having a systematic way of managing bubbles in your trading strategy is worth considering for any trader.
What is a Bubble?
Market bubbles have distinct features that separate them from normal bull markets or even overvalued conditions for a particular asset:
Dramatic Price Appreciation Disconnected From Fundamentals
In a bubble, traditional valuation metrics become meaningless.
Company or asset fundamentals that usually matter to market participants are ignored in the hope of what might be.
Cash flow, profit margins, competitive positioning, and (in some cases) producing revenue may be dismissed.
Widespread Participation And "This Time Is Different" Narratives
Bubbles require mass market participation.
When every headline you see or article you read references "this time is different," or "the old rules don't apply anymore," it is a sign that the collective psychology has shifted from normal caution.
Social media may begin to explode with ever more frequent success stories, and for the individual trader, the fear of missing out becomes increasingly overwhelming.
Credit and Leverage Fuelling Demand
Bubbles are typically accompanied by easier credit conditions.
When interest rates are lowered and investors are confident in general economic conditions, any spare cash is put to work.
In stock or other market bubbles, you may see retail traders maxing out credit cards to buy call options, with the put/call ratio becoming increasingly distorted.
This leverage often amplifies the rise and the eventual fall, making the risk even more acute and potentially damaging to trader capital.
Vertical Price Charts in Final Stages
One of the telltale signs of a bubble's final phase is a parabolic price chart.
Prices seem to go up daily, and every minor pullback is short-lived (creating more buying pressure).
This is the euphoria stage. It is where the greatest danger is.
The fear of missing out on further moves is at its highest, and a logical willingness to take profit off the table diminishes in the minds of ever more excited traders.
New participants may continue to enter solely for the way the price is appreciating. Entering into the move only understanding that what they are buying is going up, so they want to join in too.
Bubble vs. Overvalued: Key Differences
Not every expensive market is a bubble. Several characteristics distinguish a bubble from a simpler and far less dangerous overvaluation:
Elevated Valuations With Reasoned Fundamental Justification
An overvalued market has stretched valuations, but can point to real supporting factors (at least to some degree).
Examples include strong earnings growth, low interest rates, disruption in service or productivity, and providing genuine temporary value.
Even if prices respond to less obvious immediate influencing factors, such as international events, policy changes, and supply issues, the fact that some factors justify continued positive sentiment (even if somewhat unfulfilled) is a positive sign.
Linear or Steady Uptrend
Overvalued markets tend to grind higher with a more sustainable trend rather than a vertical spike. There are normal corrections along the way, even if the highs and lows of a fluctuation are higher.
Reasonable Participation Levels
There is evidence of institutional investors buying on any dips, but common retracements last days or even weeks.
Retail participation exists but isn't frenzied and plastered all over social media every day or referenced in mainstream media consistently.
Some Scepticism Still Exists
There will be some legitimate and contrary opinions about valuations. Major financial media will present both bearish and bullish cases when a stock is discussed.
Trading Strategies for Potential Bubble Management
Here is the scenario: You bought early in the up move, you are now in profit, but some of the bubble signs are beginning to show up in your thinking.
Tiered Profit-Taking Strategies
Don't try to pick the top. As an alternative approach, begin to scale out systematically with partial closes. This will alleviate the potential for FOMO creeping in.
You could stage this with set points, e.g. sell 30% when you've doubled, another 30% when you've tripled, 20% when conditions clearly show evidence of entering bubble territory and, having banked a substantial profit already, you keep the final 20% with a trailing stop for the final run if it happens.
Trailing Stops With Wider Bands to Accommodate Volatility
Let’s assume you see the merit in some form of trial stop. In bubble conditions, normal stop distances will get you whipsawed out. Use percentage-based trailing stops or ATR multiples with enough room to accommodate bigger intraday moves.
For example, if your norm is to trail your stop 1.5 x ATR behind price at the end of every candle, then in increasingly volatile conditions during a parabolic move, consider 2,5 x ATR to allow room to move while still offering protection against price collapse.
Reduce Position Sizing and Leverage
The temptation in bubbles is to maximise gains by increasing your margin and entering more and more positions in one asset.
High leverage and significant single asset exposure in bubble conditions is a potential death sentence to trading capital.
Recognising the added risks you are contemplating before entry is critical. Combining this with an approach that reduces position sizing and increases margin requirements is consistent with good trading practice as risk increases.
Planned and Rigid Exits
Before buying, you should have already made decisions on what exit approaches you should take and the parameters at which they will be executed,
Having the exit plan as you enter can limit the chance of getting trapped by greed. Neglecting this and focusing on the opportunity alone can be disastrous.
Never Assume You Can Time the Top
It is usually a big mistake if you believe you will recognise the exact top and exit perfectly. Let’s be frank, even if you hit it lucky once, you won't be able to every time — no one does.
Recognise Behavioural Biases That May Affect Your Judgment
Bubbles can create powerful psychological forces.
Anchoring bias may mean that you fixate on peak prices. Confirmation bias makes you seek information supporting your bullish view and ignore opposing evidence. Recency bias makes you believe the recent trend will continue indefinitely.
The indisputable key to any bias management is awareness and honesty that some markets may just not be for you (or if they are, to proceed with extreme and continuous caution).
Psychological Preparation for Rapid Reversals
Mentally rehearse the worst scenario and clarity of planned action, e.g., “if it drops 10% in three days, I will ….”.
Having thought through your response and armed with unambiguous exits in advance will make execution easier when emotions run high and begin to dominate.
Final Thoughts
Extreme valuations, little fundamental underpinning, parabolic price action, and universal bullishness should be part of your bubble identification checklist and flag that your bubble action plan should be implemented.
If you are already in, or tempted to be so, then approach bubbles with honesty, awareness of your trading self and extraordinary discipline to follow through, as predicting what and when things may dramatically turn is close to impossible.
Never forget you are not smarter than the market, but you can (potentially) be smarter than many traders by planning and doing the right thing.
Expected earnings date: Wednesday, 28 January 2026 (US, after market close) / early Thursday, 29 January 2026 (AEDT)
Key areas in focus
Advertising (Family of Apps)
Advertising remains Meta’s dominant revenue driver. AI-driven ad targeting, Reels monetisation, and engagement efficiency can be important contributors to revenue growth and may support advertiser outcomes, noting results can vary by advertiser, format, and market conditions.
User engagement and monetisation
Engagement trends across Facebook, Instagram, WhatsApp, and Threads remain closely watched as indicators that can influence monetisation assumptions and medium-term expectations.
Artificial intelligence
Meta views AI as a foundation for content discovery, advertising performance, and the development of generative tools. Markets may continue to evaluate whether AI-driven gains offset the level of infrastructure and data centre investment required to support these projects.
Reality Labs
Reality Labs remains loss-making. Management continues to frame AR/VR and metaverse-related platforms as long-term strategic investments, while acknowledging continued operating losses and a drag on earnings performance.
The company’s reported (GAAP) net income and EPS reflected a one-time, non-cash income tax charge disclosed in the earnings materials, while management commentary also emphasised cost discipline and investment priorities.
Reality Labs operating loss: about US$4.43 billion
How the market reacted last time
Meta shares fell in after-hours trading after the release. Commentary at the time highlighted strong top-line outcomes, alongside investor focus on the outlook for spending and the pace of AI and infrastructure investment.
What’s expected this quarter
Bloomberg consensus points to continued year-on-year revenue growth, led by advertising, with operating margins expected to remain elevated despite ongoing AI and infrastructure expenditure.
Capital expenditure (capex): elevated, reflecting AI and data centre investment
*All above points observed as of 23 January 2026.
Expectations
Sentiment around Meta Platforms may be sensitive to any disappointment around advertising demand, margin sustainability, or the scale of ongoing investment in AI and Reality Labs.
Recent price action suggests that some market participants appear to be pricing in a relatively constructive earnings outcome, which can increase sensitivity to negative surprises.
Listed options were pricing an indicative move of around ±3% based on near-dated options expiring after 28 January and an at-the-money options-implied ‘expected move’ estimate.
Implied volatility was about 31% annualised into the event, as observed on Barchart at 11:00 am AEDT on 23 January 2026.
These are market-implied estimates and may change. Actual post-earnings moves can be larger or smaller.
What this means for Australian traders
Meta’s earnings may influence near-term sentiment across US technology indices, particularly the Nasdaq, with potential spillover into broader global equity risk appetite and index-linked products traded during the Asia session after the release, which can be volatile and unpredictable following earnings events.
Important risk note
Immediately after the US close and into the early Asia session, Nasdaq 100 (NDX) futures and related CFD pricing can reflect thinner liquidity, wider spreads, and sharper repricing around new information.
Such an environment can increase gap risk and execution uncertainty relative to regular-hours conditions.
Australian CPI may test market pricing for a February RBA move, while the Federal Reserve narrative will be followed closely, even though a pause is widely expected. It is also a busy US earnings week, with mega-cap names headlining, and Gold remains a key market focus.
Australia CPI: Australian CPI is the key domestic release, with markets pricing the risk of a February RBA rate increase.
US Federal Reserve: The Fed is widely expected to hold rates steady, with attention on whether a potential June rate cut remains intact.
US mega-cap tech earnings: Earnings from large-cap technology names may test whether current equity valuations remain supported.
Gold: Gold continues to trade near record highs.
Australia
Australia CPI (Q4): Wednesday, 28 January
Stronger-than-expected jobs report this week lifted market expectations for further policy tightening.
According to the ASX RBA Rate Tracker, market-implied pricing for a February rate increase has risen to above 60%.
Market impact
AUD crosses may respond to any shift in rate expectations
Rate-sensitive equity sectors could see follow-through moves
Federal Reserve
FOMC rate decision: Wednesday, 28 January (US) | 29 January (AEDT)
The Federal Reserve is widely expected to announce no change in rates after its two-day meeting.
Market focus will centre on communication around inflation progress, and whether market-implied pricing for a potential June rate cut is reinforced or challenged.
Market impact
USD direction may respond to any shift in policy tone across multiple asset classes
US Treasury yields, especially at the front end, may react to changes in rate expectations
US mega-cap earnings
Boeing: 27 January (US time) | 28 January AEDT
Microsoft: 28 January (US time, after market close) | 29 January AEDT
Meta Platforms: 28 January (US time, after market close) | 29 January AEDT
Tesla: 28 January (US time, after market close) | 29 January AEDT
Caterpillar: 29 January (US time, before market open)/30 January AEDT
Apple: 29 January (US time, after market close) | 30 January AEDT
Earnings from US mega-cap technology companies are likely to dominate headlines, but next week is also one of the busiest periods so far this earnings season across multiple sectors.
Markets are likely to focus on guidance, margins and capital expenditure as much as the headline results.
Market impact
Nasdaq leadership breadth may respond to guidance consistency
With equity markets remaining generally strong, current valuations will again be tested
Overall performance across sectors will be viewed as a lens into the state of the econ
(Note: Dates may be subject to change)
Gold
At the US close on 22 January 2026, COMEX gold futures traded around US$4,920/oz, with the psychologically important 5,000 level in view.
Sensitivity to Treasury yields and the USD, policy uncertainty, and geopolitical developments may influence price action either way.
Market impact
Gold prices can remain sensitive to changes in Treasury yields, USD movements and geopolitical developments.
Movements around record levels can be volatile and unpredictable, and may reverse quickly.
FX markets face a data-heavy period in the coming days, led by US inflation releases and late-week flash purchasing managers’ indexes (PMIs).
Regional data and central bank expectations in Japan, Europe, and Australia may influence cross-currency moves, particularly if outcomes differ from expectations.
Quick facts:
US Personal Income and Outlays is a key inflation release this week, closely watched by policymakers.
Flash PMIs across the US, Eurozone, Germany, and the UK offer a timely read on growth momentum.
Australian data, including labour market indicators, remains important for AUD sensitivity and Reserve Bank of Australia (RBA) expectations.
FX markets can be sensitive when data outcomes differ from expectations.
USDJPY
What to watch
US attention centres on inflation and activity data, particularly the Personal Income and Outlays report and the PCE price index, alongside late-week flash manufacturing and services PMIs.
These releases are closely followed by markets for their potential influence on rate expectations and USD sensitivity.
On the JPY side, Bank of Japan (BoJ) developments remain relevant, although US data has often been a key driver of recent moves.
Key releases and events
Fri 23 Jan (US): US Personal Income and Outlays (including PCE inflation)
Fri 23 Jan (US): Manufacturing and services PMI
Technical snapshot
USDJPY continues to trade above its rising 200-day moving average, with recent daily candles showing greater overlap and smaller ranges over recent weeks.
Price has remained above the long-term average since late September, with higher swing lows still visible.
Momentum appears to have moderated since early January, consistent with slowing follow-through rather than reversal.
Daily ranges have narrowed compared with the October to November advance, again suggesting short-term consolidation.
Eurozone flash PMIs and Germany producer price index (PPI) data provide insights into regional growth momentum and whether inflation pressures are building.
While these releases may influence immediate EUR sentiment, EURUSD continues to trade in the broader context of US data outcomes and global risk conditions.
EURUSD is trading above its rising 200-day moving average (daily chart), although price action since July suggests the market has become more range-bound rather than directional, following the advances in the first half of 2025.
The broader upward structure has been in place since the beginning of 2025, although progress higher has stalled over recent months.
Momentum readings have drifted toward neutral since late November, consistent with balanced conditions.
Average daily range has continued to compress since July, consistent with a flattening of the trend.
Australian labour market data remains central for AUD sensitivity and RBA expectations. UK CPI is also due this week, which may contribute to cross volatility, particularly if it shifts expectations around the UK rates outlook.
Late-week PMI releases can also influence short-term direction, especially where they add to or challenge the current growth narrative.
Key releases and events
Wed 21 Jan: UK CPI
Thu 22 Jan: Australia Labour Force, Australia (December 2025)
Fri 23 Jan: UK flash PMIs (manufacturing and services)
Technical snapshot
GBPAUD continues to trade below its long-term moving average, with price action remaining in a downside direction since late November.
The long-term average flattened through September and has turned lower since October, with the price remaining below and showing recent signs of a greater gap between the price and the moving average.
Momentum has remained below neutral over recent months, with any retracements to the upside showing limited follow-through.
Daily ranges have narrowed compared with earlier swings, suggesting a consistent but controlled drop in price rather than impulsive movement.
With multiple data releases due across key regions, FX markets may remain sensitive to outcomes that differ from expectations.
Existing technical conditions suggest that reactions may vary by pair, with some markets consolidating while others could retain recent directional characteristics.