Growth pulse, AI disruption, and fragile equity rotation in focus | GO Markets week ahead
Mike Smith
13/2/2026
•
0 min read
Share this post
Copy URL
Markets head into the week beginning 16 February with a heavy mix of economic data and ongoing earnings momentum, which will feed into the broader growth picture.
Flash PMIs (Friday): US, Eurozone, UK and Japan business surveys provide an early read on February growth momentum.
AI beyond tech: Commentary has increasingly focused on how AI could affect business models across industries, although sector moves can reflect multiple drivers.
Equity rotation: Recent tech performance has been mixed, and broader participation looks less consistent than a confirmed rotation.
Earnings: With most US mega caps reported, retail and consumer names are in focus this week, and the Australian reporting season remains busy.
Bitcoin (BTC): Pulled back after an attempted rebound and remains highly sensitive to shifts in sentiment.
Flash PMIs
Friday’s flash PMI readings across major economies could provide a timely read on business conditions and demand trends.
If services remain resilient while manufacturing stays soft, markets may interpret this as steady but uneven growth. If both weaken, growth concerns could return more quickly.
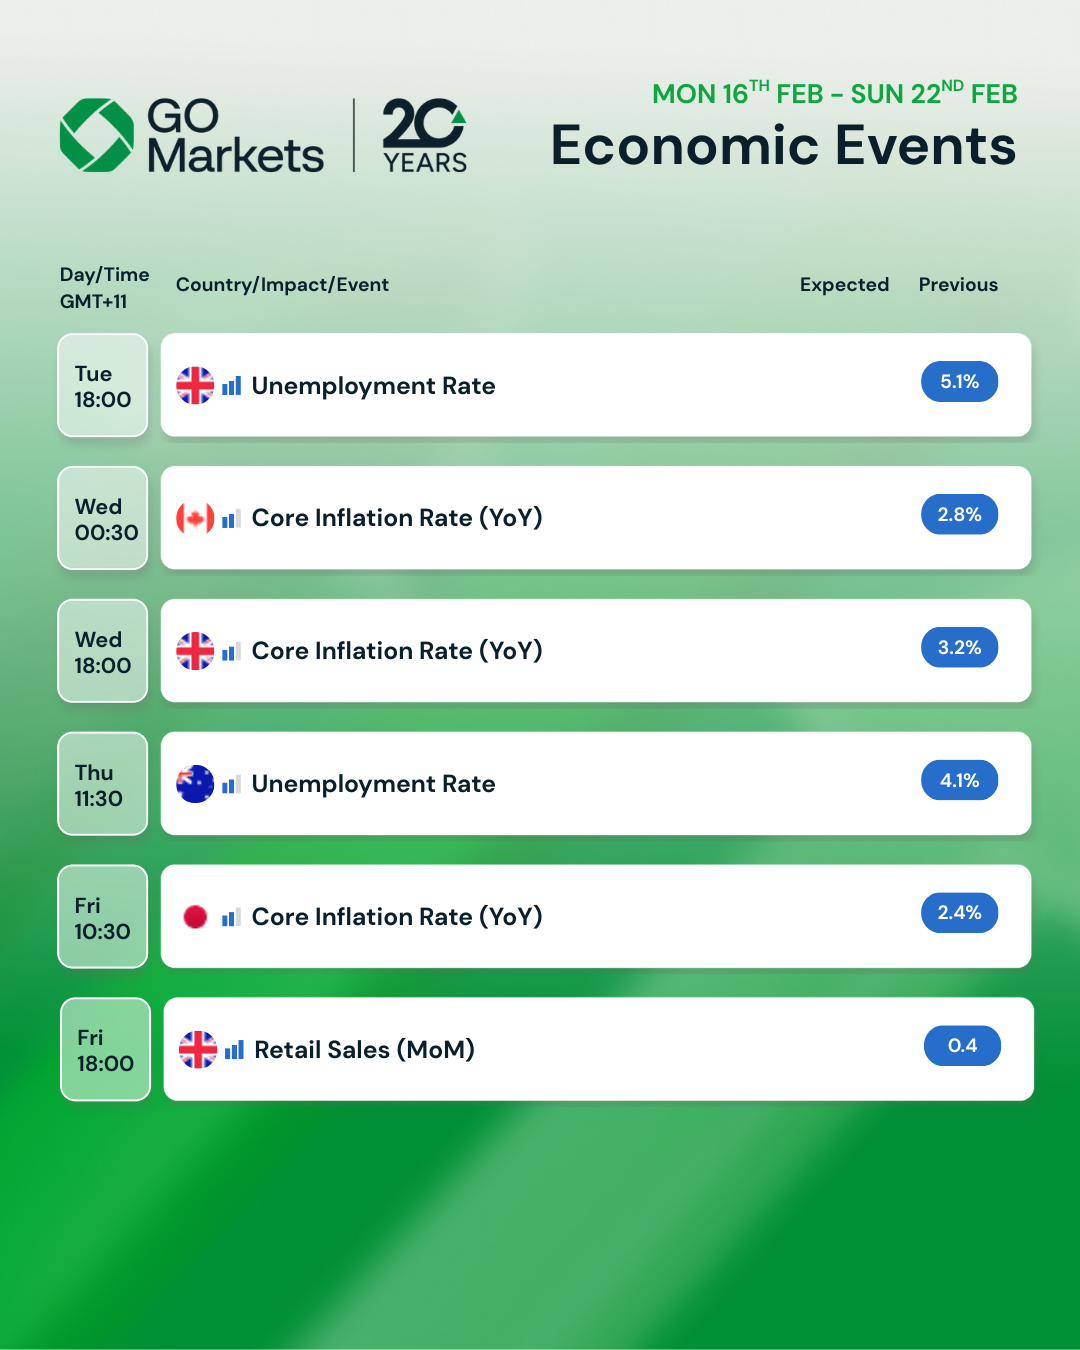
Earlier in the week, Japan GDP, UK labour data, UK CPI, Australian employment, and US trade data helped set the tone before Friday’s flash PMI releases from multiple countries.
Key dates
Flash PMIs (US, Eurozone and UK): Friday, 20 February
Monitor
Currency volatility around PMI releases.
Bond yield reactions to growth surprises or disappointment.
Sector and commodity performance shifts that may be tied to changing demand expectations.
AI disruption
Some market commentary has highlighted potential longer-term competitive implications of AI across a range of industries, although company and sector performance can still be driven by macro conditions, rates and earnings expectations.
Financials: Some discussion has focused on whether AI tools could alter parts of wealth management and advice delivery over time, though share-price moves can reflect multiple influences.
Logistics and freight: Some market discussion has centred on whether greater automation could affect costs and pricing dynamics over time, alongside other cyclical drivers.
Software: Reactions remain mixed, with some companies benefiting from AI integration while others face questions about differentiation and pricing power.
This shift means the AI theme could increasingly express itself through relative performance and dispersion, rather than a broad “risk-on” bid.
Monitor
Earnings guidance that references automation, AI investment, or AI-related competitive pressure.
Increased dispersion between sectors and within sectors.
Larger reactions to forward-looking commentary rather than headline beats or misses.
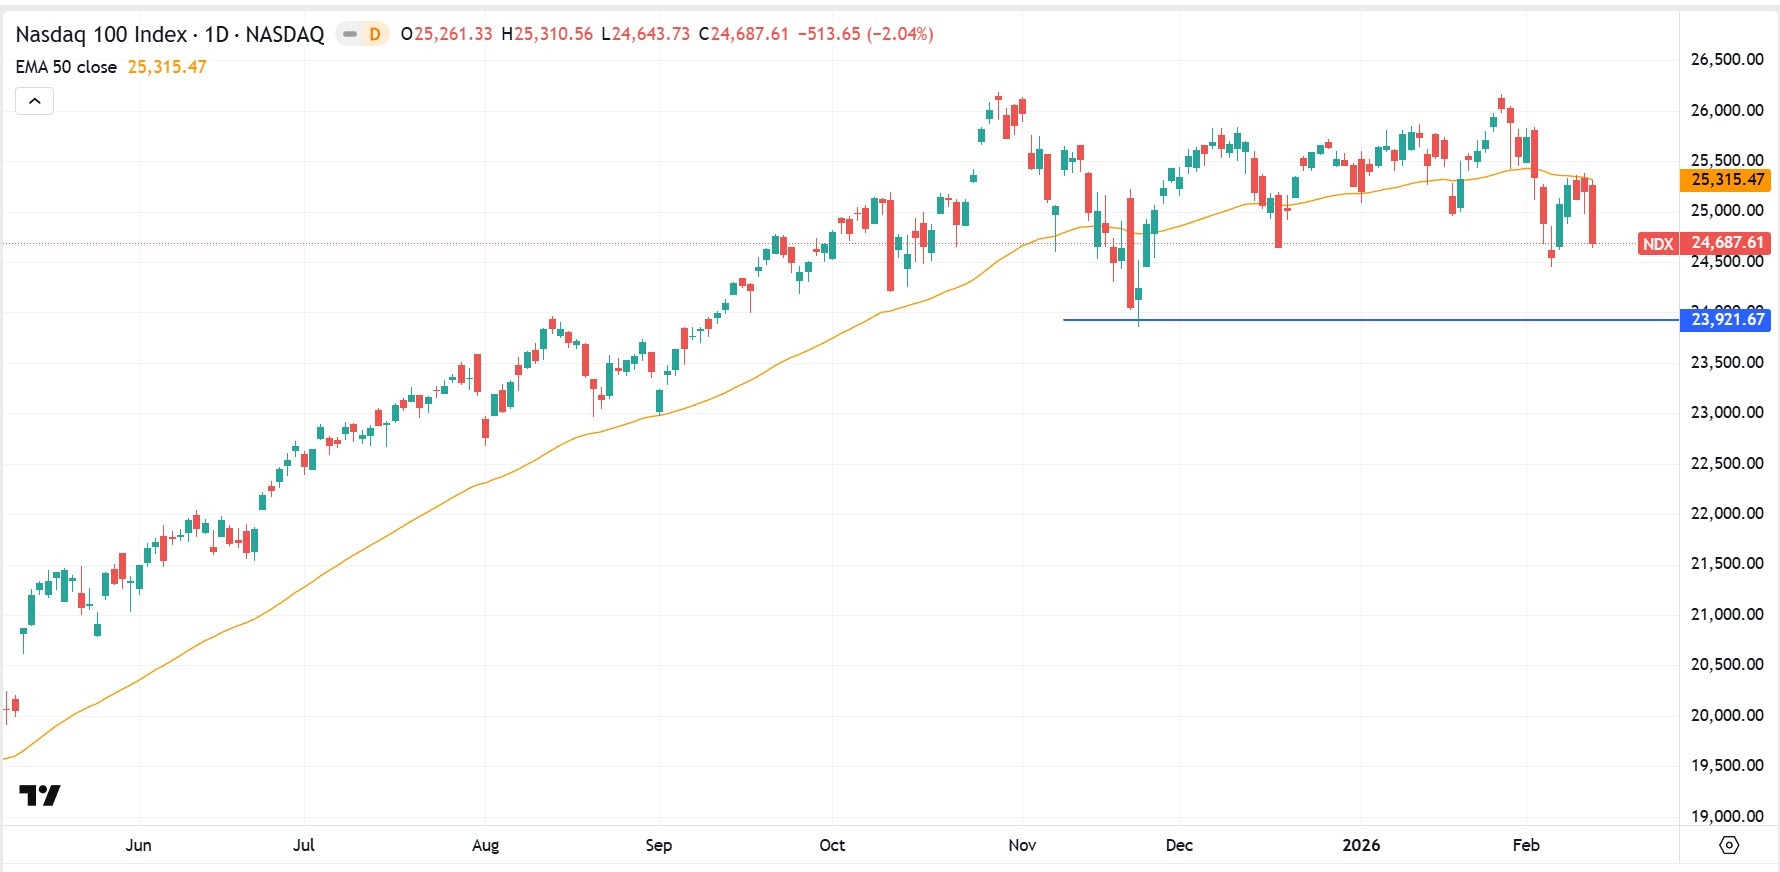
Equity rotation
The rebound in technology shares seen earlier last week has lost momentum. Rather than clear risk-off conditions, the market is showing mixed participation.
Financials, industrials and defensive sectors have attracted flows at times, but not consistently enough to confirm a durable rotation.
Participation remains uneven, and evidence of a more consistent pattern of money flow is still limited at this stage.
Monitor
Sustained relative strength in non-tech sectors.
Yield movements and their influence on growth-sensitive equities
Broader sector participation versus narrow tech leadership
NASDAQ 1-day chart | TradingView
Earnings focus
As the US earnings season moves towards its backend, attention turns toward retail names this week.
Retail results can provide signals about consumer strength, discretionary spending trends and margin resilience, particularly amid mixed perceptions about the state of the economy.
In Australia, reporting season continues, supporting stock-specific volatility across the ASX.
Monitor
Retail margin commentary and discounting trends
Consumer demand outlook statements and guidance tone
Large single-stock moves even when index direction is muted
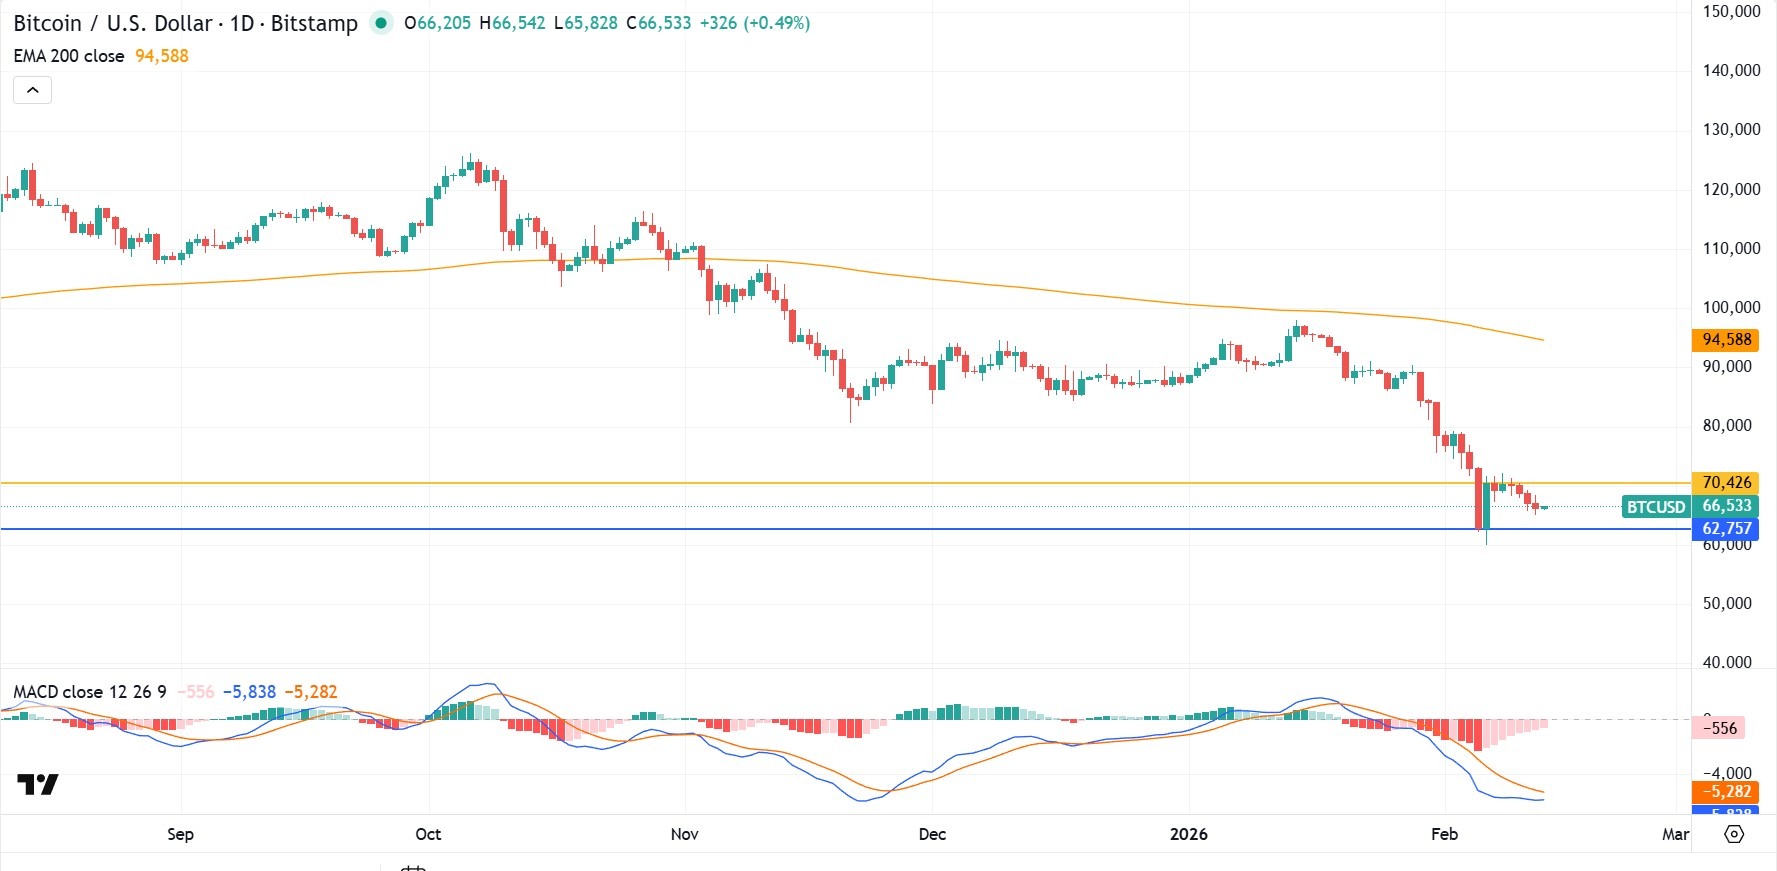
Bitcoin sentiment-sensitive
Bitcoin has traded lower over recent sessions and remains highly volatile. A move back toward the 5 February low is possible, but prices can change quickly in either direction.
Some market participants view Bitcoin as one indicator of speculative sentiment, although any broader “risk appetite” read-through is uncertain and can be influenced by multiple drivers across crypto markets.
BTC 1-day chart | TradingView
Key economic events
Economic events | GO Markets
By
Mike Smith
Mike Smith (MSc, PGdipEd)
Client Education and Training
The information provided is of general nature only and does not take into account your personal objectives, financial situations or needs. Before acting on any information provided, you should consider whether the information is suitable for you and your personal circumstances and if necessary, seek appropriate professional advice. All opinions, conclusions, forecasts or recommendations are reasonably held at the time of compilation but are subject to change without notice. Past performance is not an indication of future performance. Go Markets Pty Ltd, ABN 85 081 864 039, AFSL 254963 is a CFD issuer, and trading carries significant risks and is not suitable for everyone. You do not own or have any interest in the rights to the underlying assets. You should consider the appropriateness by reviewing our TMD, FSG, PDS and other CFD legal documents to ensure you understand the risks before you invest in CFDs. These documents are available here.
Latin America (LATAM) saw over $730 billion in crypto volume in 2025, a 60% year-on-year surge that made the region responsible for roughly 10% of global crypto activity.
In 2026, institutional players are starting to take the region seriously, regulation is crystallising, and the structural drivers from 2025 show no sign of fading. But the region is not a single story, and 2026 will test whether the current momentum is built on solid fundamentals or speculative optimism.
Quick facts
LATAM monthly active crypto users grew 18% year-on-year (YoY), three times faster than the US.
Argentina reached 12% monthly active user penetration, accounting for over a quarter of the region's crypto activity.
Over 90% of Brazilian crypto flows are now stablecoin-related.
Three LATAM countries rank in the global top 20: Brazil (5th), Venezuela (18th), Argentina (20th).
Peru's crypto app downloads grew 50% in 2025, with 2.9 million downloads.
From survival tool to financial infrastructure
Latin America did not embrace cryptocurrency because of speculation. It embraced it because traditional financial systems repeatedly failed ordinary people. Over the past 15 years, average annual inflation across the region's five largest economies ran at 13%, compared to just 2.3% in the US over the same period.
In Venezuela, it reached 65,000% in a single year. In Argentina, it exceeded 220% in 2024. For millions of people, holding savings in local currency was a slow act of self-destruction. Stablecoins became the natural response. Digital assets pegged to the US dollar offered a reliable store of value, borderless transferability, and access without a bank account.
Unlike in the West, where crypto is seen more as a speculative instrument, in LATAM it has become a necessary financial tool. However, adoption drivers are not entirely uniform across the region. Brazil and Mexico are institutional stories, driven by regulated market participation and established financial players.
Argentina and Venezuela remain store-of-value plays, with crypto serving as a direct hedge against fiat collapse. And Peru and Colombia are more yield-seeking markets, where crypto offers returns that traditional savings accounts cannot match.
How fast is LATAM adopting crypto?
LATAM’s on-chain crypto volume rose 60% year-on-year in 2025. The region has recorded nearly $1.5 trillion in cumulative volume since mid-2022, peaking at a record $87.7 billion in a single month in December 2024.
Monthly active crypto users across LATAM also grew 18% in 2025, three times faster than the US.
Stablecoins are the primary vehicle driving this adoption. Of the $730 billion received in 2025, $324 billion moved through stablecoin transactions, an 89% year-on-year surge. In Brazil, over 90% of all crypto flows are stablecoin-related, and in Argentina, stablecoins account for over 60% of activity.
Looking ahead, the Latin America cryptocurrency market is forecast to reach $442.6 billion by 2033, growing at a compound annual rate of 10.93% from 2025, according to IMARC Group.
For traders, the speed of adoption matters less as a headline than what is driving it: a region of 650 million people building parallel financial infrastructure in real time, with stablecoins as the foundation.
LATAM Crypto — By The Numbers
LATAM crypto by the numbers
Total on-chain volume
$730B
Total on-chain crypto volume received across LATAM in 2025 (~10% of global total)
+60% year-on-year
Stablecoin transaction volume
$324B
LATAM stablecoin transaction volume in 2025, reflecting surging demand for dollar-pegged assets
+89% year-on-year
Brazil's share of LATAM volume
~33%
Of all LATAM on-chain volume received by Brazil in 2025, making it the region's dominant crypto market
~250% annual growth
Annual remittance market
$142B
Annual remittance flows across Latin America, with an increasingly large share now settled in stablecoins
Stablecoin-settled
The institutional turn
For most of LATAM’s crypto history, adoption was bottom-up. Unbanked or underbanked retail users drove volumes through local exchanges. That picture is now changing at the top end of the market.
In February 2026, Crypto Finance Group, part of the leading global exchange operator Deutsche Börse Group, announced its expansion into Latin America, targeting banks, asset managers, and financial intermediaries seeking institutional-grade custody and trading infrastructure.
Traditional banks and fintechs are following suit. Nubank now rewards customers for holding USDC. Brazil's B3 exchange approved the world's first spot XRP and SOL ETFs, ahead of the US, in 2025. Centralised exchanges, including Mercado Bitcoin, NovaDAX, and Binance, have collectively listed over 200 new BRL-denominated trading pairs since early 2024.
In March 2025, Brazilian fintech Meliuz became the first publicly traded company in the country to launch a Bitcoin accumulation strategy, now holding 320 BTC.
“Crypto adoption in LatAm is already global-scale. What the market needs now is institutional-grade governance, and that’s exactly why we’re here,” — Stijn Vander Straeten, CEO of Crypto Finance Group
Crypto remittance use case
Latin America receives hundreds of billions of dollars annually from workers abroad, making remittances one of the most concrete and measurable crypto use cases in the region. Traditional transfer services charge an average of 6.2% per transaction. On a US$300 transfer, that is roughly US$20 in fees.
Blockchain-based infrastructure more broadly offers dramatic fee reductions. Bitcoin brings costs to around US$3.12 per US$100 transferred. While cheaper alternatives like XRP or Ethereum layer-2 infrastructure can reduce that to less than US$0.01.
For a migrant worker sending US$1,500 home to Peru, switching from a legacy bank saves more than the average Peruvian weekly wage in fees alone.
LATAM’s crypto regulatory environment
The variable that will most determine whether LATAM lives up to its 2026 potential is crypto regulation. And here, the picture is genuinely mixed.
Brazil leads the region with its Virtual Assets Law, which covers asset segregation, VASP licensing, AML/KYC requirements, and capital standards. It also implemented the Travel Rule for domestic VASP transfers, which came into force in February 2026. However, some more controversial proposals, including a US$100,000 cap on cross-border stablecoin transactions and a ban on self-custody wallet transfers, remain under active consultation.
Mexico's 2018 Fintech Law remains one of the world's earliest formal recognitions of virtual assets. Chile's 2023 Fintech Law established licences for exchanges, wallets, and stablecoin issuers, formally recognising digital assets as 'digital money.'
Bolivia reversed a decade-long crypto ban in June 2024 by authorising regulated digital asset transactions. Argentina introduced mandatory exchange registration in 2025. And El Salvador continues to expand tokenised economic initiatives despite removing Bitcoin's legal tender status.
Ten countries across the region now have formal crypto frameworks of some kind. But for traders, regulatory divergence remains a live risk, and given Brazil receiving nearly one-third of all LATAM crypto volume, any significant policy reversal there could have outsized consequences.
Brazil's institutional momentum is the most significant structural trend. With $318.8 billion in on-chain volume in 2025, Brazil effectively is the LATAM market.
The outcome of the Brazil stablecoin consultation could have a big influence. A restriction on foreign stablecoins in domestic payments would directly impact the most traded asset class in the region's dominant market.
Argentina is the volatility play. Monthly active user penetration of 12% and 5.4 million crypto app downloads in 2025 signal deep and growing retail engagement.
Colombia is an early-warning market to watch. The peso's 5.3% depreciation in 2025 and deepening fiscal crisis are driving stablecoin inflows in a pattern that mirrors Argentina's trajectory in earlier years. If Colombia's macro situation deteriorates further, crypto adoption could accelerate.
There is also an exchange concentration risk at play. Binance crypto exchange is the primary exchange for over 50% of LATAM crypto users. If the exchange faces any regulatory action, operational disruption, or competitive shock, it could have an outsized market impact.
Bottom line
Latin America's crypto market has entered a new phase. The structural drivers that caused initial crypto-demand in the region have not gone away: inflation, remittances, financial exclusion, and currency instability are all still at play.
What has changed is the layer being built on top of them. Institutional infrastructure, regulatory frameworks, corporate treasury adoption, and global exchange capital flowing into a region that was, until recently, largely self-contained.
Brazil's near-250% volume growth in 2025 and its position receiving nearly one-third of all LATAM crypto are the defining market developments. Its regulatory trajectory, stablecoin policy decisions, and ETF pipeline will effectively set the tone for the region in 2026.
For traders, the headline growth figures are real, but so are the concentration risks, regulatory uncertainties, and country-level divergences that sit beneath them.
On February 28, 2026, as the joint US and Israeli attack began, the numbers on the screens started moving in ways that felt clinical, even as the reality on the ground with the tragic deaths of civilian casualties in Iran, felt anything but. Markets, as they say, do not have a moral compass, rather they have a weighing machine and right now, they are weighing the transition of the entire global economy from a "just-in-time" model to a "just-in-case" cycle.
What markets were signalling
On March 2, the index tape stayed cautious while defence rose. Historically, conflicts can speed up restocking and orders but how big it gets (and how fast) still depends on budgets, approvals and delivery bottlenecks.
The Winners
1. Hanwha Aerospace (012450.KS)
Hanwha is one of the more actively traded names linked to the “K-Defence” theme, a company markets increasingly view as a scalable supplier into a tightening global artillery and munitions cycle. Capacity and delivery credibility.
When replenishment becomes urgent, the ability to produce at scale often matters as much as the platform itself. Export demand tied to systems like the K9 Thunder and Chunmoo has reinforced the narrative of durable order flow even when outcomes still hinge on budgets, approvals and delivery timelines.
Key things that can move sentiment: order-book updates, production cadence, and any follow-on export announcements.
2. Northrop Grumman (NOC)
Northrop moved into focus as investors repriced exposure to strategic modernisation and large, long-running programs. Defence markets often seen as mission-critical can persist across cycles. It’s less about one quarter and more about whether momentum stays steady if modernisation priorities remain in place (and whether timelines shift if they don’t).
Key variables that can move sentiment: Procurement pace, contract timing, and program-related funding language.
3. RTX Corporation (RTX)
RTX returned to the centre of the tape as investors priced an interceptor replenishment cycle and the economics of high-tempo air defence. Attrition is expensive and when usage rates rise, governments typically have to replenish inventories and, in many cases, fund production expansion which can extend backlog and lift revenue visibility.
Key variables that can move sentiment: Replenishment orders, manufacturing expansion indicators, and delivery throughput.
4. Lockheed Martin (LMT)
Lockheed drew attention as markets focused on missile-defence demand and the question every procurement desk faces in a high-tempo environment: how fast can inventories be rebuilt? If utilisation stays elevated, the winners tend to be the contractors best positioned to scale production and deliver reliably. Lockheed’s missile defence exposure keeps it closely tied to that replenishment narrative.
Key variables that can move sentiment: production ramp signals, unit economics, and budget-driven order cadence.
5. BAE Systems (BA.L)
With an £83.6 billion backlog and a central role in the AUKUS submarine program, BAE moved into focus as parts of Europe signalled higher defence spending ambitions. The stock rose 6.11% to a 52-week high amid a “risk-off” rotation, with traders watching AUKUS milestones and European air and missile defence procurement, including “Sky Shield”.
Key variables that can move sentiment: A potential catalyst is any clear step-up in German spending that lifts order flow across BAE’s European units, while key risks include a sharp spike in UK gilt yields, renewed pound sterling volatility, or “threat of peace” profit-taking.
800
The Losers: not every ‘war stock’ rises
6. AeroVironment (AVAV)
AeroVironment surged 18% at the open before falling 17% intraday after reports that the US Space Force was reopening a US$1.4 billion contract. The move highlights how procurement processes and contract risk can drive volatility, even in supportive thematic environments.
7. Kratos Defence (KTOS)
Kratos sits in the drone and loitering munition theme that gained attention as the Middle East conflict intensified. The stock still sold off after earnings, highlighting a common defence-sector risk. Kratos announced a large follow-on equity offering in the US$1.2 billion to US$1.4 billion range, the move strengthens the balance sheet and can support future program investment.
For traders focused on short-term “conflict premium” narratives, dilution can quickly change the setup. Even when demand conditions appear supportive, the market may reprice the stock if each shareholder ultimately owns a smaller portion of the business.
8. Intuitive Machines (LUNR)
Some speculative space-tech names lagged as investors appeared to favour companies with more established defence-linked revenue.
9. Boeing (BA)
Boeing was down around 2.5% on the session. While its defence division is meaningful, its commercial business can be more sensitive to aviation demand, airspace disruptions and oil-price moves.
10. Spirit AeroSystems (SPR)
Spirit AeroSystems remains closely tied to the global aircraft production cycle as a major aerostructures supplier.Recent results showed widening losses despite higher sales, reflecting ongoing production cost increases on major aircraft programs. These pressures have weighed on investor confidence in the near-term outlook. The planned acquisition by Boeing may ultimately reshape the company’s position in the supply chain, but execution risk and production stability remain central to how the market prices the stock.
What to watch next
Escalation vs de-escalation: A shift toward diplomacy or ceasefire discussions can quickly change sentiment around defence stocks.
Oil and shipping: Energy spikes can tighten financial conditions and pressure cyclical sectors.
Budgets and awards: Price moves can sometimes precede contract decisions, with clarity arriving when awards are finalised.
Production capacity: Companies with proven production and delivery track records often attract the most investor attention.
Supply chain constraints: Rare earths, propulsion and electronics remain potential bottlenecks that can limit how quickly production scales.
The longer term lens
The 2026 Iran conflict is first and foremost a human tragedy. For markets, it may also represent a shift in how national security spending is prioritised within fiscal frameworks. If defence spending remains elevated over a multi year horizon, companies with scalable manufacturing capacity and integrated technology stacks could attract sustained investor attention. That said, markets move in cycles. Structural themes can persist, but they can also reprice quickly when assumptions change. Staying analytical and risk aware remains critical.
References to specific companies, sectors or market movements are provided for general market commentary only and do not constitute a recommendation, offer or solicitation to buy or sell any financial product.Market reactions to geopolitical or macroeconomic events can be volatile and unpredictable, and outcomes may differ materially from expectations.
Volatility doesn't discriminate. But it can punish the unprepared.
Stops getting hit on moves that reverse within minutes. Premiums on short-dated options climbing. And the yen no longer behaving as the reliable hedge it once was.
For traders across Asia, navigating this environment means asking harder questions about risk, timing, and the assumptions baked into strategies built for calmer markets.
1. How do I trade VIX CFDs during a geopolitical shock?
The CBOE Volatility Index (VIX) measures the market’s expectation of 30-day implied volatility on the S&P 500. It is often called the “fear gauge.” During geopolitical shocks such as the current Iran escalations, sanctions announcements, and surprise central bank actions, the VIX can spike sharply and quickly.
What makes VIX CFDs different in a shock
VIX itself is not directly tradeable. VIX CFDs are typically priced off VIX futures, which means they carry contango drag in normal conditions.
During a geopolitical shock, several things can happen at once
Spot VIX may spike immediately while near-term futures lag, creating a disconnect.
Spreads on VIX CFDs can widen significantly as liquidity thins.
Margin requirements may change intraday as broker risk models adjust.
VIX tends to mean-revert after spikes, so timing and duration are critical.
What this means for Asian-hours traders
Asian market hours mean many geopolitical events can break while local traders are active or just starting their session.
A shock that hits during Tokyo hours may already be priced into VIX futures before Sydney opens.
Some traders use VIX CFD positions as a short-term hedge against equity portfolios rather than a directional trade. Others trade the reversion (the move back toward historical averages once the initial spike fades). Both approaches carry distinct risks, and neither guarantees a specific outcome.
Volatility Index (VIX) during the 1 March Iran conflict escalation | TradingView
2. Why are my 0DTE options premiums so expensive right now?
Zero days-to-expiry (0DTE) options expire on the same day they are traded. They have become one of the fastest-growing segments of the options market, now representing more than 57% of daily S&P 500 options volume according to Cboe global markets data.
For Asian-based participants accessing US options markets, elevated premiums during volatile periods can feel like mispricing, but usually reflects structural pricing factors.
Why premiums spike
Options pricing is driven by intrinsic value and time value. For 0DTE options, there is almost no time value left, which might suggest they should be cheap but the implied volatility component compensates for that.
When uncertainty increases, sellers may demand greater compensation for the risk of sharp intraday moves.
This can be reflected in
Higher implied volatility inputs.
Wider bid-ask spreads.
Faster adjustments in delta and gamma hedging.
In higher-VIX environments, hedging flows can contribute to short-term feedback loops in the underlying index. This can amplify price swings, particularly around key levels.
What this means for Asian-hours traders
Many 0DTE options contracts see their most active pricing and hedging flows during US trading hours. Entering positions during the Asian session may mean facing stale pricing or wider spreads.
If you are seeing expensive premiums, it may reflect the market accurately pricing the risk of a large same-day move. Whether that premium is worth paying depends on your view of the likely intraday range and your risk tolerance, not on the absolute dollar figure alone.
3. How do I adjust my algorithmic trading bot for a high-VIX environment?
Many algorithmic trading systems are built on parameters calibrated during lower-volatility regimes. When VIX spikes, those parameters can become outdated quickly.
The regime mismatch problem
Most trading algorithms use historical data to set position sizes, stop distances, and entry thresholds. That data reflects the conditions during which the system was tested. If VIX moves from 15 to 35, the statistical assumptions underpinning those settings may no longer hold.
Common failure modes in high-VIX environments include
Stops triggered repeatedly by noise before the intended directional move occurs.
Position sizing based on fixed-dollar risk, which becomes relatively small compared to actual intraday ranges.
Correlation assumptions between assets breaking down.
Slippage on execution that erodes edge.
Approaches some algorithmic traders consider
Rather than running a single fixed set of parameters, some systems incorporate a volatility regime filter. This is a real-time check on VIX or ATR that triggers a switch to different settings when conditions shift.
Approach adjustments that some traders review in high-VIX environments
Widen stop distances proportionally to ATR to reduce noise-driven exits.
Reduce position size to maintain constant dollar risk relative to wider expected ranges.
Add a VIX threshold above which the system pauses or moves to paper trading mode.
Reduce the number of simultaneous positions, as correlations tend to rise during market stress.
No adjustment eliminates risk. Backtesting new parameters on historical high-VIX periods can provide some indication of likely performance, though past conditions are not a reliable guide to future outcomes.
4. Is the Japanese Yen (JPY) still a reliable safe-haven trade?
During periods of global risk aversion, capital has historically flowed into JPY as investors unwind carry trades and seek lower-volatility holdings. However, the reliability of this dynamic has become more conditional.
Why has the yen historically moved as a safe haven?
Japan’s historically low interest rates made JPY the funding currency of choice for carry trades and when risk-off sentiment hits, those trades unwind quickly, creating demand for yen.
Additionally, Japan’s large net foreign asset position means Japanese investors tend to repatriate capital during crises, further supporting JPY.
What has changed
The Bank of Japan’s shift away from ultra-loose monetary policy in recent years has complicated the traditional safe-haven dynamic.
As Japanese interest rates rise:
The scale of carry trade positioning may change.
USD/JPY can become more sensitive to interest rate spreads.
BoJ communication and domestic inflation data may influence JPY independently of global risk appetite.
The yen can still behave as a safe haven, particularly during sharp equity sell-offs. But it may respond more slowly or inconsistently compared to earlier cycles when the policy divergence between Japan and the rest of the world was more extreme.
What to watch
For traders monitoring JPY as a safe-haven signal, BoJ meeting dates, Japanese CPI releases, and real-time US-Japan rate spread data have become more relevant inputs than they were a few years ago.
Japan rates rose into the positive in 2024 after years at -0.1% | Trading Economics
5. How do I avoid ‘whipsawing’ on energy CFDs?
Whipsawing describes the experience of entering a trade in one direction, getting stopped out as the price reverses, then watching the price move back in the original direction.
Energy CFDs, particularly crude oil, are especially prone to this in volatile markets. And for traders in Asia, the combination of thin liquidity during local hours and sensitivity to geopolitical headlines can make this particularly challenging.
Why energy CFDs whipsaw
Crude oil is sensitive to a wide range of headline drivers: OPEC+ production decisions, US inventory data, geopolitical supply disruptions, and currency moves.
In high-volatility environments, the market can react strongly to each headline before reversing when the next one arrives.
Price spikes on a headline, stops are triggered on short positions.
Traders re-enter long, expecting continuation.
A second headline or profit-taking reverses the move.
Long stops are hit. The cycle repeats.
Approaches traders may consider to manage whipsaw risk
Some traders choose to change their risk controls in volatile conditions (for example, reviewing stop placement relative to volatility measures). However these may increase losses; execution and slippage risks can rise sharply in fast markets
Other approaches that some traders review:
Avoid trading crude oil CFDs in the 30 minutes before and after major scheduled data releases.
Use a longer timeframe chart to identify the prevailing trend before entering on a shorter timeframe, reducing the chance of trading against larger institutional flows.
Scale into positions in stages rather than committing full size on initial entry.
Monitor open interest and volume to distinguish between moves with genuine participation and low-liquidity fakeouts.
Whipsawing cannot be eliminated entirely in volatile energy markets. The goal of risk management in these conditions is not to predict which moves will hold, but to ensure that losses on false moves are smaller than gains when a genuine directional move follows.
Practical considerations for volatile Asian markets
Asian markets carry structural characteristics that interact with volatility differently from US or European markets:
Thinner liquidity during local hours can exaggerate moves on thin volume, particularly in energy and FX CFDs.
Events in China, including PMI releases, trade data, and PBOC policy signals, can move regional indices.
BoJ policy decisions have become a more active driver of JPY and Nikkei volatility in recent years.
Overnight gaps from US session moves are a persistent structural risk for traders unable to monitor positions around the clock.
Margin requirements on leveraged products can change at short notice during high-VIX periods.
Frequently asked questions about volatility in Asian markets
What does a high VIX reading mean for Asian equity indices?
VIX measures expected volatility on the S&P 500, but elevated readings typically reflect global risk aversion that flows across markets. Asian indices such as the Nikkei 225, Hang Seng, and ASX 200 can often see increased volatility and negative correlation with sharp VIX spikes.
Can 0DTE options be traded during Asian hours?
Access depends on the platform and the specific instrument. US equity index 0DTE options are most actively priced during US trading hours. Asian traders may face wider spreads and less representative pricing outside those hours.
Are algorithmic trading strategies inherently riskier in high-volatility conditions?
Strategies calibrated during low-volatility periods may perform differently in high-VIX environments. Regular review of parameters against current market conditions is prudent for any systematic approach.
Has the JPY safe-haven trade changed permanently?
The Bank of Japan’s policy normalisation has introduced new dynamics, but JPY has continued to strengthen during some risk-off episodes. It may be more conditional on the nature of the shock and the BoJ’s concurrent posture.
What is the best way to set stops on energy CFDs in high-volatility conditions?
There is no universally best method. Many traders reference ATR to calibrate stop distances to prevailing conditions rather than using fixed levels. This does not guarantee exit at the desired price and does not eliminate whipsaw risk.