
Go further with GO Markets
Trade smarter with a trusted global broker. Low spreads, fast execution, powerful platforms, and award-winning customer support.
20 Years Strong
Celebrating 20 years of trading excellence.
Built for traders since 2006.
For beginners
Just getting
started?
Explore the basics and build your confidence.
For intermediate traders
Take your
strategy further
Access advanced tools for deeper insights than ever before.
Professionals
For professional
traders
Discover our dedicated offering for professionals and sophisticated investors.
Get more out of every trade
Explore our limited-time special offers

Get Started with GO Markets
Whether you’re new to markets or trading full time, GO Markets has an
account tailored to your needs.

Trusted by traders worldwide
Since 2006, GO Markets has helped hundreds of thousands of traders to pursue their trading goals with confidence and precision, supported by robust regulation, client-first service, and award-winning education.
*Trustpilot reviews are provided for the GO Markets group of companies and not exclusively for GO Markets Ltd.


*Awards were awarded to GO Markets group of companies and not exclusively to GO Markets Ltd.
Explore more from GO Markets
CFD markets
Trade CFDs across forex, indices, shares, commodities, metals, ETFs and more.
Platforms & tools
Trading accounts with seamless technology, award-winning client support, and easy access to flexible funding options.
Academy
Learn the skills, strategies, and mindset behind long-term trading success.
Accounts & pricing
Compare account types, view spreads, and choose the option that fits your goals.

Go further with
GO Markets.
Explore thousands of tradable opportunities with institutional-grade tools, seamless execution, and award winning support. Opening an account is quick and easy.
News & insights
Powerful tools for every trading style and preference.

The war in Iran is increasingly shifting from a regional conflict into a global energy shock, as disruption in the Strait of Hormuz threatens the oil market at its most critical chokepoint.
Key takeaways
- Around 20 million barrels per day (bpd) of oil and petroleum products normally pass through the Strait of Hormuz between Iran and Oman, equal to about one-fifth of global oil consumption and roughly 30% of global seaborne oil trade.
- This is a flow shock, not an inventory problem. Oil markets depend on continuous throughput, not static storage.
- If the disruption persists beyond a few weeks, Brent could shift from a short-term spike to a broader price shock, with stagflation risk.
The world’s most critical oil chokepoint
The Strait of Hormuz handles roughly 20 million barrels per day of oil and petroleum products, equal to about 20% of global oil consumption and around 30% of global seaborne oil trade. With global oil demand near 104 million bpd and spare capacity limited, the market was already tightly balanced before the latest escalation.
The strait is also a critical corridor for liquefied natural gas. Around 290 million cubic metres of LNG transited the route each day on average in 2024, representing roughly 20% of global LNG trade, with Asian markets the main destination.
The International Energy Agency (IEA) has described Hormuz as the world’s most important oil transit chokepoint, noting that even partial interruptions may trigger outsized price moves. Brent crude has moved above US$100 a barrel, reflecting both physical tightness and a rising geopolitical risk premium.

Tankers idle as flows slow
Shipping and insurance data now point to strain in real time. More than 85 large crude carriers are reported to be stranded in the Persian Gulf, while more than 150 vessels have been anchored, diverted or delayed as operators reassess safety and insurance cover. That would leave an estimated 120 million to 150 million barrels of crude sitting idle at sea.
Those volumes represent only six to seven days of normal Hormuz throughput, or a little more than one day of global oil consumption.
A market built on flow, not storage
Oil markets function on continuous movement. Refineries, petrochemical plants and global supply chains are calibrated to steady deliveries along predictable sea lanes. When flows through a chokepoint that carries roughly one-fifth of global oil consumption and around 30% of global seaborne oil trade are interrupted, the system can move from equilibrium to deficit within days.
Spare production capacity, largely concentrated within OPEC, is estimated at only 3 million to 5 million bpd. That falls well short of the volumes at risk if Hormuz flows are severely disrupted.
Scenarios for the weeks ahead
Market trajectories now hinge on the duration and severity of the disruption.
Short disruption, 1 to 2 weeks
If tanker traffic resumes within 1 to 2 weeks, the shock may show up as a sharp but ultimately reversible spike.
Cumulative supply loss would remain relatively limited, while inventories and strategic stocks may partly bridge the shortfall. In that scenario, Brent could trade in roughly the US$95 to US$110 range as traders price temporary disruption and elevated risk premia.
Extended disruption, 2 to 4 weeks
Beyond a fortnight, the cumulative loss becomes more material.
A 2 to 4 week disruption affecting up to 20 million bpd could imply roughly 280 million to 560 million barrels of lost supply. Commercial inventories, floating storage and strategic reserves may then begin to erode more visibly. In that scenario, Brent could shift toward the US$110 to US$130 range, while higher fuel costs may begin feeding into transport and industrial production.
These price ranges are scenario-based and indicative, not forecasts.
If the war ends within four weeks
A ceasefire or credible de-escalation within roughly four weeks would likely trigger a sharp reversal in oil markets, though not an instant reset to pre-crisis levels.
Initially, the unwinding of geopolitical risk premia and the normalisation of tanker traffic could push Brent lower, potentially into the US$80 to US$95 range as speculative and hedging positions are reduced.
Assuming flows are fully restored and further disruptions are avoided, prices could gradually trend back toward the low US$70s over subsequent months, broadly consistent with projections that show inventories rebuilding once supply regains a small surplus over demand.
Inflation risks and macro spillovers
The inflationary impact of an oil shock typically arrives in waves. Higher fuel and energy prices may lift headline inflation quickly as petrol, diesel and power costs move higher.
Over time, higher energy costs may pass through freight, food, manufacturing and services. If the disruption persists, the combination of elevated inflation and slower growth could raise the risk of a stagflationary environment and leave central banks facing a difficult trade-off.
No easy offset, a system with little slack
What makes the current episode particularly acute is the lack of slack in the global system.
Global supply and demand near 103 million to 104 million bpd leave little spare cushion when a chokepoint handling nearly 20 million bpd, or about one-fifth of global oil consumption, is compromised. Estimated spare capacity of 3 million to 5 million bpd, mostly within OPEC, would cover only a fraction of the volumes at risk.
Alternative routes, including pipelines that bypass Hormuz and rerouted shipping, can only partly offset lost flows, and usually at higher cost and with longer lead times.
Bottom line
Until transit through the Strait of Hormuz is restored and seen as credibly secure, global oil flows are likely to remain impaired and risk premia elevated. For investors, policymakers and corporate decision-makers, the core question is whether oil can move where it needs to go, every day, without interruption.
Any scenarios, price ranges or market views in this article are illustrative only and should not be relied on as forecasts, guarantees or trading recommendations. Geopolitical events can cause sudden volatility, reduced liquidity and sharp price movements across oil, forex and CFD markets, and trading in these conditions carries a high risk of loss.
After three consecutive years in which mega-cap AI-linked names carried the Nasdaq, the mix of winners may be starting to change.
2026 is the "show me the money" year. Any hint of doubt about whether tech companies were correct to spend nearly US$700 billion on AI last year could have a major impact on market sentiment.
Quick facts
- Global AI capex is projected to exceed US$600 billion in 2026.
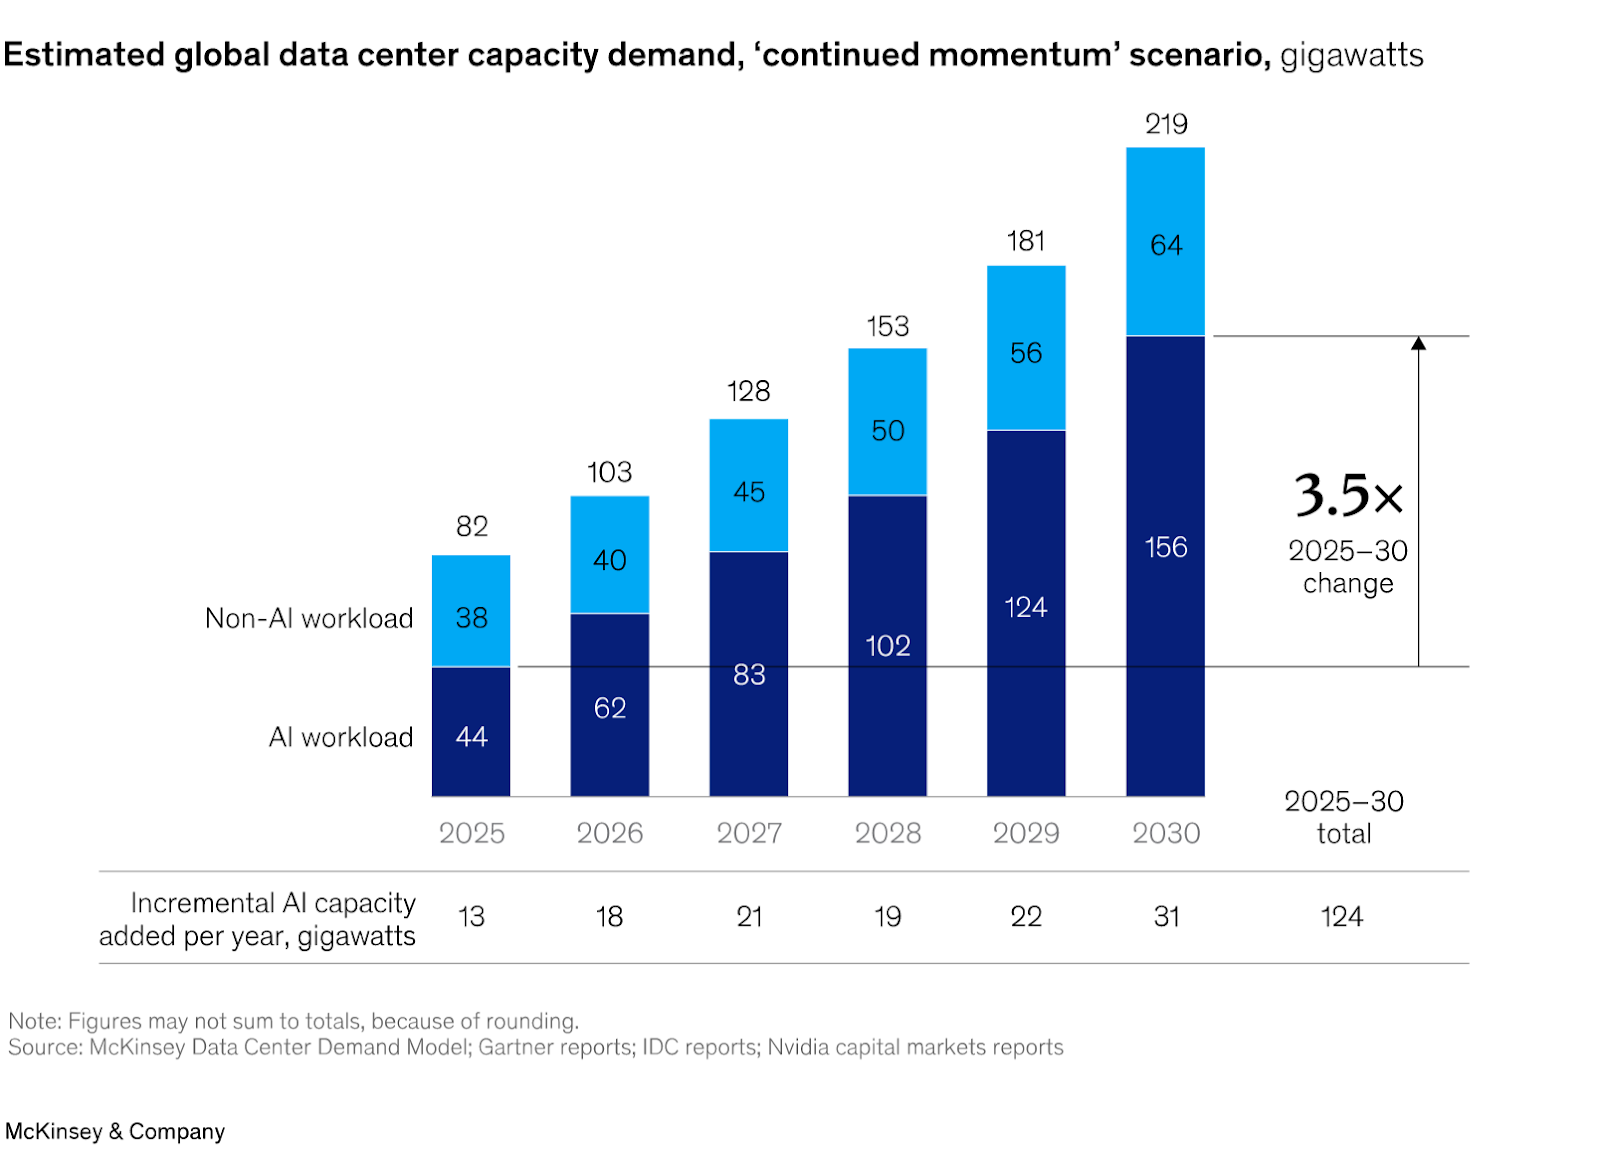
- The total addressable market (TAM) for AI data centre systems is estimated to exceed US$1.2 trillion by 2030.
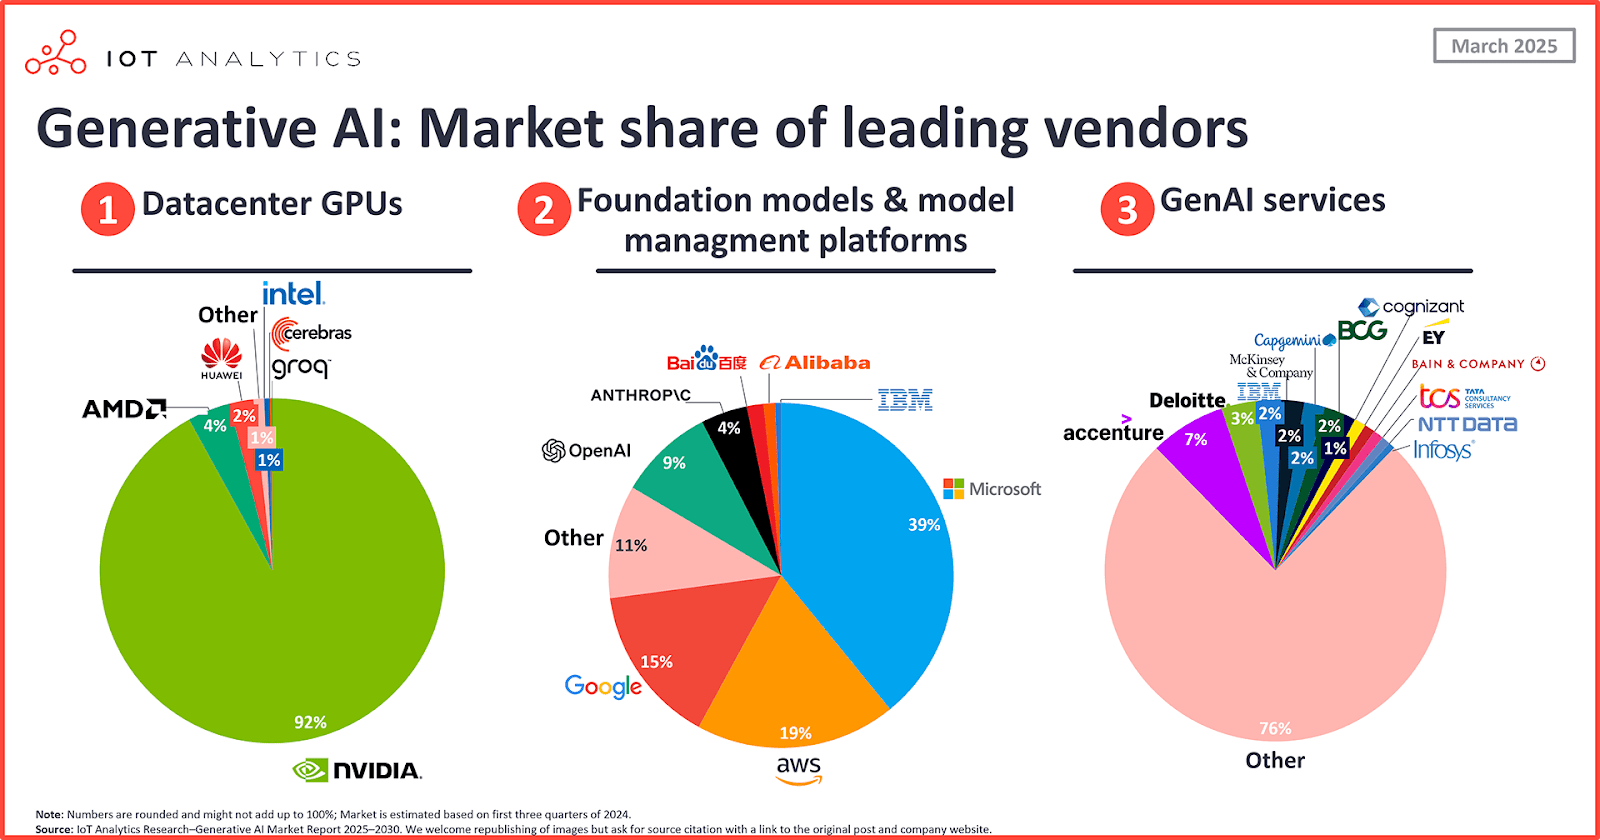
- Nvidia, Microsoft and TSMC are all trading below analyst fair value estimates, despite surging revenues.
- Broadcom's AI chip division is targeting US$100 billion in AI revenue by 2027.
What is powering the AI trade?
Multiple macro forces are likely to underpin the AI investment theme through 2026. The direction of US interest rates, the scale of AI infrastructure spending and the geopolitical backdrop are all likely to matter.
Rates and valuations
The Federal Reserve delivered 75 basis points (bps) of rate cuts in 2025, and markets expect another 50 bps in 2026. Lower rates can reduce the discount applied to future tech earnings and typically support growth stocks, including AI-linked names.
Infrastructure spending and earnings expectations
On the spending side, Nvidia CEO Jensen Huang has said data centre operators could spend up to US$4 trillion annually by 2030, and AI capital spending is projected to reach US$571 billion in 2026 alone.
However, markets appear to have already priced in much of this optimism. Analysts are projecting 14% to 16% annual earnings per share (EPS) growth in 2026. That would require S&P 500 stocks outside the Magnificent 7 to roughly double the pace of earnings growth recorded in 2025.
Geopolitics and export controls
Geopolitics could also shape the outlook. US-China export controls on AI chips, along with reduced access to key international buyers, could weigh on data centre growth projections.
Top AI-linked stocks
Nvidia (NVDA)
Nvidia remains the clearest expression of the AI trade. It holds a wide economic moat thanks to its market leadership in GPUs, hardware, software, and networking tools.
Goldman Sachs and Morgan Stanley both carry price targets near $250 on NVDA, with Goldman's call based on a 2027 revenue forecast of over $380 billion. Bank of America sits in the $275 camp, effectively pricing in more AI upside on 2027 earnings.
At 21.6 times forward earnings, Nvidia is now trading below the broader S&P 500's multiple. Key risks include the overhang from US–China export restrictions and any softening in data centre capex guidance from major cloud providers.
Microsoft (MSFT)
Microsoft is down around 25% from its all-time high. During the second quarter of fiscal year 2026, Azure's revenue increased 39% year over year, and the company holds a US$625 billion backlog of contracted usage still to come.
The gap between the stock's recent performance and its underlying revenue growth has drawn attention from analysts, though elevated valuations across the broader tech sector remain a risk to watch.
Broadcom (AVGO)
While Nvidia makes broad-purpose GPUs, Broadcom is winning business by going bespoke, designing custom AI chips tailored specifically to the needs of individual hyperscalers like Google and Meta.
During Q1 of FY2026, Broadcom's AI semiconductor division grew at a 106% pace to US$8.4 billion, and by the end of 2027 it expects its AI chip revenue to reach more than US$100 billion.
Broadcom trades at a significant premium to the broader market, which could amplify any downside if growth expectations are not met.
TSMC (TSM)
Almost every major AI chip is manufactured by TSMC. The company holds approximately 70% market share in chip foundry, making it the single most critical piece of infrastructure in the entire AI supply chain.
TSMC sales are projected to increase by 30% in 2026, with gross margins expected to remain above 60% as new fabrication capacity comes online.
The primary risk is geopolitical: any escalation in Taiwan Strait tensions could weigh heavily on the stock regardless of its underlying fundamentals.
Vertiv (VRT)
Less prominent than the semiconductor giants, Vertiv provides the power management, cooling, and data centre infrastructure that keeps AI hardware running.
Nvidia, Broadcom, and Vertiv sit at different points in the AI build-out, including compute, custom silicon, networking and physical infrastructure.
Vertiv's revenue is tied to overall AI capex rather than any single chip maker, which gives it a different risk profile to the names above.
Corning (GLW)
Corning's stock rose 84% in 2025 thanks to surging demand from data centres for its fibre optic cables. Its optical communications segment has grown 69% YoY.
At a Price-to-Earnings (P/E) ratio of roughly 37x, Corning trades at a discount to Nvidia and Broadcom while still carrying direct exposure to AI infrastructure spending. However, its valuation depends heavily on continued capex from the major hyperscalers.
US market drivers for March 2026
AI trades beyond the headline stocks
Energy and utilities
Training large-scale AI models is extraordinarily energy-intensive. A typical 1 gigawatt AI data centre facility requires upwards of US$60 billion in capital expenditure, with roughly half going directly to hardware. Utilities exposed to data centre power demand could also be affected by the AI build-out.
International spillover
South Korea's Kospi surged 76% in 2025 due to AI-linked chipmakers like SK Hynix. Japan's Topix, Germany's DAX, and the UK's FTSE 100 also saw gains of more than 20%. Memory supplier Kioxia was the world's best-performing stock, surging 540%.
Data centre infrastructure
Companies like Emcor, which provides critical electrical, HVAC, and power infrastructure to data centres, reported its contracted backlog surged 31.2% year over year to a record US$13.25 billion. These companies can offer different exposure to the AI capex cycle, but they carry their own execution, backlog, margin and valuation risks.
What could derail the AI trade?
Valuation compression
Broadcom trades at about 50x earnings and AMD at 56x. Any disappointment in forward guidance could trigger a sharp contraction in multiples.
The return on investment test
Companies are investing today on the assumption that highly profitable business applications of AI will emerge over time. If the timing or scale of those returns disappoints, the AI trade could face pullbacks.
Index concentration
The 10 largest stocks in the S&P 500 account for about 40% of the index's total value. A rotation out of mega-cap tech could disproportionately affect broad indices.
Efficiency disruption
China's DeepSeek recently published research suggesting large language models may be developed more efficiently than previously assumed. If AI can be built with less compute, demand for GPUs and data centre hardware could fall short of current forecasts.
Bottom line for traders
The AI trade is maturing but far from over. 2026 is shaping up to be a more nuanced chapter, spreading across the full AI value chain.
The US earnings season will be closely watched for evidence that the hundreds of billions being poured into AI infrastructure are beginning to generate the anticipated returns.
All data points referenced in this article were verified against primary sources on 18 March 2026.

ASX defence stocks are back on more watchlists and according to the Stockholm International Peace Research Institute (SIPRI), global military spending reached approximately US$2.718 trillion in 2024, up 9.4% in real terms.
Australia’s current defence settings are set out in the 2024 National Defence Strategy and related investment planning documents, which outline long-term capability funding priorities. Furthermore, Canberra has pointed to A$330 billion of capability investment through 2034, including added funding for surface combatants, preparedness, long-range strike and autonomous systems.
Here is the part most people miss: not all ASX defence stocks are the same trade. Some sit close to naval shipbuilding. Some are counter-drone names and some are smaller, higher-risk operators where one contract may matter much more than the market assumes.

5 volatility questions Aussie traders are asking right now
These five names are not a buy list, rather they are a practical watchlist for investors trying to understand where procurement momentum may actually show up on the ASX.
1) Austal (ASX: ASB)
Austal is one of the ASX-listed companies most directly exposed to Australia’s naval shipbuilding pipeline, although contract execution, margins and delivery timing remain important variables.
They aren't just winning random contracts; they have signed a massive legal agreement (the Strategic Shipbuilding Agreement) that makes them the official partner for building Australia's next generation of mid-sized military ships in Western Australia.
In February 2026, the government gave Austal the green light on a $4 billion project. This isn't for just one ship, it’s for 8 "Landing Craft Heavy" vessels. These are huge transport ships (about 100 metres long) designed to carry heavy tanks and equipment directly onto a beach. But here is the part most people miss, shipbuilding is a marathon, not a sprint.
As you can see in the delivery timeline, while construction starts in 2026, the final ship won't be delivered until 2038. For an investor, this means Austal has a "guaranteed" stream of income for the next 12 years, but they have to be very good at managing their costs over that long period to actually make a profit.
2) DroneShield (ASX: DRO)
If you have seen footage of small drones disrupting modern battlefields, DroneShield is building part of the "off switch". Its focus is counter-drone technology, including systems that detect, disrupt or defeat drones using electronic warfare, sensors and software-led tools, rather than relying only on traditional munitions.
By early 2026, DroneShield had moved beyond the label of a promising start-up and into a much larger commercial phase. It reported FY2025 revenue of A$216.5 million, up 276% from FY2024, and said it started FY2026 with A$103.5 million in committed revenue.
One point the market may overlook is the software layer in the model. DroneShield reported A$11.6 million in Software as a Service (SaaS) revenue in FY2025 and said it is working towards SaaS making up 30% of revenue within five years. Its subscription model includes software updates for deployed systems, which adds a growing stream of recurring revenue alongside hardware sales.
Among ASX defence stocks, DroneShield is one of the most direct ways to follow the counter-UAS theme. It is also one of the names where sentiment can swing quickly, because growth stories can rerate both up and down when order timing changes.
The defence stocks to watch: The Iran War winners & losers
3) Electro Optic Systems (ASX: EOS)
EOS builds both the "brain" and the "muscle" for military platforms. It is best known for remote weapon systems, which allow operators to control armed turrets from inside protected vehicles, and for high-energy laser systems aimed at counter-drone defence. EOS has said its unconditional backlog reached about A$459.1 million in early 2026, following a series of contract wins through 2025. That points to a much larger base of secured work, although delivery timing and revenue conversion still matter.
EOS signed a €71.4 million, about A$125 million, contract with a European customer for a 100-kilowatt high-energy laser weapon system. EOS says the system is designed for a low cost per shot and can engage up to 20 drones a minute. The Australian Government has set aside A$1.3 billion over 10 years for counter-drone capability acquisition, and EOS has disclosed that it was part of a successful LAND 156 bid team. That does not guarantee future revenue, but it does support medium-term visibility in a market the company is already targeting.
EOS reads as a rebound story, but one that still depends on execution. The company has reoriented around remote weapon systems, counter-drone systems and lasers, all areas tied to stronger defence spending. The key question is whether it can keep converting backlog and pipeline into delivered revenue while maintaining balance-sheet discipline.
4) Codan (ASX: CDA)
Codan is sometimes left out of casual defence stock lists because it is more diversified. That may be an oversight. In its H1 FY26 results, Codan said its Communications business designs mission-critical communications for global military and public safety markets. Communications revenue rose 19% to A$221.8 million. The company also said DTC delivered strong growth from defence and unmanned systems demand, with unmanned systems revenue up 68% to A$73 million. Codan said about half of that unmanned revenue was linked to operational defence applications in conflict zones.
This is where the story becomes more nuanced. In a basket of ASX defence stocks, Codan may offer a different profile, with less pure headline sensitivity, broader operating diversification and meaningful exposure to military communications and unmanned systems without being a single-theme name. That diversification may also mean the stock does not always trade like a pure-play defence name.
What rising oil prices could mean for Exxon, Chevron and Woodside
5) HighCom (ASX: HCL)
HighCom sits at the speculative end of this list, and it should be labelled that way. The company says its two continuing businesses are HighCom Armor, which supplies ballistic protection, and HighCom Technology, which supplies and maintains small and medium uncrewed aerial systems, counter-uncrewed aerial systems, and related engineering, integration, maintenance and logistics support for the ADF and other aligned regional militaries.
In H1 FY26, revenue from continuing operations fell 59% to A$10.9 million, while EBITDA moved to a A$5.4 million loss from a A$1.9 million profit a year earlier. HighCom also disclosed A$5.1 million in HighCom Technology revenue, including A$3.5 million from small uncrewed aerial systems (SUAS) spare parts and A$1.6 million from sustainment services provided to the Australian Department of Defence.
So yes, HighCom is one of the more financially sensitive ASX defence stocks on the board. But it is also the kind of smaller name that can show how procurement filters down into support, sustainment and specialist protection gear.
Key market observations
- Track program milestones, not just political headlines. Contract awards, manufacturing starts, delivery schedules and sustainment work often matter more than a single announcement day.
- Separate pure-play exposure from diversified exposure. DroneShield and EOS are closer to concentrated defence technology themes, while Codan brings communications exposure within a broader business mix.
- Watch sovereign capability themes in Australia. Austal and EOS are tied to local manufacturing, integration and Australian supply chains, which supports the broader sovereign capability theme in this group.
- Pay attention to balance sheets and cash conversion. Procurement momentum can be real even when timing gets messy. HighCom's latest half is a reminder of that.
Global volatility and CFDs: how to trade after a geopolitics shock
Risks and constraints
Defence headlines can look immediate. Earnings usually are not. Austal's major naval work stretches into the next decade. EOS contracts are delivered over multiple years. DroneShield's order flow appears strong, but the company still separates committed revenue from broader pipeline opportunity. HighCom shows the other side of the coin. Exposure to procurement does not automatically translate into smooth financial execution.
References to ASX-listed defence stocks are general information only, not a recommendation to buy, sell or hold any security or CFD. These stocks can be highly volatile and are sensitive to contract timing, government policy, geopolitics, execution risk and market conditions. Backlog, pipeline and revenue expectations are not guarantees of future performance.