The Week Ahead – Jobs, CPI and Retail Sales - the Charts to watch
Lachlan Meakin
2/2/2024
•
0 min read
Share this post
Copy URL
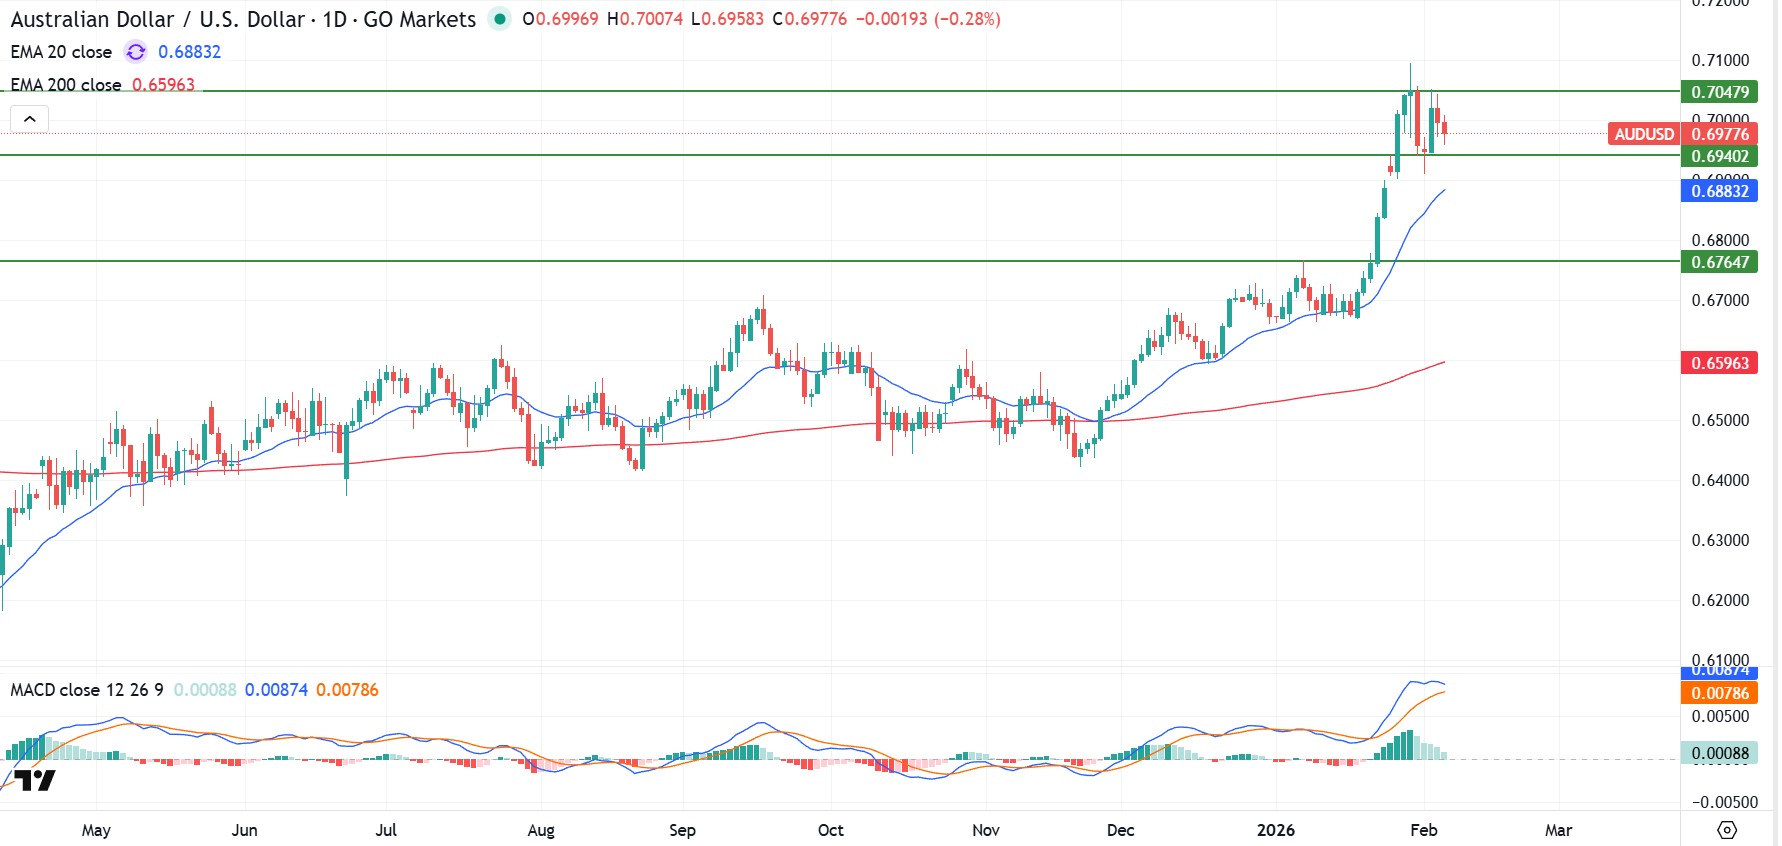
FX traders come into the new week with an uptick in tier one economic releases to look forward to after a very slow start to the year volatility-wise. Australian and US employment figures, UK CPI and US retail sales look to headline from Tuesday onwards (Monday is a US public holiday) The Charts to watch: AUDUSD AUDUSD has struggled to find any real direction in the last week of trading after a marked decline to start the year. The pair has whipsawed in a tight range from 0.6735 to the upside with a lower range boundary of 0.6645.
With the market still undecided on the RBA’s moves going forward (peak rates? cuts?) Thursday’s job report could see the Aussie find some direction, with the above range levels the key levels to watch. After November’s bumper figure a surprise to the downside this time round could be on the cards. GBPUSD The uptrend GBPUSD has travelled in since October has petered out somewhat in 2024 to date with Cable also trading in a directionless range for the last week.
For chartists there is a multitude of important levels to watch coming into the new week. Upper trendline and cycle high resistance along with lower trendline and cycle low support being the key levels to watch this week. To add to the mix for fundamental traders we have UK CPI and retail sales along with another speaking engagement for BoE governor Bailey.
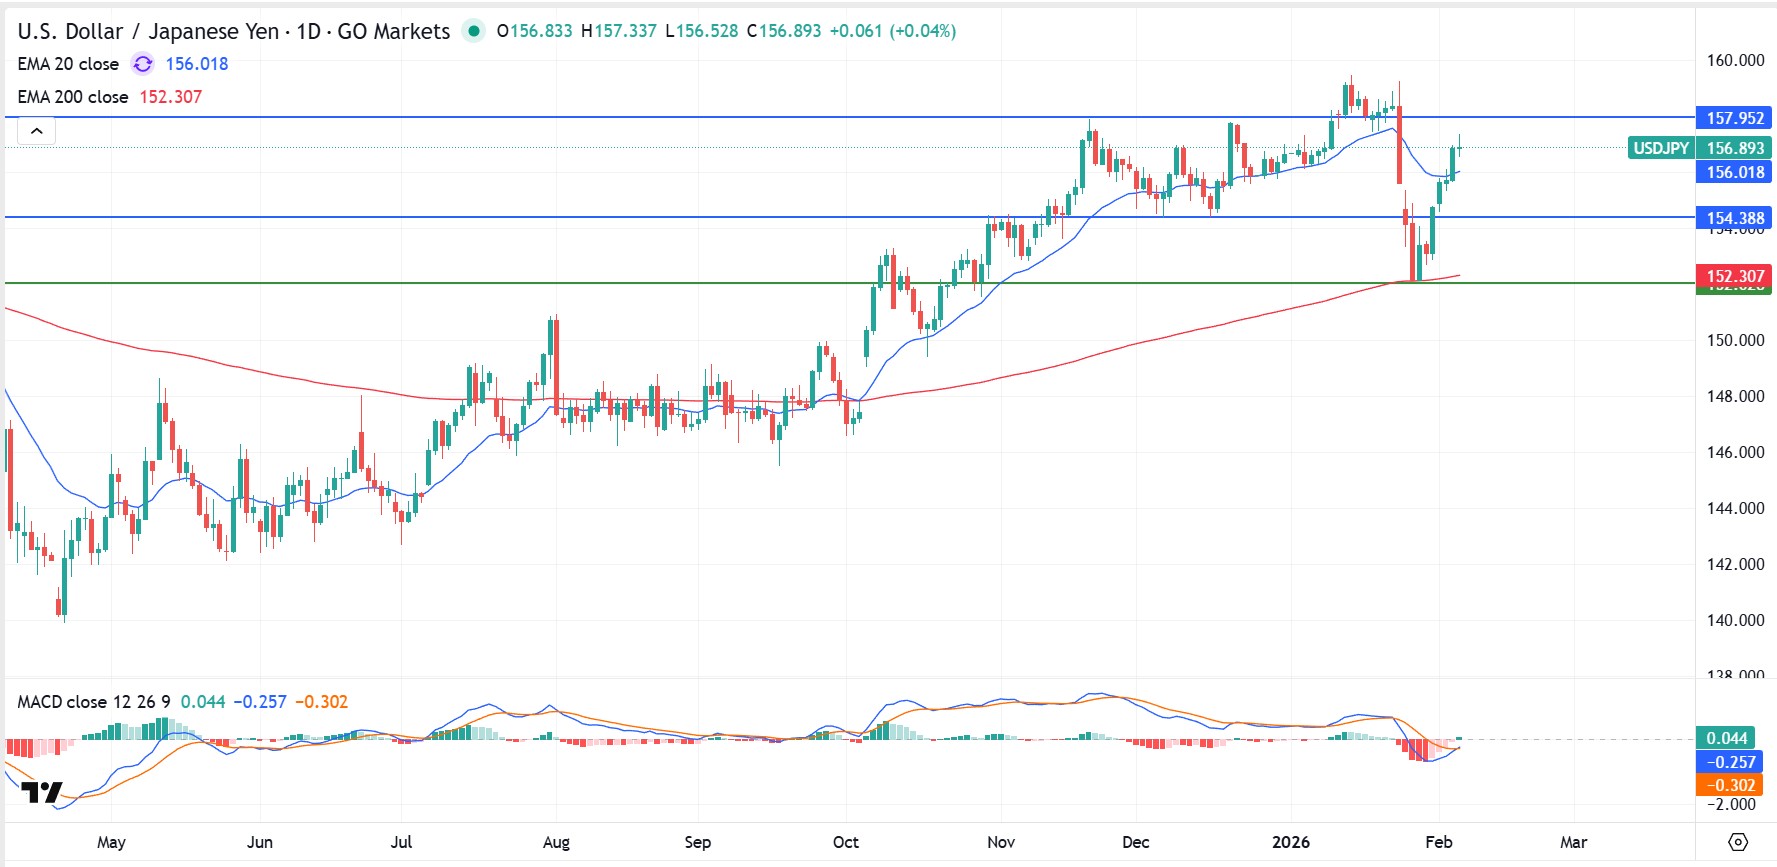
USDJPY Bucking the trend of the low volatility of other pairs, USDJPY has had s harp rally so far in 2024, following US10-JP10 yield differentials higher. Last weeks move higher in the pair saw a disconnect in the relationship and USDJPY could struggle to push much higher unless this differential turns around. US economic releases this week will play a big part in where those yields go, with retail sales, employment and consumer sentiment all due to hit the wires from Wednesday onwards. 146 to the upside and 144 to the downside the key levels to watch for the chartists.
Full weeks calendar at the link below: https://www.gomarkets.com/au/economic-calendar/
By
Lachlan Meakin
Head of Research, GO Markets Australia.
The information provided is of general nature only and does not take into account your personal objectives, financial situations or needs. Before acting on any information provided, you should consider whether the information is suitable for you and your personal circumstances and if necessary, seek appropriate professional advice. All opinions, conclusions, forecasts or recommendations are reasonably held at the time of compilation but are subject to change without notice. Past performance is not an indication of future performance. Go Markets Pty Ltd, ABN 85 081 864 039, AFSL 254963 is a CFD issuer, and trading carries significant risks and is not suitable for everyone. You do not own or have any interest in the rights to the underlying assets. You should consider the appropriateness by reviewing our TMD, FSG, PDS and other CFD legal documents to ensure you understand the risks before you invest in CFDs.
Os mercados cambiais (FX) de março podem ser moldados por vários lançamentos de alto impacto agrupados na primeira metade do mês. Os PMIs da China, o PIB da Austrália, o PIB do Japão e a reunião de março do Federal Reserve podem influenciar o sentimento cambial à medida que o mês avança.
Fatos rápidos
As expectativas de taxas dos EUA permanecem estáveis, com o CME FedWatch implicando uma probabilidade maior de 85% de nenhuma mudança na taxa na reunião do FOMC de março.
Os PMIs, o CPI/PPI e os dados comerciais da China ajudarão a moldar o tom de risco regional do início do mês.
O PIB da Austrália, a decisão do RBA, os dados da força de trabalho e o IPC criam uma janela de eventos domésticos concentrada para o AUD.
O PIB do Japão e a reunião de política do Banco do Japão (BoJ) podem influenciar a reprecificação do rendimento doméstico e a volatilidade do JPY.
O IPC da área do euro, a produção industrial e a decisão de política monetária do BCE continuam sendo fundamentais para a estabilidade do EUR.
Dólar americano (USD)
Eventos-chave
Folhas de pagamento não agrícolas: 12h30, 7 de março (AEDT)
Índice de Preços ao Consumidor (IPC): 23h30, 11 de março (AEDT)
Vendas no varejo: 23h30, 17 de março (AEDT)
Decisão política do Federal Reserve: 5:00 da manhã, 19 de março (AEDT)
Conferência de imprensa do Federal Reserve: 5h30, 19 de março (AEDT)
O que assistir
O dólar continua sendo impulsionado principalmente pelos dados de inflação e mão de obra e suas implicações nos preços do Federal Reserve.
Os preços do CME FedWatch indicam que os mercados estão atribuindo uma probabilidade maior de 85% de nenhuma alteração na taxa na reunião do FOMC de março. Isso sugere que o posicionamento está atualmente ancorado em torno de uma pausa, aumentando a sensibilidade a qualquer surpresa inflacionária que possa mudar as expectativas.
Com uma pausa amplamente cotada, a direção do USD pode depender mais da trajetória da inflação e das expectativas políticas de longo prazo do que da própria decisão. CPI mais firmes ou dados trabalhistas resilientes podem reforçar o apoio ao rendimento.
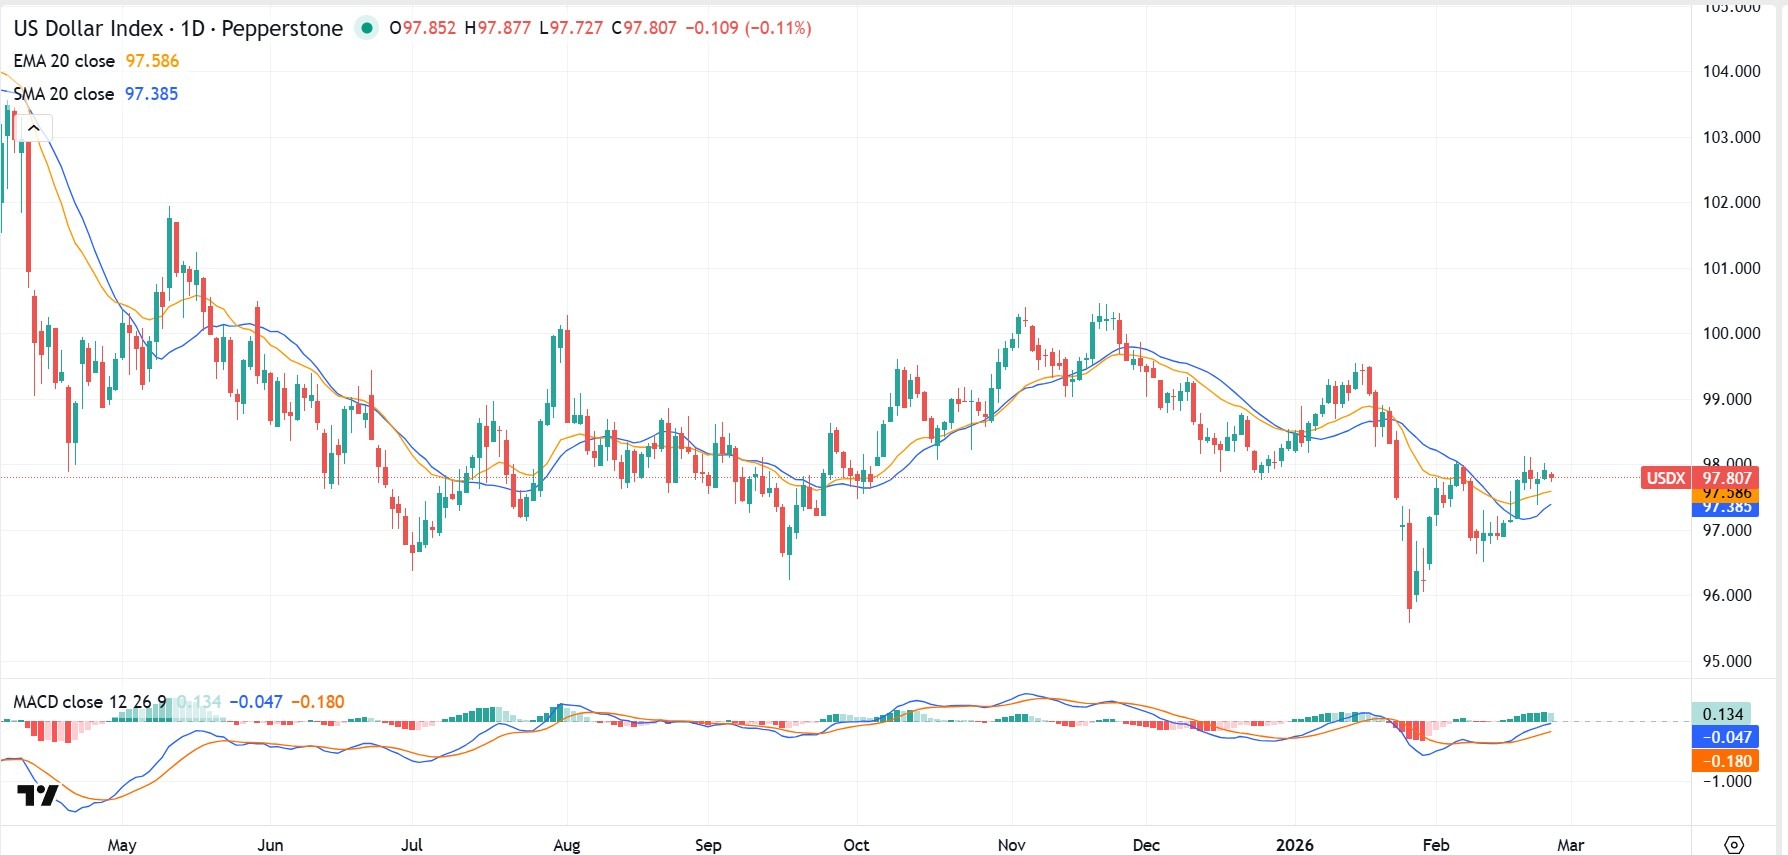
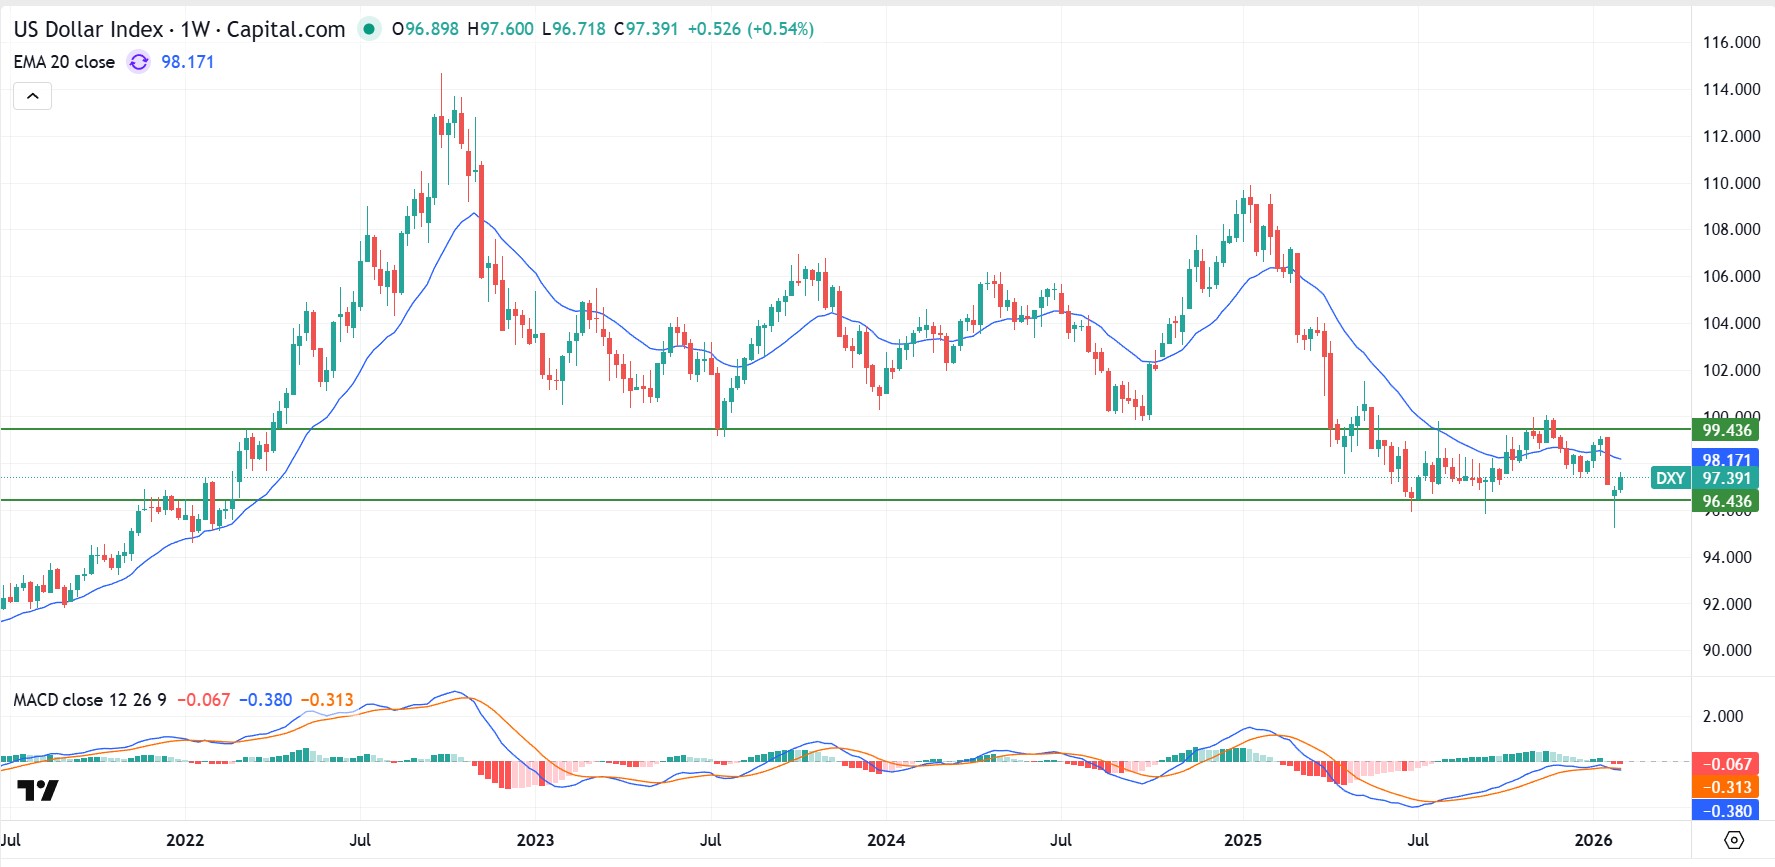
Gráfico chave: gráfico semanal do índice do dólar americano (DXY)
CPI da área do euro (estimativa instantânea): 22h, 3 de março (AEDT)
Produção industrial da área do euro: 21h, 13 de março (AEDT)
Decisão de política monetária do BCE: 12h15, 20 de março (AEDT)
Conferência de imprensa do BCE: 12h45, 20 de março (AEDT)
PMI instantâneo da zona do euro: 20h, 24 de março (AEDT)
O que assistir
A direção do EUR permanece ligada à persistência da inflação e se os dados de crescimento estabilizam as expectativas em torno da política do BCE.
A inflação estável ou a melhoria dos dados de atividade podem limitar as expectativas de flexibilização e apoiar o EUR. Inflação mais baixa e dados de produção mais fracos podem renovar a pressão negativa, especialmente se os dados dos EUA permanecerem firmes.
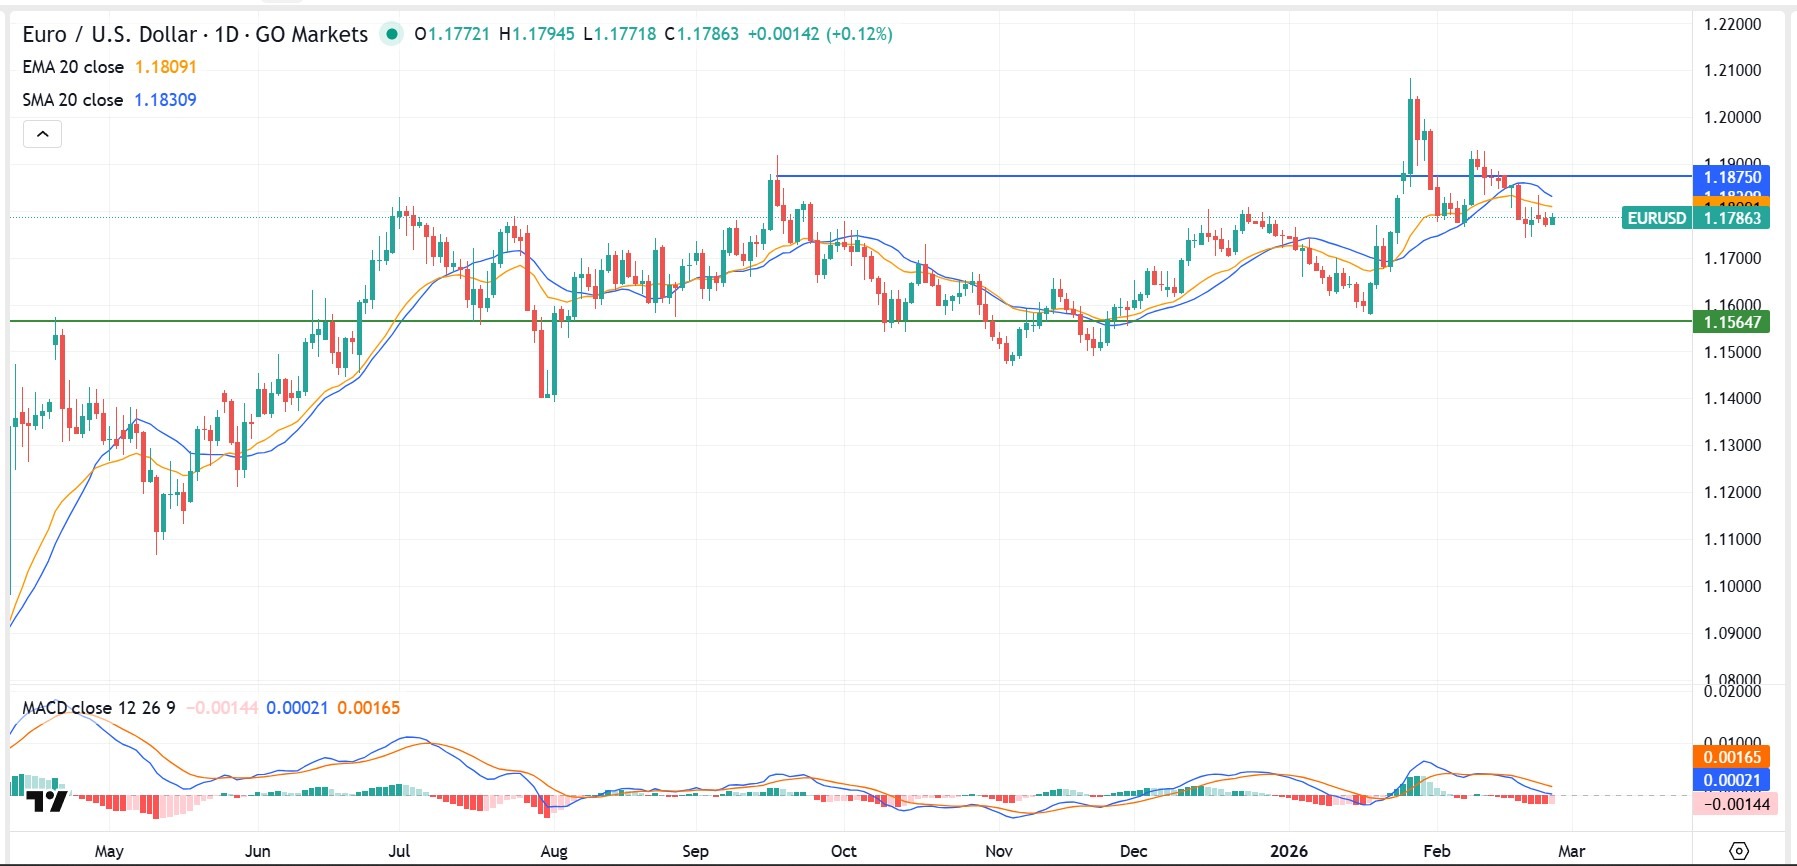
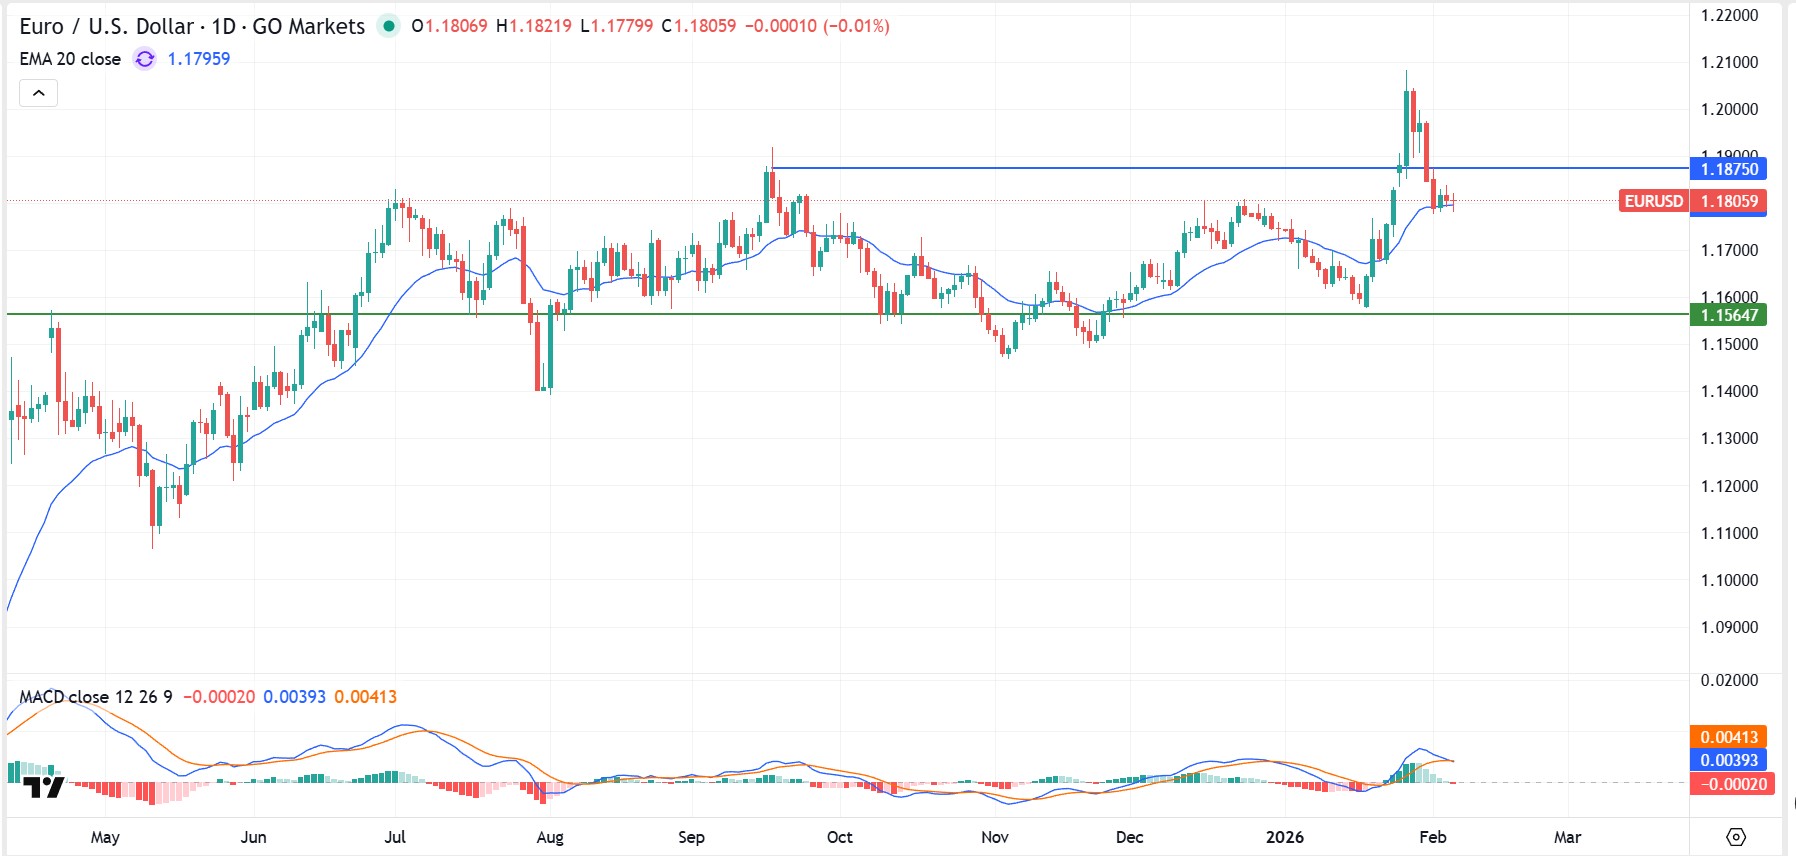
A estrutura diária do EUR/USD mostra consolidação após uma extensão ascendente no início do ano. O impulso de curto prazo foi moderado, com o preço se mantendo acima dos níveis de suporte de longo prazo.
PIB do Japão (quarto trimestre de 2025, 2ª estimativa): 10h50, 10 de março (AEDT)
Reunião de política do Banco do Japão: 18—19 de março (AEDT)
Declaração do BOJ sobre política monetária: 19 de março (AEDT)
O que assistir
O JPY permanece sensível aos dados de crescimento doméstico e às decisões políticas do Banco do Japão. As expectativas de rendimento e os sinais de normalização da política continuam a influenciar a volatilidade do USD/JPY e entre JPY.
A reunião de política do BOJ e a comunicação subsequente podem influenciar a volatilidade de curto prazo e as expectativas de taxas de longo prazo e, por extensão, o sentimento do JPY.
Um PIB mais forte ou sinais políticos que reforçam a normalização podem apoiar o JPY por meio de ajustes de rendimento doméstico. Mensagens mais cautelosas podem manter os diferenciais de rendimento em favor do USD e do AUD.
Decisão de política monetária do RBA: 14h30, 17 de março (AEDT)
Pesquisa sobre a força de trabalho: 11h30, 19 de março (AEDT)
Índice de Preços ao Consumidor (IPC): 11h30, 25 de março (AEDT)
O que assistir
O AUD enfrenta um calendário doméstico centrado na reunião do RBA de 16 a 17 de março. As liberações de crescimento, mão de obra e inflação se agrupam em uma janela de três semanas, aumentando o potencial de volatilidade.
Um PIB mais forte ou uma inflação persistente podem reforçar a cautela política e apoiar o AUD. Resultados mais fracos de mão de obra ou IPC podem pesar sobre as expectativas da taxa e pressionar o AUD, particularmente em relação ao USD e ao JPY.
Os dados chineses no início do mês também podem influenciar o sentimento regional e as moedas vinculadas a commodities, como o AUD.
A tocha é acesa em Milão, e a atenção do público passou do teatro da cerimônia de abertura para a competição nas pistas.
Mas para os negociantes de forex (FX), os olhos ainda estão nos gráficos do euro (EUR). Com a Itália no centro do mundo esportivo, a economia da zona do euro está enfrentando um dos momentos mais assistidos do ano.
1. A vantagem de jogar em casa (economia da Itália)
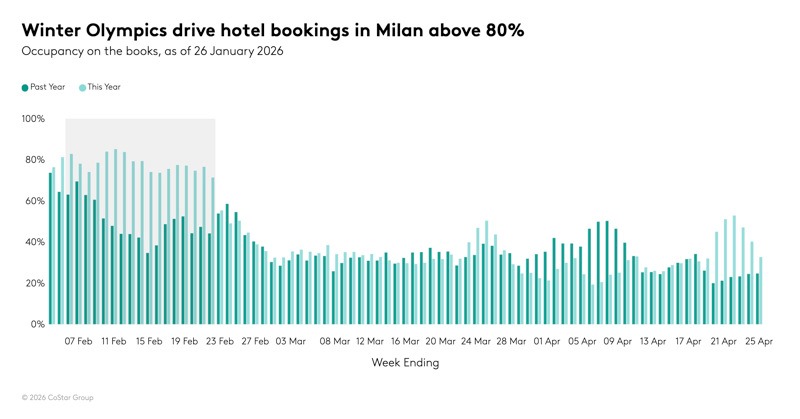
Algumas estimativas sugerem que as Olimpíadas poderiam impulsionar aproximadamente 5,3 bilhões de euros à economia italiana, impulsionada por gastos diretos e por uma maior redução do turismo quando a chama se apagar. Em termos práticos, isso pode significar uma fase antecipada de “despesas diretas”. A demanda por hospitalidade, varejo e transporte pode atingir o pico quando cerca de 2,5 milhões de espectadores se deslocam entre Milão e as Dolomitas.
Tarefa da lista de verificação: Observe a produção industrial da Itália (quarta-feira, 11 de fevereiro de 2026). Embora os Jogos possam apoiar a atividade de serviços, vale a pena acompanhar se os dados de produção mais amplos estão acompanhando o ritmo ou se o impacto olímpico está estreitamente concentrado nos setores vinculados ao turismo.
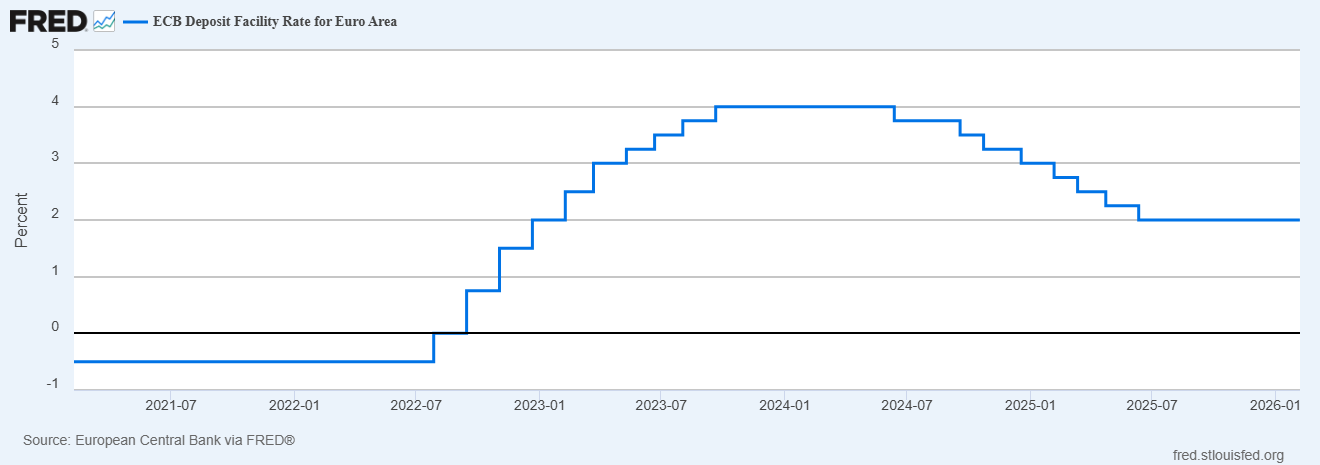
Na reunião de 5 de fevereiro, o Banco Central Europeu (BCE) manteve as configurações de política estáveis em 2,15% e a facilidade de depósito em 2,00%. A presidente Christine Lagarde sinalizou que, embora a inflação pareça estar se estabilizando, o BCE permanece no modo “esperar para ver”.
Tarefa da lista de verificação: Monitore os discursos dos membros do BCE nesta semana. Qualquer mudança de tom, incluindo uma inclinação mais agressiva que sugira que as taxas podem permanecer mais altas por mais tempo, pode atuar como um potencial vento favorável para o EUR/USD, especialmente se contrastar com um tom mais cauteloso do Federal Reserve.
As finais olímpicas de maior prestígio geralmente acontecem na noite europeia. Para os traders, isso se alinha com a sobreposição das sessões de Londres a Nova York (normalmente das 14:00 às 17:00 GMT). É quando a liquidez é mais profunda nos cruzamentos de EUR e quando o posicionamento pode contornar dados e manchetes.
Tarefa da lista de verificação: Espere um possível pico de liquidez e o potencial de “falsos surtos” durante essas horas. Se um dado importante dos EUA (como as vendas no varejo de terça-feira ou o IPC de sexta-feira) chegar enquanto os mercados europeus ainda estiverem abertos, os pares de EUR poderão ver uma recuperação na volatilidade.
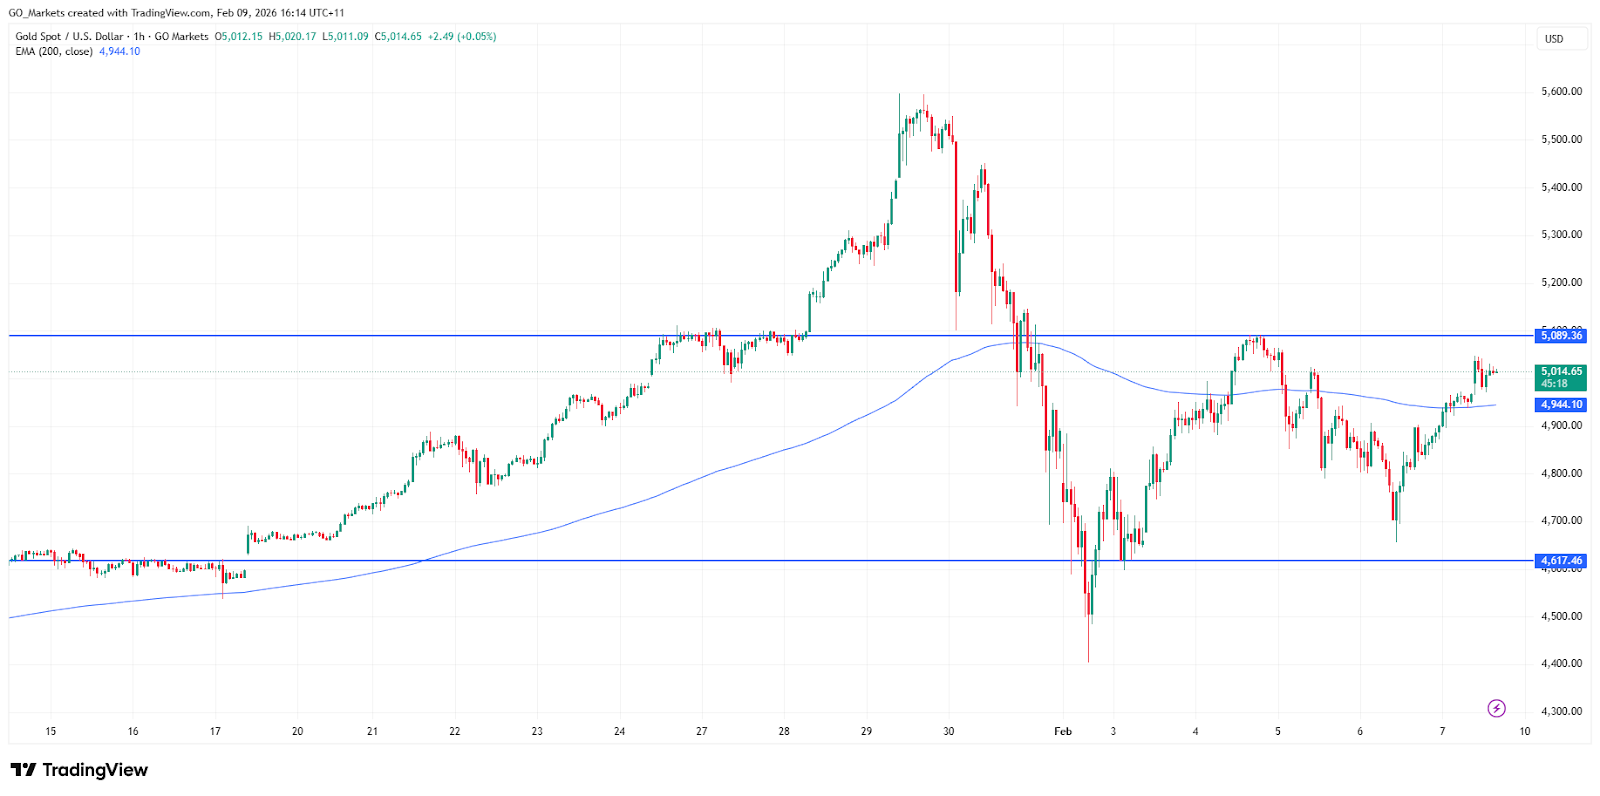
Embora o euro seja a estrela do show, as Olimpíadas ainda podem ser obscurecidas por um ruído geopolítico mais amplo. Por exemplo, o ouro já está sendo negociado em torno da marca de USD 5.000 depois de ultrapassá-la brevemente no início de fevereiro, impulsionado pelas compras pelo banco central, pelas expectativas de um dólar mais fraco e pelas melhores previsões para o final do ano.
Tarefa da lista de verificação: Se o sentimento diminuir o risco, observe os ativos tradicionais do paraíso, como o franco suíço (CHF) e o ouro. O ouro sofreu grandes oscilações recentemente e atualmente está testando uma resistência de cerca de USD 5.000. O EUR/CHF também pode ter maior volatilidade se as manchetes geopolíticas se intensificarem durante os Jogos.
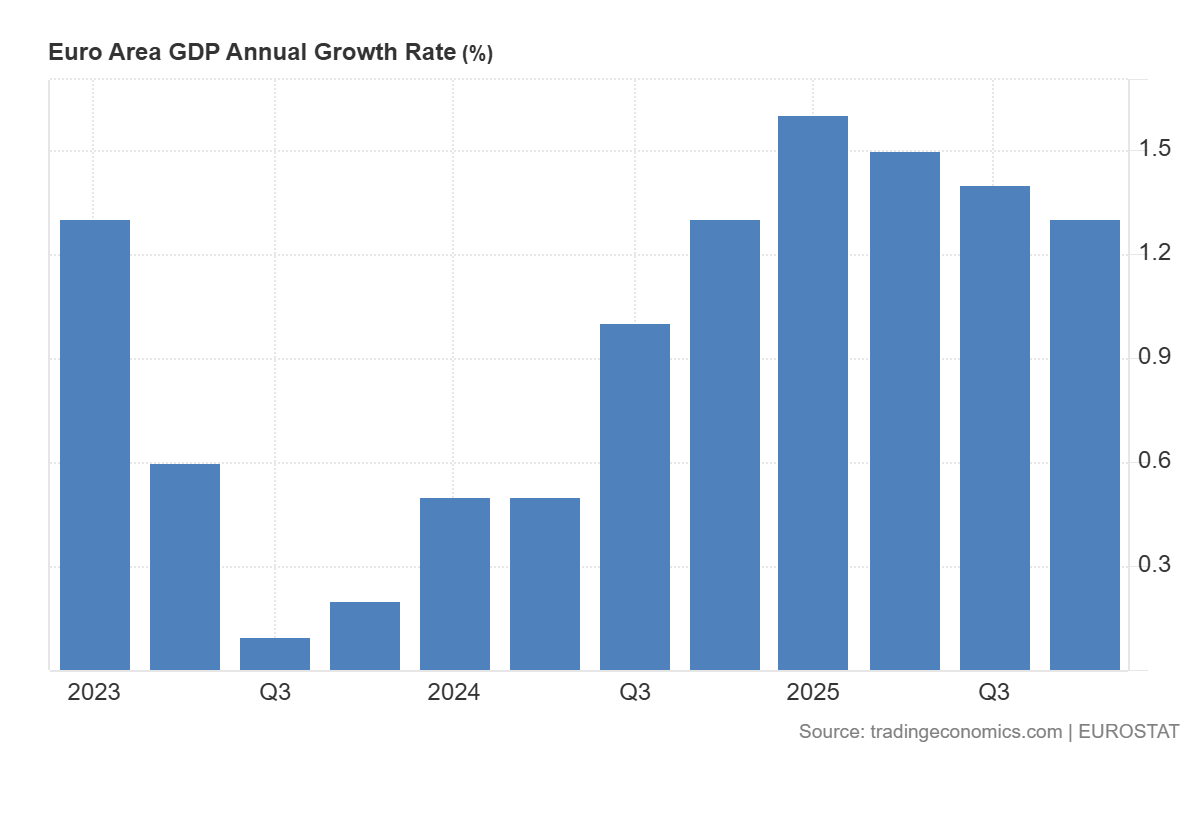
A semana termina com o PIB do quarto trimestre da zona do euro (segunda estimativa) na sexta-feira, 13 de fevereiro de 2026.
Tarefa da lista de verificação: A estimativa preliminar mostrou um crescimento de 0,3%. Se o valor for revisado para cima, pode reforçar a resiliência da zona do euro e apoiar uma oferta de EUR no final da semana.
Embora o “impulso olímpico” possa oferecer uma almofada de sentimento para a Itália, é provável que a direção do euro seja moldada pelo fato de a postura de “esperar para ver” do BCE ser desafiada pela atualização do PIB de sexta-feira ou pela divulgação da produção industrial de quarta-feira.
Com o ouro pairando perto de USD 5.000 e os EUA enfrentando um calendário afetado por dados reprogramados, a volatilidade pode permanecer elevada até os principais horários de sobreposição, no momento em que os eventos do horário nobre estão ocorrendo.
É provável que o cenário cambial de fevereiro seja impulsionado pela persistência da inflação, resiliência trabalhista e comunicações do banco central. Com vários lançamentos de dados de alto impacto nos EUA, Europa, Japão e Austrália, os movimentos de curto prazo podem ser mais orientados por eventos e repreços do que por tendências.
Fatos rápidos
O USD continua sendo o principal ponto de referência, com os dados dos EUA impulsionando a reprecificação dos rendimentos e do mercado cambial mais amplo.
A sensibilidade do EUR permanece alta em torno das mensagens do Banco Central Europeu (BCE) e dos sinais de inflação e atividade recebidos.
O JPY permanece intimamente ligado aos dados domésticos e à comunicação do Banco do Japão (BOJ), com o USD/JPY frequentemente reagindo bruscamente às mudanças nas expectativas de rendimento.
O AUD permanece sensível às políticas, com a inflação doméstica e os dados trabalhistas provavelmente sendo os mais importantes, juntamente com o tom de risco global e os metais.
Dólar americano (USD)
Eventos-chave
Folhas de pagamento não agrícolas (NFP) e desemprego: 8h30, 11 de fevereiro (ET) | 12h30, 12 de fevereiro (AEDT)
Índice de Preços ao Consumidor (IPC), título e núcleo: 8h30, 13 de fevereiro (ET) | 12h30, 13 de fevereiro (AEDT)
Renda e despesas pessoais (inclui o índice de preços do PCE): 8:30, 20 de fevereiro (ET) | 12:30, 21 de fevereiro (AEDT)
O que assistir
É provável que o dólar permaneça impulsionado principalmente por mudanças nos dados de inflação e trabalho e suas implicações nas expectativas de taxas do Federal Reserve. Manchetes recentes sobre Independência da Reserva Federal também adicionaram volatilidade ao posicionamento do USD.
Uma inflação mais forte ou a resiliência do trabalho estão frequentemente associadas a um apoio mais firme do USD por meio de maiores expectativas de rendimento. Resultados mais suaves podem reduzir o suporte da taxa e permitir que pares como EUR/USD e AUD/USD se estabilizem.
Gráfico chave: gráfico semanal do índice do dólar americano (DXY)
Decisão política do BCE: 12h15, 6 de fevereiro (AEDT)
Conferência de imprensa do BCE: 12h45, 6 de fevereiro (AEDT)
Estimativas instantâneas do BCE para o PIB e o emprego: 20h, 13 de fevereiro (AEDT)
O que assistir
EUR A direção permanece ligada a se o BCE pode manter sua posição sem uma deterioração material da atividade, ou se os dados de inflação e crescimento impulsionam expectativas de flexibilização.
O crescimento resiliente e a inflação firme podem apoiar o viés de preços “mais altos por mais tempo”. Um crescimento mais fraco ou uma inflação mais baixa podem pesar sobre a moeda, especialmente se apresentarem expectativas de redução.
PIB preliminar do Japão (quarto trimestre de 2025, primeira preliminar): 18h50, 15 de fevereiro (ET) | 10h50, 16 de fevereiro (AEDT)
CPI nacional (Japão): 20 de fevereiro (Japão)
O que assistir
O JPY permanece sensível às mudanças de rendimento doméstico e à comunicação do BOJ. Mesmo ajustes modestos nas expectativas de política podem gerar movimentos gigantescos no USD/JPY.
Resultados firmes de crescimento ou inflação podem apoiar o JPY por meio de maiores rendimentos domésticos e mudanças nas expectativas do BOJ. Resultados mais suaves ou mensagens políticas cautelosas podem manter o USD/JPY suportado.
Índice de preços salariais: 11h30, 18 de fevereiro (AEDT)
Pesquisa sobre a força de trabalho: 11h30, 19 de fevereiro (AEDT)
Índice de Preços ao Consumidor (IPC): 11h30, 25 de fevereiro (AEDT)
O que assistir
O AUD permanece sensível à política, respondendo rapidamente aos dados domésticos de inflação e mão de obra, bem como ao sentimento global de risco e seu impacto nos preços dos metais.
Salários persistentes ou pressões inflacionárias podem apoiar o AUD por meio de expectativas políticas mais firmes. A suavização dos dados pode reduzir o suporte da taxa e pesar no desempenho do AUD, especialmente em relação ao USD e ao JPY.
As ações de defesa da ASX estão de volta em mais listas de observação e, de acordo com o Instituto Internacional de Pesquisa da Paz de Estocolmo (SIPRI), os gastos militares globais atingiram aproximadamente USD 2,718 trilhões em 2024, um aumento de 9,4% em termos reais.
As configurações atuais de defesa da Austrália estão definidas na Estratégia Nacional de Defesa de 2024 e nos documentos de planejamento de investimento relacionados, que descrevem as prioridades de financiamento de capacidades de longo prazo. Além disso, Canberra apontou um investimento de capacidade de 330 bilhões de dólares australianos até 2034, incluindo financiamento adicional para combatentes de superfície, preparação, ataques de longo alcance e sistemas autônomos.
Aqui está a parte que a maioria das pessoas perde: nem todas as ações de defesa da ASX são negociadas da mesma forma. Alguns ficam perto da construção naval. Alguns são nomes de contra-drones e alguns são operadores menores e de alto risco, onde um contrato pode importar muito mais do que o mercado supõe.
Esses cinco nomes não são uma lista de compras, mas sim uma lista prática para investidores que tentam entender onde o impulso de compras pode realmente aparecer no ASX.
1) Austal (ASX: ASB)
A Austal é uma das empresas listadas na ASX mais diretamente expostas ao gasoduto de construção naval da Austrália, embora a execução do contrato, as margens e o prazo de entrega continuem sendo variáveis importantes.
Eles não estão apenas ganhando contratos aleatórios; eles assinaram um grande acordo legal (o Acordo Estratégico de Construção Naval) que os torna parceiros oficiais para construir a próxima geração de navios militares de médio porte da Austrália na Austrália Ocidental.
Em fevereiro de 2026, o governo deu luz verde à Austal para um projeto de 4 bilhões de dólares. Isso não é para apenas um navio, é para 8 navios “Landing Craft Heavy”. São enormes navios de transporte (cerca de 100 metros de comprimento) projetados para transportar tanques pesados e equipamentos diretamente para a praia. Mas aqui está a parte que a maioria das pessoas perde: a construção naval é uma maratona, não um sprint.
Como você pode ver no cronograma de entrega, embora a construção comece em 2026, o navio final não será entregue até 2038. Para um investidor, isso significa que a Austal tem um fluxo de renda “garantido” para os próximos 12 anos, mas ele precisa ser muito bom em gerenciar seus custos durante esse longo período para realmente obter lucro.
2) DroneShield (ASX: DRO)
Se você já viu imagens de pequenos drones interrompendo campos de batalha modernos, o DroneShield está construindo parte do “botão de desligamento”. Seu foco é a tecnologia de combate a drones, incluindo sistemas que detectam, interrompem ou derrotam drones usando guerra eletrônica, sensores e ferramentas baseadas em software, em vez de depender apenas de munições tradicionais.
No início de 2026, a DroneShield deixou de ser uma startup promissora e entrou em uma fase comercial muito maior. Ela registrou uma receita do ano fiscal de 2025 de A $216,5 milhões, um aumento de 276% em relação ao ano fiscal de 2024, e disse que iniciou o ano fiscal de 2026 com A $103,5 milhões em receita comprometida.
Um ponto que o mercado pode ignorar é a camada de software no modelo. A DroneShield registrou receita de A $11,6 milhões em software como serviço (SaaS) no ano fiscal de 2025 e disse que está trabalhando para que o SaaS represente 30% da receita em cinco anos. Seu modelo de assinatura inclui atualizações de software para sistemas implantados, o que adiciona um fluxo crescente de receita recorrente junto com as vendas de hardware.
Entre as ações de defesa da ASX, a DroneShield é uma das formas mais diretas de seguir o tema Counter-UAS. É também um dos nomes em que o sentimento pode oscilar rapidamente, porque as histórias de crescimento podem aumentar e diminuir quando o tempo do pedido muda.
A EOS constrói tanto o “cérebro” quanto o “músculo” para plataformas militares. É mais conhecido por sistemas de armas remotas, que permitem aos operadores controlar torres armadas de dentro de veículos protegidos, e por sistemas de laser de alta energia voltados para a defesa contra drones. A EOS disse que seu acúmulo incondicional atingiu cerca de A $459,1 milhões no início de 2026, após uma série de vitórias de contratos até 2025. Isso aponta para uma base muito maior de trabalho seguro, embora o tempo de entrega e a conversão de receita ainda sejam importantes.
A EOS assinou um contrato de €71,4 milhões, cerca de A $125 milhões, com um cliente europeu para um sistema de armas a laser de alta energia de 100 quilowatts. A EOS afirma que o sistema foi projetado para um baixo custo por tiro e pode acionar até 20 drones por minuto. O governo australiano reservou A $1,3 bilhão em 10 anos para a aquisição de capacidade de combate a drones, e a EOS divulgou que fez parte de uma equipe bem-sucedida de licitação do LAND 156. Isso não garante receita futura, mas dá suporte à visibilidade de médio prazo em um mercado que a empresa já tem como alvo.
A EOS parece uma história de recuperação, mas que ainda depende da execução. A empresa se reorientou em torno de sistemas de armas remotas, sistemas de combate a drones e lasers, todas áreas vinculadas a maiores gastos com defesa. A questão principal é se ela pode continuar convertendo o acúmulo e o pipeline em receita gerada e, ao mesmo tempo, manter a disciplina do balanço patrimonial.
4) Codan (ASX: CDA)
Às vezes, a Codan fica de fora das listas casuais de ações de defesa porque é mais diversificada. Isso pode ser um descuido. Em seus resultados do primeiro semestre do ano fiscal de 26, a Codan disse que sua empresa de comunicações projeta comunicações de missão crítica para os mercados globais de segurança pública e militar. A receita de comunicações aumentou 19% para A $221,8 milhões. A empresa também disse que a DTC gerou um forte crescimento da demanda de defesa e sistemas não tripulados, com a receita de sistemas não tripulados aumentando 68%, para A $73 milhões. Codan disse que cerca de metade dessa receita não tripulada estava vinculada a aplicações de defesa operacional em zonas de conflito.
É aqui que a história se torna mais matizada. Em uma cesta de ações de defesa da ASX, a Codan pode oferecer um perfil diferente, com menos sensibilidade pura às manchetes, maior diversificação operacional e exposição significativa a comunicações militares e sistemas não tripulados, sem ser um nome de tema único. Essa diversificação também pode significar que as ações nem sempre são negociadas como um nome de defesa puro.
A HighCom está no final especulativo desta lista e deve ser rotulada dessa forma. A empresa afirma que seus dois negócios contínuos são a HighCom Armor, que fornece proteção balística, e a HighCom Technology, que fornece e mantém sistemas aéreos não tripulados de pequeno e médio porte, sistemas aéreos contra-não tripulados e suporte relacionado de engenharia, integração, manutenção e logística para o ADF e outras forças armadas regionais alinhadas.
No primeiro semestre do ano fiscal de 26, a receita de operações contínuas caiu 59% para A $10,9 milhões, enquanto o EBITDA passou para uma perda de A $5,4 milhões em relação ao lucro de A $1,9 milhão no ano anterior. A HighCom também divulgou A $5,1 milhões em receita de tecnologia HighCom, incluindo A $3,5 milhões de peças de reposição para pequenos sistemas aéreos não tripulados (SUAS) e A $1,6 milhão de serviços de sustentação fornecidos ao Departamento de Defesa da Austrália.
Então, sim, a HighCom é uma das ações de defesa ASX mais sensíveis financeiramente no conselho. Mas também é o tipo de nome menor que pode mostrar como as compras se transformam em equipamentos de suporte, sustentação e proteção especializados.
Principais observações do mercado
Acompanhe os marcos do programa, não apenas as manchetes políticas. A adjudicação de contratos, o início da fabricação, os cronogramas de entrega e o trabalho de manutenção geralmente importam mais do que um único dia de anúncio.
Separe a exposição pura da exposição diversificada. O DroneShield e o EOS estão mais próximos de temas concentrados de tecnologia de defesa, enquanto o Codan traz exposição às comunicações em um mix de negócios mais amplo.
Assista aos temas de capacidade soberana na Austrália. A Austal e a EOS estão vinculadas à fabricação local, à integração e às cadeias de suprimentos australianas, o que apóia o tema mais amplo de capacidade soberana desse grupo.
Preste atenção aos balanços e à conversão de caixa. O ímpeto de compras pode ser real mesmo quando o tempo fica confuso. A última metade da HighCom é um lembrete disso.
As manchetes de defesa podem parecer imediatas. Os ganhos geralmente não são. O principal trabalho naval da Austal se estende até a próxima década. Os contratos EOS são entregues ao longo de vários anos. O fluxo de pedidos da DroneShield parece forte, mas a empresa ainda separa a receita comprometida de uma oportunidade mais ampla de pipeline. HighCom mostra o outro lado da moeda. A exposição à aquisição não se traduz automaticamente em uma execução financeira tranquila.
As referências a ações de defesa listadas na ASX são apenas informações gerais, não uma recomendação para comprar, vender ou manter qualquer título ou CFD. Essas ações podem ser altamente voláteis e sensíveis ao prazo do contrato, à política governamental, à geopolítica, ao risco de execução e às condições do mercado. Expectativas de backlog, pipeline e receita não são garantias de desempenho futuro.
Três bancos centrais estão decidindo as taxas simultaneamente, o petróleo Brent está oscilando em torno de USD 100 o barril e uma guerra no Oriente Médio está reescrevendo as perspectivas de inflação em tempo real. O que quer que aconteça nesta semana pode definir o tom dos mercados para o resto de 2026.
Fatos rápidos
O Banco da Reserva da Austrália (RBA) anuncia sua próxima decisão sobre a taxa de caixa na terça-feira, com os mercados agora precificando 66% de chance de um segundo aumento para 4,1%.
Alguns analistas alertaram que a guerra do Irã pode empurrar a inflação dos EUA para 3,5% até o final do ano e atrasar os cortes nas taxas do Fed até setembro, tornando o gráfico de pontos do FOMC desta semana o mais observado em anos.
O petróleo Brent está flertando com USD 100 o barril depois que o Irã lançou o que a mídia estatal descreveu como sua “operação mais intensa desde o início da guerra”.
RBA: A Austrália voltará a caminhar?
O RBA elevou a taxa de caixa pela primeira vez em dois anos para 3,85% em sua reunião de fevereiro, depois que a inflação aumentou materialmente no segundo semestre de 2025.
A questão agora é se ele se move novamente antes mesmo de ver a próxima impressão trimestral do IPC, que só deve ser divulgada em 29 de abril.
O vice-governador Andrew Hauser reconheceu antes da reunião que os formuladores de políticas enfrentam uma decisão genuinamente dividida, moldada por sinais econômicos conflitantes em casa e pela crescente instabilidade no exterior.
Atualmente, os mercados financeiros atribuem cerca de 66% de probabilidade a outro aumento, com um aumento de maio considerado praticamente certo, independentemente do que aconteça na segunda-feira.
Datas importantes
Decisão sobre a taxa de caixa do RBA: Terça-feira, 17 de março, 14h30 AEDT
Conferência de imprensa do governador Bullock: Terça-feira, 17 de março, 15:30 AEDT
Monitor
Qualquer referência de Bullock a novas subidas será provável em maio
FOMC: É provável que todos os olhos estejam voltados para o gráfico de pontos
O FOMC se reúne de 17 a 18 de março, com a declaração de política agendada para 14h ET em 18 de março e a coletiva de imprensa do presidente Jerome Powell às 14h30. O CME FedWatch mostra uma probabilidade de 99% de que o Fed mantenha taxas de 3,50% a 3,75%.
A ação real está no Resumo das Projeções Econômicas (SEP) e no gráfico de pontos. O ponto médio atual mostra um corte de 25 pontos base para 2026. Se passar para dois cortes, isso é dovish e otimista para ativos de risco. Se mudar para zero cortes ou adicionar um aumento da taxa à projeção, os mercados poderão reagir na outra direção.
Para complicar ainda mais as coisas, o mandato de Powell como presidente do Federal Reserve expira em 23 de maio de 2026. Kevin Warsh é o principal candidato para substituí-lo, visto como mais agressivo em política monetária. Qualquer comentário de Powell sobre essa transição poderia movimentar os mercados independentemente da decisão de taxa em si.
Data chave
Decisão de taxa do FOMC + Gráfico de SEP/ponto: Quinta-feira, 19 de março, 4:00 AEDT
Conferência de imprensa de Powell: Quinta-feira, 19 de março, 4h30 AEDT
Monitor
A linguagem de Powell sobre petróleo e inflação tarifária.
Reação de rendimento do Tesouro em 2 anos.
A reprecificação do CME FedWatch para qualquer mudança na probabilidade de redução de setembro.
Banco do Japão: um maior aperto pode ser antecipado
O BOJ se reúne de 18 a 19 de março, com a decisão prevista para quinta-feira de manhã, horário de Tóquio. A taxa de política atual está em 0,75% (uma alta de 30 anos), e a reunião de janeiro de 2026 resultou na suspensão de uma votação de 8 a 1.
O governador Ueda classificou a reunião de março como “ao vivo”, observando que o cronograma para um maior aperto poderia ser “antecipado” se as negociações salariais de primavera da Shunto produzirem resultados mais fortes do que o esperado.
Esses resultados devem começar a chegar durante a semana, tornando-os a contribuição crítica para a decisão do BOJ. Nomura espera que os aumentos salariais da Shunto em 2026 cheguem em torno de 5,0%, incluindo a antiguidade, com um crescimento do salário base de aproximadamente 3,4%. Se os resultados confirmarem essa trajetória, o argumento de uma alta em março se fortalece consideravelmente.
A complicação é o cenário global. O Japão importa cerca de 90% de suas necessidades de energia, e o petróleo em torno de USD 100 por barril está elevando os custos de importação e ameaçando aumentar a pressão inflacionária. Um aumento do BOJ em um choque global do petróleo seria uma medida excepcionalmente ousada.
A maioria dos participantes do mercado ainda deseja aguardar esta reunião, com abril ou julho vistos como o momento mais provável para o próximo movimento.
Data chave
Decisão sobre a taxa de política do BOJ (atualmente 0,75%): Quinta-feira, 19 de março, manhã AEDT
Monitor
Os resultados salariais de Shunto são o principal gatilho para um aumento em março.
Linguagem da conferência de imprensa de Ueda e orientação futura em abril e julho.
O petróleo Brent atingiu brevemente USD 119,50 por barril no início da semana, antes de cair 17% para menos de USD 80, depois se recuperando para USD 95 em sinais mistos de Washington sobre o Estreito de Ormuz.
Na quinta-feira, o Brent estava de volta com mais de USD 100 quando o Irã lançou novos ataques contra o transporte comercial e a liberação da reserva da AIE não trouxe alívio significativo.
No cenário em que um conflito mais longo inflige danos à infraestrutura de energia, analistas estimam que o IPC pode subir para 3,5% até o final de 2026, com os preços da gasolina se aproximando de USD 5 por galão no segundo trimestre.
Para esta semana, o petróleo atua como uma macro metavariável. Cada manchete geopolítica, sinal de cessar-fogo, ataque de petroleiro, liberação de reserva e comentário de Trump poderiam movimentar ações, títulos e moedas em tempo real.
Monitor
Qualquer retomada do fluxo de petroleiros do Estreito de Ormuz.
Os ataques dos EUA e Israel contra o Irã lançados em 28 de fevereiro fizeram com que o petróleo Brent passasse de USD 119 o barril, o ouro acima de USD 5.200 e ações de defesa para recordes históricos.
Nesse contexto, os investidores estão se concentrando em um pequeno grupo de nomes vinculados a commodities que podem permanecer sensíveis a novos movimentos em petróleo, GNL e ouro. A questão chave é se o choque se mostra sustentado ou se um cessar-fogo, a normalização do transporte marítimo ou uma ação política removem parte do prêmio de risco geopolítico.
1. ExxonMobil (NYSE: XOM)
A ExxonMobil tem sido uma das mais claras beneficiárias do aumento de preços. As ações atingiram um recorde de USD 159,60 no início de março e subiram aproximadamente 28% no acumulado do ano.
A empresa produz 4,7 milhões de barris de óleo equivalente por dia, tem um ponto de equilíbrio na Bacia do Permiano de cerca de USD 35/barril e está comprometida com USD 20 bilhões em recompras até 2026.
O Wells Fargo elevou sua meta de preço para USD 183 de USD 156 após a escalada, enquanto o consenso mais amplo dos analistas está em torno de USD 140 a $144. No entanto, a XOM já está negociando acima de muitas metas consensuais, e a interrupção de sua parceira de GNL, a QatarEnergy, representa um obstáculo operacional de curto prazo.
O que assistir
Se as interrupções do Ormuz persistem além de 4 a 6 semanas.
A liberação emergencial do estoque do G7 ou um cessar-fogo confiável podem reduzir o prêmio de risco de guerra.
Quaisquer ajustes nas metas de consenso dos analistas.
A Chevron atingiu uma nova alta de 52 semanas de USD 196,76 no início de março e aumentou aproximadamente 24% no acumulado do ano.
O ponto de equilíbrio do Brent da empresa para dividendos e despesas de capital é de cerca de USD 50/barril. Isso significa que, com os preços atuais do petróleo acima de USD 90, ele está gerando um fluxo de caixa livre significativo.
No entanto, a Chevron interrompeu temporariamente as operações em um campo de gás na costa de Israel após a atividade de mísseis na região, e desde então as ações recuaram mais de 1%, já que o conflito afeta diretamente suas operações.
O que assistir
Atualizações operacionais diretas dos ativos da Chevron no Oriente Médio e em Israel.
Quaisquer novas paradas que possam pesar na produção de curto prazo.
Participação de petróleo bruto acima de USD 90, o que mantém a Chevron gerando fluxo de caixa livre significativo.
3. Woodside Energy (ASX: WDS/NYSE: WDS)
Com o Catar interrompendo a produção após ataques de drones iranianos, compradores na Ásia e na Europa estão lutando por suprimentos alternativos. A Woodside, como uma das maiores produtoras e exportadoras de GNL da Austrália, está fora da zona de conflito e está bem posicionada para se beneficiar da demanda redirecionada.
Os analistas alertam que a substituição real leva tempo devido às restrições de envio e contrato, o que significa que o aumento do preço pode ser mais durável do que uma simples negociação à vista. Os preços do gás de referência europeu TTF subiram mais de 50% em uma semana, ampliando o ambiente de margem para produtores de GNL fora do Oriente Médio.
O que assistir
O ritmo e o cronograma de qualquer reinício da produção de GNL do Catar.
Se a QatarEnergy permanecer off-line por semanas, a Woodside poderá começar a recontratar compradores europeus a preços spot elevados.
Uma alta do dólar australiano pode ser um obstáculo que vale a pena acompanhar os ganhos denominados em USD.
4. Cheniere Energy (NYSE: GNL)
Juntamente com a Woodside, Cheniere é a beneficiária mais direta dos EUA da interrupção do GNL no Catar. Como maior exportador de GNL dos Estados Unidos, viu força intradiária no início da semana do conflito.
A produção doméstica de energia dos EUA protegeu os consumidores americanos do pior choque, mas o prêmio de exportação aumentou à medida que compradores europeus e asiáticos pagam pelo fornecimento fora do Golfo.
O comércio é “geopoliticamente sensível” e qualquer resolução pode reverter a vantagem rapidamente. Mas enquanto a infraestrutura de gás de Hormuz e do Golfo permanecer comprometida, Cheniere está posicionada para se beneficiar estruturalmente.
O que assistir
Qualquer avanço diplomático que reabra as rotas marítimas do Golfo.
Anúncios de novos contratos de aquisição de longo prazo assinados a preços elevados atuais.
O ouro subiu 5,2% em uma única sessão em 1º de março, atingindo USD 5.246/onça, à medida que os mercados buscavam ativos seguros. A Newmont, a maior produtora de ouro do mundo, viu suas reservas efetivamente reavaliadas a esses preços.
Ele está em alta junto com o ganho de 24% do ouro no acumulado do ano, e seus custos totais de sustentação permanecem praticamente fixos.
No entanto, as mineradoras de ouro se venderam drasticamente em 4 de março, e a Newmont caiu quase 8% em uma única sessão, à medida que uma desalavancagem mais ampla do risco atingiu as ações de metais preciosos.
As ações se recuperaram desde então, mas a volatilidade continua alta. Para investidores de longa duração, analistas observam que jurisdições de mineração “seguras”, como Canadá, Austrália e Nevada, estão cobrando novos prêmios à medida que a instabilidade no Oriente Médio aumenta o valor do fornecimento geopoliticamente seguro.
O que assistir
Se o ouro pode se manter acima de USD 5.000/onça.
Um conflito prolongado pode acelerar um ciclo de fusões e aquisições em mineradores de ouro juniores.
Um cessar-fogo ou um amplo evento de desalavancagem de ações como o principal risco a ser monitorado.
A Lockheed Martin atingiu um novo recorde histórico de USD 676,70 em 3 de março, um aumento de mais de 4% no dia. Seus caças F-35, munições guiadas com precisão, sistemas THAAD e artilharia de foguetes HIMARS são fundamentais para a campanha aérea em andamento.
O Departamento de Defesa dos EUA está se movendo para reabastecer os estoques de munições, e a ambição declarada de Trump de aumentar o orçamento de defesa dos EUA para USD 1,5 trilhão até 2027 acrescenta um vento favorável estrutural de longo prazo além do conflito imediato.
As ações de defesa estão subindo em meio aos preços clássicos de risco geopolítico, mas os investidores devem observar que o fluxo real de contratos leva tempo para se traduzir em lucros, e as avaliações já refletem um otimismo considerável.
O que assistir
O ritmo das ordens de reabastecimento de munições do Departamento de Defesa dos EUA.
A rapidez com que as vitórias de contratos se traduzem em crescimento da carteira de pedidos.
Barrick está acompanhando a corrida histórica do ouro ao lado da Newmont, com as ações subindo acentuadamente no acumulado do ano. Ela tem uma capitalização de mercado de aproximadamente USD 78 bilhões e está relatando projeções recordes de fluxo de caixa livre, já que seus custos totais de sustentação permanecem bem abaixo dos preços à vista atuais.
Como a Newmont, ela experimentou uma forte liquidação em uma única sessão de mais de 8% durante o evento mais amplo de desalavancagem de 4 de março, antes de se recuperar parcialmente.
Empresas de royalties e streaming, como a Wheaton Precious Metals (WPM), estão sendo preferidas por alguns investidores como uma forma mais protegida contra a inflação de acessar o ouro, dada sua menor exposição aos custos operacionais. Mas a Barrick continua sendo uma das maiores mineradoras de ouro listadas do mundo, com ganhos altamente sensíveis às mudanças no preço do ouro
O que assistir
A capacidade do ouro de se manter acima de USD 5.000/onça.
Qualquer Barrick avança em direção a aquisições de mineradores juniores.
Inflação dos custos de energia, já que o aumento dos preços dos combustíveis pode começar a reduzir as margens operacionais das mineradoras.