The United States used 30.28 trillion cubic feet of natural gas in 2021, making them the world’s largest consumer of natural gas. Natural gas consumption in the United States has two seasonal peaks, largely reflecting weather-related fluctuations in energy demand. One of the biggest consumptions of gas is industrial, residential and commercial cooling and heating systems (eia, 2022).
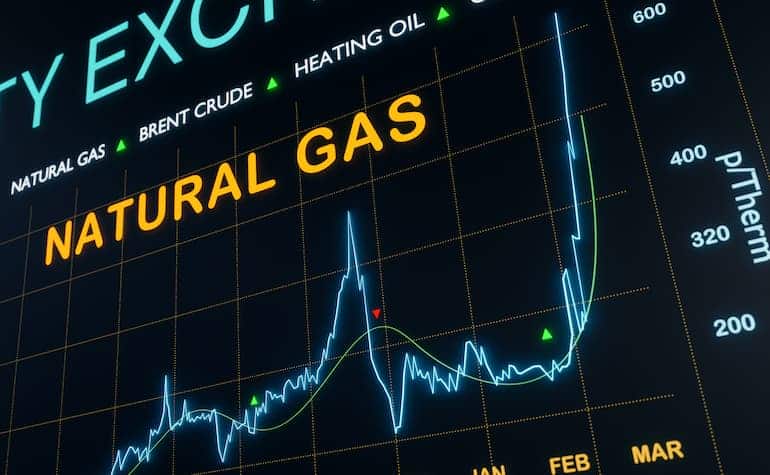
As the world’s largest user of natural gas transitions out of summer, will this change indicate a decrease of their natural gas consumption? Could the decrease in demand for cooling be reflected on the technical charts? On a daily timeframe, natural gas has been on a steady upward trend since the end of June, in tandem with the beginning of summer in the US (seen on the chart below).
A trendline from the beginning of that trend until now can be drawn, and we can see recently that line has been broken by a daily candlestick, closing below the trendline which can indicate a change in trend for natural gas. After the strong break below of the trendline followed by multiple bearish daily candlesticks, we can consequently expect further downside movement for natural gas, after breaking through a strong support at $8.4, in all probability with natural gas currently sitting at $7.895 we could see natural gas come down to the next support level around $7.57.
By
Mark Nguyen
Account Manager
The information provided is of general nature only and does not take into account your personal objectives, financial situations or needs. Before acting on any information provided, you should consider whether the information is suitable for you and your personal circumstances and if necessary, seek appropriate professional advice. All opinions, conclusions, forecasts or recommendations are reasonably held at the time of compilation but are subject to change without notice. Past performance is not an indication of future performance. Go Markets Pty Ltd, ABN 85 081 864 039, AFSL 254963 is a CFD issuer, and trading carries significant risks and is not suitable for everyone. You do not own or have any interest in the rights to the underlying assets. You should consider the appropriateness by reviewing our TMD, FSG, PDS and other CFD legal documents to ensure you understand the risks before you invest in CFDs. These documents are available here.
Venezuela commands the world's largest proven oil reserves at 303 billion (bn) barrels (bbl). Yet political turmoil, global sanctions, and recent US intervention show that being the biggest isn’t always best.
What does this mean for oil markets?
The concentration of reserves among Organization of the Petroleum Exporting Countries (OPEC) members (60% of the global total) gives the group ongoing influence on supply policy and market sentiment, even as US shale provides a production counterweight.
Venezuela's potential return as a major exporter post-US intervention could eventually ease supply constraints, though most analysts view significant production increases as years away.
Sanctions could create a situation where discounted crude seeks buyers willing to navigate compliance risks. Refiners with heavy crude processing capability may benefit from price differentials if Venezuelan barrels increase.
While reserves appear abundant, economically recoverable volumes depend on sustained high prices. If renewable adoption accelerates and demand peaks sooner than projected, stranded assets become a material risk for reserve-heavy producers.
Top 10 countries by proven oil reserves
1. Venezuela – 303 billion barrels
Controls 18% of global reserves, primarily extra-heavy crude in the Orinoco Belt requiring specialised refining.
Heavy crude typically trades $15-$20 below Brent benchmarks due to high sulphur content and complex processing requirements.
Output crashed by 60% from 2.5 million bpd in 2014 to less than 1 million barrels per day (BPD) last year.
Approximately 80% of exports flow to China as loan repayments, with export revenues dwarfed by reserve potential.
2. Saudi Arabia – 267 billion barrels
The majority of its light, sweet crude oil requires minimal refining and commands premium prices, contributing to world-leading exports of $191.1 bn in 2024.
Maintains 2-3 million bpd of spare production capacity, providing a stabilising buffer during supply disruptions.
Oil comprises roughly 50% of the country’s GDP and 70% of its export earnings.
Production decisions significantly impact international oil prices due to market dominance.
Heavy Western sanctions severely limit the country’s ability to monetise and access international markets.
Production estimates vary significantly (2.5-3.8 million bpd) due to sanctions, limited transparency, and restricted international reporting.
Significant crude volumes flow to China through discount arrangements and sanctions-evading mechanisms.
Sanctions relief could rapidly boost production toward 4-5 million bpd, though domestic consumption (12th globally) reduces export potential.
4. Canada – 163 billion barrels
Approximately 97% of reserves are oil sands (bitumen) requiring steam-assisted extraction and significant upfront capital investment.
Political stability and regulatory frameworks position Canada as a secure source compared to volatile producers, with direct pipeline access to US refineries.
Supplied over 60% of US crude oil imports in 2024, making Canada America's top source by far.
5. Iraq – 145 billion barrels
Decades of war and sanctions have prevented optimal field development and infrastructure modernisation.
Improved security conditions since 2017 have enabled production recovery, but pipeline attacks and ageing facilities continue to constrain output.
Oil revenue comprises over 90% of government income, creating extreme fiscal vulnerability.
Exports flow primarily to China, India, and Asian buyers seeking a reliable Middle Eastern supply, with most production from super-giant southern fields near Basra.
6. United Arab Emirates – 113 billion barrels
Produces primarily medium-to-light sweet crude commanding premium prices, ranking fourth globally in export value at $87.6 bn.
Has successfully diversified its economy through tourism, finance, and trade, reducing oil's GDP share compared to Gulf peers.
Strategic location near the Strait of Hormuz and openness to international oil companies help facilitate efficient global distribution.
7. Kuwait – 101.5 billion barrels
Reserves are concentrated in ageingsuper-giant fields like Burgan, which require enhanced recovery techniques.
Favourable geology enables extraction costs around $8-$10 per barrel, with proven reserves providing 80+ years of supply at current production rates.
Oil comprises 60% of GDP and over 95% of export revenue.
8. Russia – 80 billion barrels
The world's third-largest producer despite ranking eighth in reserves.
Post-2022, Western sanctions redirected crude flows from Europe to Asia, with China and India now absorbing the majority at discounted prices.
Despite export restrictions and G7 price cap at $60/barrel, it posted the second-highest global export value at $169.7 bn in 2024.
Russian Urals crude typically trades $15-30 below Brent due to quality, sanctions, and logistics, with November 2024 revenues declining to $11 bn.
9. United States – 74.4 billion barrels
The shale revolution through horizontal drilling and hydraulic fracturing has made the US the world's No.1 oil producer despite holding only the 9th-largest reserves.
The Permian Basin accounts for nearly 50% of production, with shale/tight oil representing 65% of total output.
Achieved net petroleum exporter status in 2020 for the first time since 1949, with crude exports growing from near-zero in 2015 to over 4 million bpd in 2024.
The US government maintains a strategic reserve of 375+ million barrels.
10. Libya – 48.4 billion barrels
Holds Africa's largest proven oil reserves at 48.4 bn barrels, producing light sweet crude commanding premium prices.
Rival bordering governments compete for oil revenue control, causing production to fluctuate based on political conditions.
Oil facilities face blockades, militia attacks, and political leverage tactics, preventing consistent returns.
Favourable geology enables extraction costs around $10-15 per barrel, with geographic proximity making Libya a natural supplier to European refineries.
You can trade Oil and other Commodity CFDs, including metals, energies, and agricultural products, on GO Markets.
FX markets enter the month influenced by uncertain growth momentum, inflation dynamics and central bank policy, yield sensitivity, and shifts in how markets are pricing geopolitical risk.
Quick facts:
USD remains primarily responsive to inflation data, and this may have overtaken growth as the main driver.
JPY sensitivity to potential Bank of Japan (BOJ) action remains high, creating asymmetric responses to global rate moves and policy communication.
EUR and AUD continue to trade reactively to global events and commodity price moves.
Volatility may be episodic, clustering around key data releases rather than a single sustained directional trend.
With central bank expectations still evolving into the first quarter (Q1), key releases and policy communication are likely to stay central to near-term FX pricing. In this environment, moves may cluster around scheduled events and headline risk, rather than build into a single dominant trend.
USD performance remains closely tied to inflation data and what it could mean for Federal Reserve policy expectations. Market pricing can shift quickly around CPI and labour-market outcomes, particularly where outcomes affect how investors perceive the timing and pace of any policy changes.
Jobs data and GDP numbers will be watched as gauges of growth momentum. The start of the US earnings season may also influence FX indirectly through its impact on equity performance, risk sentiment, and yield expectations, rather than acting as a direct currency driver.
Key chart: US dollar index (DXY) weekly chart
Periods of market uncertainty can support USD demand around prior support areas near 97, while the 100 region may continue to act as a reference point for resistance, including where it aligns with commonly watched moving averages (noting technical indicators can fail).
A break in either direction may reflect shifting expectations about how different central banks will respond to the next run of inflation and growth data.
Euro (EUR)
Key data and events:
CPI (Euro area HICP, Dec 2025 reference period): 19 January 2026 European Central Bank
European Central Bank (ECB) messaging on policy direction and inflation remains key. A prolonged hold is one scenario market participants continue to debate, but outcomes are likely to remain data-dependent and sensitive to changes in the growth and inflation backdrop.
The geopolitical situation in Ukraine will also remain in focus.
Key chart: EUR/USD weekly chart
Differences in likely central bank direction could support a test of the top end of the current multi-month range near 1.18. A sustained break above that level would be technically significant.
For now, price may stay range-bound until there is clearer guidance on policy direction on both sides of the Atlantic.
Japanese yen (JPY)
Key data and events:
BOJ policy decision: 22–23 January 2026 Bank of Japan
Tokyo core CPI (Ku-area of Tokyo, preliminary; Dec 2025 reference month): 23 January 2026 Statistics Bureau of Japan
What to watch:
Following the BOJ’s December rate rise, markets appear to be weighing the likelihood of further action in Q1. Whether the January meeting delivers another move remains uncertain and may depend on incoming inflation and wage signals, as well as BOJ communication.
Data released ahead of the decision may be important in shaping expectations.
Key chart: GBP/JPY daily chart
As of 7 January 2026, GBPJPY has traded around the 211.50 area, near levels last seen in 2008. Continued consolidation may suggest fresh drivers are needed to extend gains.
If the cross can’t push higher, some traders will start watching for a pullback toward 210.00, where support has shown up before. And if expectations for BOJ action build, selling could accelerate, with price potentially drifting down through those previously tested support zones and toward the more established support near 208.00.
RBA rate decision: 3 February 2026 (Monetary Policy Board meeting 2–3 February) Reserve Bank of Australia
AUD continues to behave as a proxy for global growth sentiment and commodity demand.
Stabilisation in Chinese data, firmer commodity prices, and expectations around the Reserve Bank of Australia (RBA) policy path may be providing relative support for AUD. Sensitivity to broader risk conditions remains high.
Key chart: EUR/AUD daily chart
Moves in commodity prices have coincided with a sharp fall in EURAUD since the 31 December close, breaking down out of the prior range. The next key level to the downside sits at 1.7305.
The area around 1.7305 may help indicate whether selling pressure is continuing or whether momentum is fading for now. Near-term commodity price moves are likely to remain important.
Bottom line
FX conditions this month may remain reactive, with volatility clustering around key data releases rather than a sustained directional trend. With Q1 central bank expectations still forming, price moves may be sharper around the calendar, policy communication, and geopolitical headlines.
Asia starts the week with a fresh geopolitical shock that is already being framed in oil terms, not just security terms. The first-order move may be a repricing of risk premia and volatility across energy and macro, while markets wait to see whether this becomes a durable physical disruption or a fast-fading headline premium.
At a glance
What happened: US officials said the US carried out “Operation Absolute Resolve”, including strikes around Caracas, and that Venezuela’s President Nicolás Maduro and his wife were taken into US custody and flown to the United States (subject to ongoing verification against the cited reporting).
What markets may focus on now: Headline-driven risk premia and volatility, especially in products and heavy-crude-sensitive spreads, rather than a clean “missing barrels” shock.
What is not happening yet: Early pricing has so far looked more like a headline risk premium than a confirmed physical supply shock, though this can change quickly, with analysts pointing to ample global supply as a possible cap on sustained upside.
Next 24 to 72 hours: Market participants are likely to focus on the shape of the oil “quarantine”, the UN track, and whether this stays “one and done” or becomes open-ended.
Australia and Asia hook: AUD as a risk barometer, Asia refinery margins in diesel and heavy, and shipping and insurance where the price can show up in friction before it shows up in benchmarks.
What happened, facts fast
Before anyone had time to workshop the talking points, there were strikes, there was a raid, and there was a custody transfer. US officials say the operation culminated in Maduro and his wife being flown to the United States, where court proceedings are expected.
Then came the line that turned a foreign policy story into a markets story. President Trump publicly suggested the US would “run” Venezuela for now, explicitly tying the mission to oil.
Almost immediately after that came a message-discipline correction. Secretary of State Marco Rubio said the US would not govern Venezuela day to day, but would press for changes through an oil “quarantine” or blockade.
That tension, between maximalist presidential rhetoric and a more bureaucratically describable “quarantine”, is where the uncertainty lives. Uncertainty is what gets priced first.
Source: Adobe images
Why this is price relevant now
What’s new versus known for positioning
What’s new, and price relevant, is that the scale and outcome are not incremental. A major military operation, a claimed removal of Venezuela’s leadership from the country, and a US-led custody transfer are not the sort of things markets can safely treat as noise.
Second, the oil framing is explicit. Even if you assume the language gets sanded down later, the stated lever is petroleum. Flows, enforcement, and pressure via exports.
Third, the embargo is not just a talking point anymore. Reporting says PDVSA has begun asking some joint ventures to cut output because exports have been halted and storage is tightening, with heavy-crude and diluent constraints featuring prominently.
What’s still unknown, and where volatility comes from
Key unknowns include how strict enforcement is on water, what exemptions look like in practice, how stable the on-the-ground situation is, and which countries recognise what comes next. Those are not philosophical questions. Those are the inputs for whether this is a temporary risk premium or a durable regime shift.
Political and legal reaction, why this drives tail risk
The fastest way to understand the tail here is to watch who calls this illegal, and who calls it effective, then ask what those camps can actually do.
Internationally, reaction has been fast, with emphasis on international law and the UN Charter from key partners, and UN processes in view. In the US, lawmakers and commentators have begun debating the legal basis, including questions of authority and war powers. That matters for markets because it helps define whether this is a finite operation with an aftershock, or the opening chapter of a rolling policy regime that keeps generating headlines.
Market mechanism, the core “so what”
Here’s the key thing about oil shocks. Sometimes the headline is the shock. Sometimes the plumbing is the shock.
Venezuela’s heavy-crude system: Orinoco production, key pipelines, and export/refining bottlenecks.
Volumes and cushion
Venezuela is not the world’s swing producer. Its production is meaningful at the margin, but not enough by itself to imply “the world runs out of oil tomorrow”. The risk is not just volume. It is duration, disruption, and friction.
The market’s mental brake is spare capacity and the broader supply backdrop. Reporting over the weekend pointed to ample global supply as a likely cap on sustained gains, even as prices respond to risk.
Quality and transmission
Venezuela’s barrels are disproportionately extra heavy, and extra heavy crude is not just “oil”. It is oil that often needs diluent or condensate to move and process. That is exactly the kind of constraint that shows up as grade-specific tightness and product effects.
Reporting has highlighted diluent constraints and storage pressure as exports stall. Translation: even if Brent stays relatively civil, watch cracks, diesel and distillates, and any signals that “heavy substitution” is getting expensive.
Heavy-light spread as a stress gauge: rising differentials can signal costly substitution and tighter heavy supply.
Products transmission, volatility first, pump later
If crude is the headline, products are the receipt, because products tell you what refiners can actually do with the crude they can actually get. The short-run pattern is usually: futures reprice risk fast, implied volatility pops; physical flows adapt more slowly; retail follows with a lag, and often with less drama than the first weekend of commentary promised.
For Australia and Asia desks, the bigger point is transmission. Energy moves can influence inflation expectations, which can feed into rates pricing and the dollar, and in turn affect Asia FX and broader risk, though the links are not mechanical and can vary by regime.
Some market participants also monitor refined-product benchmarks, including gasoline contracts such as reformulated gasoline blendstock, as part of that chain rather than as a stand-alone signal.
Historical context, the two patterns that matter
Two patterns matter more than any single episode.
Pattern A: scare premium. Big headline, limited lasting outage. A spike, then a fade as the market decides the plumbing still works.
Pattern B: structural. Real barrels are lost or restrictions lock in; the forward curve reprices; the premium migrates from front-month drama to whole-curve reality.
One commonly observed pattern is that when it is only premium, volatility tends to spike more than price. When it is structural, levels and time spreads move more durably.
The three possible market reactions
Contained, rhetorical: quarantine exists but porous; diplomacy churns; no second-wave actions. Premium bleeds out; volatility mean-reverts.
Escalation, prolonged control risk: “not governing” language loses credibility; repeated operations; allies fracture further. Longer-duration premium; broader risk-off impulse across FX and rates.
Australia and Asia angle
For Sydney, Singapore, and Hong Kong screens, this is less about Venezuelan retail politics and more about how a Western Hemisphere intervention bleeds into Asia pricing.
AUD is the quick and dirty risk proxy. Asia refiners care about the kind of oil and the friction cost. Heavy crude plus diluent dependency makes substitution non-trivial. If enforcement looks aggressive, the “price” can show up in freight, insurance, and spreads before it shows up in headline Brent.
Catalyst calendar, key developments markets may monitor
US policy detail: quarantine rules, enforcement posture, exemptions.
UN and allies: statements that signal whether this becomes a long legitimacy fight.
Markets move into the week ahead with inflation data across Australia and Japan, alongside elevated geopolitical tensions that continue to influence energy prices and broader risk sentiment.
Australia Consumer Price Index (CPI): Inflation data may influence the Reserve Bank of Australia (RBA) policy path, with the Australian dollar (AUD) and local yields sensitive to any surprise.
Japan data cluster: Tokyo CPI (preliminary) plus industrial production and retail sales provide an inflation-and-activity pulse that could shape Bank of Japan (BoJ) normalisation expectations.
Eurozone & Germany CPI: Flash inflation readings will test the disinflation narrative and influence ECB rate-cut timing expectations.
Oil and geopolitics: Brent crude has posted its highest close in around six months amid renewed Middle East tensions, reinforcing energy-driven inflation risk.
Australia CPI: RBA expectations to change?
Australia’s upcoming CPI release will be closely watched for signals on whether inflation is stabilising or proving more persistent than expected.
A stronger-than-expected print could be associated with higher yields and a firmer AUD as rate expectations adjust. A softer outcome could support expectations for a steadier policy stance.
Key dates
Inflation Rate (MoM): 11:30 am Wednesday, 25 February (AEDT)
Japan’s late-week releases combine Tokyo CPI (preliminary) with industrial production and retail sales, offering a broader read on price pressures and domestic demand.
Tokyo CPI is often watched as a timely signal for national inflation dynamics and BoJ debate. Industrial output and retail spending add context on activity.
Surprises across this cluster can drive sharp moves in the JPY, particularly if results shift perceptions around the pace and persistence of BoJ normalisation.
Key dates
Tokyo CPI: 10:30 am Friday, 27 February (AEDT)
Industrial Production: 10:50 am Friday, 27 February (AEDT)
Retail Sales: 10:50 am Friday, 27 February (AEDT)
Monitor
JPY sensitivity to inflation surprises
Bond yield moves in response to activity data
Equity reactions if growth momentum expectations shift
Energy and safe-haven flows
Oil prices have climbed to their highest close in around six months amid renewed Middle East tensions.
Recent reporting on heightened regional military activity and shipping-risk headlines near the Strait of Hormuz has reinforced energy security as a market focus. The Strait of Hormuz remains a widely watched chokepoint for global energy flows.
Higher oil prices can feed into inflation expectations and influence bond yields. At the same time, geopolitical uncertainty can support the USD through safe-haven demand and relative rate positioning.
Flash inflation readings from Germany and the broader eurozone (HICP) will test whether the region’s disinflation trend remains intact.
Germany’s release can influence expectations ahead of the aggregated eurozone figure. If core inflation proves sticky, expectations around the timing and pace of potential European Central Bank easing could shift.
Key dates
Germany Inflation Rate: 12:00 am Saturday, 28 February (AEDT)
From tech disruptors to defence contractors, some of the market's most talked-about companies start their public journey through an initial public offering (IPO). For traders, these initial public listings can represent a unique trading environment, but also a period of heightened uncertainty.
Quick facts
An IPO is when a private company lists its shares on a public stock exchange for the first time.
IPOs can offer traders early access to high-growth companies, but come with elevated volatility and limited price history.
Once listed, traders can gain exposure to IPO stocks through direct share purchases or derivatives such as contracts for difference (CFDs).
What is an initial public offering (IPO)?
An IPO is when a company offers its shares to the public for the first time.
Before performing an IPO, shares in the company are typically only held by founders, early employees, and private investors. Going public makes the shares available to be purchased by anyone.
Depending on the size of the company, it will usually list its public shares on the local stock exchange (for example, the ASX in Australia). However, some large-valuation companies choose to only list on a global stock exchange, like the Nasdaq, no matter where their main headquarters is located.
For traders, IPOs are generally the first opportunity to gain exposure to a company’s stock. They can create a unique environment with increased volatility and liquidity, but also carry heightened risk, given the limited price history and sensitivity to sentiment swings.
Why do companies go public?
The biggest driver to perform an IPO is to access more capital. Listing on a public exchange means the company can raise significant funds by selling shares.
It also provides liquidity for existing shareholders. Founders, early employees, and private investors often sell a portion of their existing holdings on the open market, realising the returns on their years of support.
Beyond the monetary benefits, going public means companies can use their stock as currency for acquisitions and offer equity-based compensation to attract talent. And a public valuation provides a transparent benchmark, which is useful for strategic positioning and future fundraising.
However, it does come with trade-offs. Public companies must comply with ongoing disclosure and reporting obligations, and pressure from public shareholders can become a barrier to long-term progress if many are focused on short-term performance.
While the specifics vary by jurisdiction, going from a private company to a public listing generally involves the following stages:
1. Preparation
The company first selects the underwriter (typically an investment bank) to manage the offering. Together, they assess the company's financials, corporate structure, and market positioning to determine the best approach for going public. It is the heavy planning stage to make sure the company is actually ready to go public.
2. Registration
Once everything is prepared, the underwriters conduct a thorough due diligence check and then lodge the required disclosure documents with the relevant regulator. These documents give a detailed disclosure to the regulator about the company, its management, and its proposed offering. In Australia, this is typically a prospectus lodged with ASIC; in the US, a registration statement filed with the SEC.
3. Roadshow
Executives at the company and underwriters will then present the investment case to institutional investors and market analysts in a “roadshow”. This showcase is designed to gauge demand for the stock and help generate interest. Institutional investors can register their interest and valuation of the IPO, which helps inform the initial pricing.
4. Pricing
Based on feedback from the roadshow and current market conditions, the underwriters set the final share price and determine the number of shares to be issued. Shares are allocated on the ‘primary market’ to investors participating in the offer (before the stock is listed publicly on the secondary market). This process sets the pre-market price, which effectively determines the company’s initial public valuation.
5. Listing
On listing day, the company’s shares begin trading on the chosen stock exchange, officially opening the secondary market. For most traders, this is the first point at which they can trade the stock, either directly or through derivatives such as Share CFDs.
6. Post-IPO
Once listed, the company becomes subject to strict reporting and disclosure requirements. It must communicate regularly with shareholders, publish its financial results, and comply with the governance standards of the exchange on which it is listed.
IPO risks and benefits for traders
How do traders participate in IPOs?
For most traders, participating in an IPO comes once shares have listed and begun trading on the secondary market.
Once shares are live on the exchange, investors can buy the physical shares directly through a broker or online exchange, or they can use derivatives such as Share CFDs to take a position on the price without owning the underlying asset.
The first few days of IPO trading tend to be highly volatile. Traders should ensure they have taken appropriate risk management measures to help safeguard against potential sharp price swings.
The bottom line
IPOs mark when a company becomes investable to the public. They can offer early access to high-growth companies and create a unique trading environment driven by elevated volatility and market interest.
For traders, understanding how the process works, what drives pricing and post-IPO performance, and how to weigh potential rewards against the risks of trading newly listed shares is essential before taking a position.
2026 is not giving investors much breathing room. It seems markets may have largely moved past the idea that rate cuts are just around the corner and into a year where inflation may prove harder to control than many expected.
Goods inflation has picked up, while services inflation remains relatively sticky due to ongoing labour cost pressures. Housing costs, particularly rents, also remain a key source of inflation pressure.
The RBA is trying to stay credible on inflation without pushing the economy too far the other way.
Key data
CPI is still around 3.8 per cent (above target), wages are still rising at about 0.8 per cent over the quarter, and unemployment is around 4.1 per cent.
Based on market-implied pricing, rate hikes are not expected soon, so the way the RBA explains its decision can matter almost as much as the decision itself. If the tone shifts expectations, those expectations can move markets.
What this playbook covers
This is a playbook for RBA-heavy weeks in 2026. It covers what to watch across sectors, lists the key triggers, and explains which indicators may shift sentiment.
1. Banks and financials: how RBA decisions flow through to lending and borrowers
Banks are where the RBA shows up fastest in the Australian economy. Rates can hit borrowers quickly and feed into funding costs and sentiment.
In tighter phases, margins can improve at first, but that can flip if funding costs rise faster, or if credit quality starts to weaken. The balance between those forces is what matters most.
If banks rally into an RBA decision week, it may mean the market thinks higher for longer supports earnings. If they sell off, it may mean the market thinks higher for longer hurts borrowers. You can get two different readings from the same headline.
What to watch
The yield curve shape: A steeper curve can help margins, while an inverted curve can signal growth stress.
Deposit competition: It can quietly squeeze margins even when headline rates look supportive.
RBA wording on financial stability, household buffers, and resilience. Small phrases can shift the risk story.
Potential trigger
If the RBA sounds more hawkish than expected, banks may react early as markets reassess growth and credit risk expectations. The first move can sometimes set the tone for the session.
Key risks
Funding costs rising faster than loan yields: May point to margin pressure.
Clear tightening in credit conditions: Rising arrears or refinancing stress can change the narrative quickly.
Financials are the biggest sector in the S&P/ASX 200 index | S&P Global
2. Consumer discretionary and retail: where higher rates hit household spending
When policy is tight, consumer discretionary becomes a live test of household resilience. This is where higher everyday costs often show up fastest.
Big calls about the consumer can look obvious until the data stops backing them up. When that happens, the narrative can shift quickly.
What to watch
Wages versus inflation: The real income push or drag.
Early labour signals: Hours worked can soften before unemployment rises.
Reporting season clues: Discounting, cost pass-through, and margin pressure can indicate how stretched demand really is.
Potential trigger
If the tone from the RBA is more hawkish than expected, the sector may be sensitive to rate expectations. Any initial move may not persist, and subsequent price action can depend on incoming data and positioning
Key risks
A fast turn in the labour market.
New cost-of-living shocks, especially energy or housing, that hit spending quickly.
3. Resources: what to watch when tariffs, geopolitics, and policy shift
Resources can act as a read on global growth, but currency moves and central bank tone can change how that story lands in Australia.
In 2026, tariffs and geopolitics could also create sharper headline moves than usual, so gap risk can sit on top of the normal cycle.
The RBA still matters through two channels: the Australian dollar and overall risk appetite. Both can reprice the sector quickly, even when commodity prices have not moved much.
What to watch
The global growth pulse: Industrial demand expectations and China-linked signals.
The Australian dollar: The post-decision move can become a second driver for the sector.
Sector leadership: How resources trade versus the broader market can signal the current regime.
Potential trigger
If the RBA tone turns more restrictive while global growth stays stable, resources may hold up better than other parts of the market. Strong cash flows can matter more, and the real asset angle can attract buyers.
Key risks
In a real stress event, correlations can jump, and defensive positioning can fail.
If policy tightens into a growth scare, the cycle can take over, and the sector can fade quickly.
Materials (resources) have outperformed other ASX sectors YoY | Market Index
4. Defensives, staples, and quality healthcare
Defensives are meant to be the calmer corner of the market when everything else feels messy. In 2026, they still have one big weakness: discount rates.
Quality defensives can draw inflows when growth looks shaky, but some defensive growth stocks still trade like long-duration assets. They can be hit when yields rise, even if the business looks solid. That means earnings may be steady while valuations still move around.
What to watch
Relative strength: How defensives perform during RBA weeks versus the broader market.
Guidance language: Comments on cost pressure, pricing power, and whether volumes are holding up.
Yield behaviour: Rising yields can overpower the quality bid and push multiples down.
Potential trigger
If the RBA sounds hawkish and cyclicals start to wobble, defensives can attract relative inflows, but that can depend on yields staying contained. If yields rise sharply, long-duration defensives can still de-rate.
Key risks
Cost inflation that squeezes margins and weakens the defensive story.
Healthcare has underperformed vs S&P/ASX 200 since the end of the pandemic | Market Index
5. Hard assets, gold, and gold equities
In 2026, hard assets may be less about the simple inflation-hedge story and more about tail risk and policy uncertainty.
When confidence weakens, hard assets often receive more attention. They are not driven by one factor, and gold can still fall if the main drivers run against it.
What to watch
Real yield direction: Shapes the opportunity cost of holding gold.
US dollar direction: A major pricing channel for gold.
Gold equities versus spot gold: Miners add operating leverage, and they also add cost risk.
Potential trigger
If the market starts to question inflation control or policy credibility, the hard-asset narrative can strengthen. If the RBA stays restrictive while disinflation continues, gold can lose urgency, and money can rotate into other trades.
Key risks
Real yields rising significantly, which can pressure gold.
Crowding and positioning unwinds that can cause sharp pullbacks.
S&P/ASX All Ordinaries Gold vs Spot Gold (XAUUSD) 5Y-chart | TradingView
6. Market plumbing, FX, rates volatility, and dispersion
In some RBA weeks, the first move shows up in rates and the Australian dollar, and equities follow later through sector rotation rather than a clean index move.
When guidance shifts, the RBA can change how markets move together. You can end up with a flat index while sectors swing hard in opposite directions.
What to watch
Front-end rates: Repricing speed right after the decision can reveal the real surprise.
AUD reaction: Direction and follow-through often shape the next move in equities and resources.
Implied versus realised volatility: Can show whether the market paid too much or too little for the event.
Options skew: Can reflect demand for downside protection versus upside chasing.
Early tape behaviour: The first 5 to 15 minutes can be messy and can mean-revert.
Potential trigger
If the decision is expected but the statement leans hawkish, the front end may reprice first, and the AUD can move with it. Realised volatility can still jump even if the index barely moves, as the market rewrites the path and rotates positions under the surface.
Key risks
A true surprise that overwhelms what options implied and creates gap moves.
Competing macro headlines that dominate the tape and drown out the RBA signal.
Thin liquidity that creates false signals, whipsaw, and worse execution than models assume.
Australian interest rate and exchange rate volatility 1970-2020 | RBA
7. Theme baskets
Theme baskets may let traders express a macro regime while reducing single-name risk. They also introduce their own risks, especially around events.
What to watch
What the basket holds: Methodology, rebalance rules, hidden concentration.
Liquidity and spreads: Especially around event windows.
Tracking versus the narrative: Whether the “theme” behaves like the macro driver.
Potential trigger
If RBA language reinforces a “restrictive and uncertain” regime, theme baskets tied to value, quality, or hard assets may attract attention, particularly if broad indices get choppy.
Key risks
Theme reversal when macro expectations shift.
Liquidity risk around event windows, where spreads can widen materially.
The point of this playbook is not to predict the exact headline; it is to know where the second-order effects usually land, and to have a short checklist ready before the decision hits.
Keeping these triggers and risks in view may help some traders structure their monitoring around RBA decisions throughout 2026.
FAQs
Why does “tone” matter so much in 2026?
Because markets often pre-price the decision. The incremental information is guidance on whether the RBA sounds comfortable, concerned, or open to moving again.
What are the fastest tells right after a decision?
Some traders look to front-end rates, the AUD, and sector leadership as early indicators, but these signals can be noisy and influenced by positioning and liquidity.
Why are REITs called duration trades?
Because a large part of their valuation can be sensitive to discount rates and funding costs. When yields move, valuations can reprice quickly.
Are defensives always safer around the RBA?
Not always. If yields jump, long-duration defensives can still be repriced lower even with stable earnings.
Why do hard assets keep showing up in 2026 narratives?
Because they can act as a hedge when trust in policy credibility wobbles, but they also carry crowding and real-yield risks.