Expected earnings date: Wednesday, 28 January 2026 (US, after market close) / early Thursday, 29 January 2026 (AEDT)
Key areas in focus
The Tesla earnings release can act as a barometer for both global EV demand and capital-intensive innovation across automation and energy systems.
Vehicle deliveries and margins are likely to be the primary near-term drivers of sentiment. Investors will also be watching updates across adjacent initiatives that may influence longer-term growth expectations.
Autonomy and software (FSD)
Tesla’s “Full Self-Driving” (FSD) is a branded advanced driver-assistance feature sold in some markets and requires active driver supervision; availability and capabilities vary by jurisdiction.
Further rollout and any expansion of autonomy-linked services remain subject to regulatory approvals and continued evolution of the underlying technology.
Energy generation and storage
Solar, Powerwall and Megapack remain a key focus, particularly given the segment’s recent growth contribution.
Robotics (Optimus)
Optimus remains early stage, with no disclosed revenue contribution to date. It may become more relevant to Tesla’s longer-term AI and automation aspirations.
Expectations remain delicately balanced between near-term margin pressure, the impact of demand and interest rate movements, and longer-term product and platform developments.
What happened last quarter?
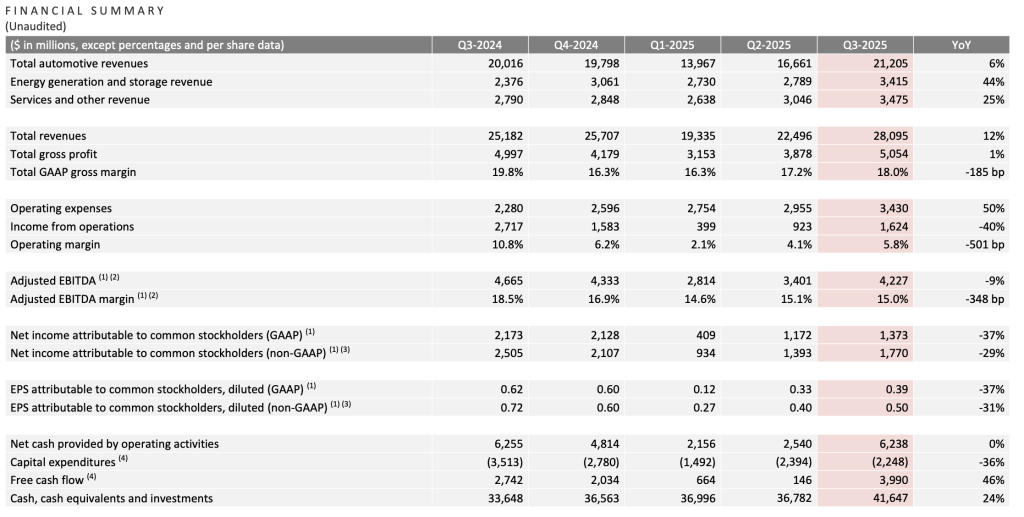
In Q3 2025 (September quarter), Tesla reported mixed results versus consensus expectations. Revenue and deliveries reached record levels, while earnings and margins remained under pressure amid pricing and cost dynamics.
Tesla said it was navigating a challenging pricing environment while continuing to invest for long-term growth (as referenced in the shareholder communications cited below).
Last earnings key highlights
Revenue: ~US$28.1 billion
Earnings per share (EPS): ~US$0.50 (non-GAAP, diluted)
Total GAAP gross margin: ~18.0%;
Operating margin: ~5.8%
Free cash flow (FCF): ~US$4.0 billion
Vehicle deliveries: ~497,099 units, up ~7% year on year (YoY)
How did the market react last time?
Tesla shares were volatile in after-hours trading, with attention focused on margins relative to revenue.
Tesla Q3 2025 financial summary
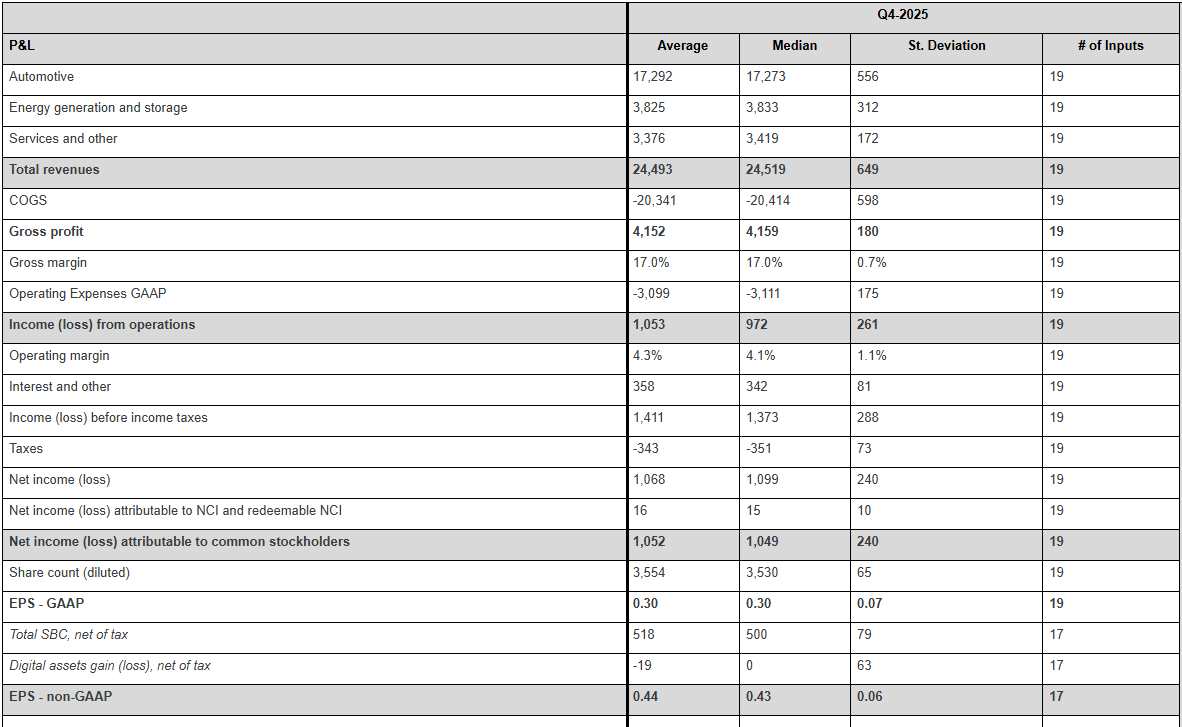
What’s expected this quarter?
As of mid-January 2026, third-party consensus estimates (Bloomberg) indicated continued focus on revenue growth alongside profitability and margin resilience. These are third-party estimates, not company guidance, and can change.
Key consensus reference points include:
Revenue: market expectations ~US$27 billion to US$28 billion
EPS: consensus clustered near US$0.55 to US$0.60 (adjusted)
Deliveries: market estimates ~510,000 to 520,000 vehicles
Margins: focus on whether automotive gross margin stabilises near recent levels or trends lower
Capital expenditure (capex): focus on spending discipline and efficiency rather than acceleration
*All above points observed as of 16 January 2026.
Key areas markets often focus on include:
Profit margin trajectory, and whether cost efficiencies are offsetting pricing pressure
Delivery volumes relative to consensus expectations
Pricing strategy and evidence of demand elasticity across regions
Capex and implications for future FCF
Progress in energy storage and non-automotive revenue streams
Commentary on AI, autonomy and longer-term investment priorities
Tesla Q4 2025 earnings estimates
Expectations
Market sentiment could be described as cautiously optimistic, with investors weighing revenue momentum against margin concerns.
Price has pulled back into a range following a brief test of recent highs in December. Given the recent range-bound price action, deviations from consensus across key earnings metrics may prompt a larger move in either direction.
Listed options were pricing an indicative move of around ±5.5% based on near-dated options expiring after 28 January and an at-the-money (ATM) options-implied expected move estimate.
Implied volatility (IV) was about 47.7% annualised into the event, as observed on Barchart at 11:30 am AEDT on 16 January 2026 (local time of observation).
These are market-implied estimates and may change. Actual post-earnings moves can be larger or smaller.
What this means for Australian traders
Tesla’s earnings may influence near-term sentiment across US growth and technology indices, with potential flow-through to broader risk appetite.
For Australian markets, any read-through is often framed through supply chain sensitivity. Market participants may look to related sectors such as lithium and rare earth producers linked to EV inputs are one potential channel, alongside broader sentiment impacts from Tesla’s innovation commentary.
Important risk note
Immediately after the US close and into the early Asia session, Nasdaq 100 (NDX) futures and related CFD pricing can reflect thinner liquidity, wider spreads, and sharper repricing around new information.
Such an environment can increase gap risk and execution uncertainty relative to regular-hours conditions.
By
Mike Smith
Mike Smith (MSc, PGdipEd)
Client Education and Training
The information provided is of general nature only and does not take into account your personal objectives, financial situations or needs. Before acting on any information provided, you should consider whether the information is suitable for you and your personal circumstances and if necessary, seek appropriate professional advice. All opinions, conclusions, forecasts or recommendations are reasonably held at the time of compilation but are subject to change without notice. Past performance is not an indication of future performance. Go Markets Pty Ltd, ABN 85 081 864 039, AFSL 254963 is a CFD issuer, and trading carries significant risks and is not suitable for everyone. You do not own or have any interest in the rights to the underlying assets. You should consider the appropriateness by reviewing our TMD, FSG, PDS and other CFD legal documents to ensure you understand the risks before you invest in CFDs. These documents are available here.
2026 is not giving investors much breathing room. It seems markets may have largely moved past the idea that rate cuts are just around the corner and into a year where inflation may prove harder to control than many expected.
Goods inflation has picked up, while services inflation remains relatively sticky due to ongoing labour cost pressures. Housing costs, particularly rents, also remain a key source of inflation pressure.
The RBA is trying to stay credible on inflation without pushing the economy too far the other way.
Key data
CPI is still around 3.8 per cent (above target), wages are still rising at about 0.8 per cent over the quarter, and unemployment is around 4.1 per cent.
Based on market-implied pricing, rate hikes are not expected soon, so the way the RBA explains its decision can matter almost as much as the decision itself. If the tone shifts expectations, those expectations can move markets.
What this playbook covers
This is a playbook for RBA-heavy weeks in 2026. It covers what to watch across sectors, lists the key triggers, and explains which indicators may shift sentiment.
1. Banks and financials: how RBA decisions flow through to lending and borrowers
Banks are where the RBA shows up fastest in the Australian economy. Rates can hit borrowers quickly and feed into funding costs and sentiment.
In tighter phases, margins can improve at first, but that can flip if funding costs rise faster, or if credit quality starts to weaken. The balance between those forces is what matters most.
If banks rally into an RBA decision week, it may mean the market thinks higher for longer supports earnings. If they sell off, it may mean the market thinks higher for longer hurts borrowers. You can get two different readings from the same headline.
What to watch
The yield curve shape: A steeper curve can help margins, while an inverted curve can signal growth stress.
Deposit competition: It can quietly squeeze margins even when headline rates look supportive.
RBA wording on financial stability, household buffers, and resilience. Small phrases can shift the risk story.
Potential trigger
If the RBA sounds more hawkish than expected, banks may react early as markets reassess growth and credit risk expectations. The first move can sometimes set the tone for the session.
Key risks
Funding costs rising faster than loan yields: May point to margin pressure.
Clear tightening in credit conditions: Rising arrears or refinancing stress can change the narrative quickly.
Financials are the biggest sector in the S&P/ASX 200 index | S&P Global
2. Consumer discretionary and retail: where higher rates hit household spending
When policy is tight, consumer discretionary becomes a live test of household resilience. This is where higher everyday costs often show up fastest.
Big calls about the consumer can look obvious until the data stops backing them up. When that happens, the narrative can shift quickly.
What to watch
Wages versus inflation: The real income push or drag.
Early labour signals: Hours worked can soften before unemployment rises.
Reporting season clues: Discounting, cost pass-through, and margin pressure can indicate how stretched demand really is.
Potential trigger
If the tone from the RBA is more hawkish than expected, the sector may be sensitive to rate expectations. Any initial move may not persist, and subsequent price action can depend on incoming data and positioning
Key risks
A fast turn in the labour market.
New cost-of-living shocks, especially energy or housing, that hit spending quickly.
3. Resources: what to watch when tariffs, geopolitics, and policy shift
Resources can act as a read on global growth, but currency moves and central bank tone can change how that story lands in Australia.
In 2026, tariffs and geopolitics could also create sharper headline moves than usual, so gap risk can sit on top of the normal cycle.
The RBA still matters through two channels: the Australian dollar and overall risk appetite. Both can reprice the sector quickly, even when commodity prices have not moved much.
What to watch
The global growth pulse: Industrial demand expectations and China-linked signals.
The Australian dollar: The post-decision move can become a second driver for the sector.
Sector leadership: How resources trade versus the broader market can signal the current regime.
Potential trigger
If the RBA tone turns more restrictive while global growth stays stable, resources may hold up better than other parts of the market. Strong cash flows can matter more, and the real asset angle can attract buyers.
Key risks
In a real stress event, correlations can jump, and defensive positioning can fail.
If policy tightens into a growth scare, the cycle can take over, and the sector can fade quickly.
Materials (resources) have outperformed other ASX sectors YoY | Market Index
4. Defensives, staples, and quality healthcare
Defensives are meant to be the calmer corner of the market when everything else feels messy. In 2026, they still have one big weakness: discount rates.
Quality defensives can draw inflows when growth looks shaky, but some defensive growth stocks still trade like long-duration assets. They can be hit when yields rise, even if the business looks solid. That means earnings may be steady while valuations still move around.
What to watch
Relative strength: How defensives perform during RBA weeks versus the broader market.
Guidance language: Comments on cost pressure, pricing power, and whether volumes are holding up.
Yield behaviour: Rising yields can overpower the quality bid and push multiples down.
Potential trigger
If the RBA sounds hawkish and cyclicals start to wobble, defensives can attract relative inflows, but that can depend on yields staying contained. If yields rise sharply, long-duration defensives can still de-rate.
Key risks
Cost inflation that squeezes margins and weakens the defensive story.
Healthcare has underperformed vs S&P/ASX 200 since the end of the pandemic | Market Index
5. Hard assets, gold, and gold equities
In 2026, hard assets may be less about the simple inflation-hedge story and more about tail risk and policy uncertainty.
When confidence weakens, hard assets often receive more attention. They are not driven by one factor, and gold can still fall if the main drivers run against it.
What to watch
Real yield direction: Shapes the opportunity cost of holding gold.
US dollar direction: A major pricing channel for gold.
Gold equities versus spot gold: Miners add operating leverage, and they also add cost risk.
Potential trigger
If the market starts to question inflation control or policy credibility, the hard-asset narrative can strengthen. If the RBA stays restrictive while disinflation continues, gold can lose urgency, and money can rotate into other trades.
Key risks
Real yields rising significantly, which can pressure gold.
Crowding and positioning unwinds that can cause sharp pullbacks.
S&P/ASX All Ordinaries Gold vs Spot Gold (XAUUSD) 5Y-chart | TradingView
6. Market plumbing, FX, rates volatility, and dispersion
In some RBA weeks, the first move shows up in rates and the Australian dollar, and equities follow later through sector rotation rather than a clean index move.
When guidance shifts, the RBA can change how markets move together. You can end up with a flat index while sectors swing hard in opposite directions.
What to watch
Front-end rates: Repricing speed right after the decision can reveal the real surprise.
AUD reaction: Direction and follow-through often shape the next move in equities and resources.
Implied versus realised volatility: Can show whether the market paid too much or too little for the event.
Options skew: Can reflect demand for downside protection versus upside chasing.
Early tape behaviour: The first 5 to 15 minutes can be messy and can mean-revert.
Potential trigger
If the decision is expected but the statement leans hawkish, the front end may reprice first, and the AUD can move with it. Realised volatility can still jump even if the index barely moves, as the market rewrites the path and rotates positions under the surface.
Key risks
A true surprise that overwhelms what options implied and creates gap moves.
Competing macro headlines that dominate the tape and drown out the RBA signal.
Thin liquidity that creates false signals, whipsaw, and worse execution than models assume.
Australian interest rate and exchange rate volatility 1970-2020 | RBA
7. Theme baskets
Theme baskets may let traders express a macro regime while reducing single-name risk. They also introduce their own risks, especially around events.
What to watch
What the basket holds: Methodology, rebalance rules, hidden concentration.
Liquidity and spreads: Especially around event windows.
Tracking versus the narrative: Whether the “theme” behaves like the macro driver.
Potential trigger
If RBA language reinforces a “restrictive and uncertain” regime, theme baskets tied to value, quality, or hard assets may attract attention, particularly if broad indices get choppy.
Key risks
Theme reversal when macro expectations shift.
Liquidity risk around event windows, where spreads can widen materially.
The point of this playbook is not to predict the exact headline; it is to know where the second-order effects usually land, and to have a short checklist ready before the decision hits.
Keeping these triggers and risks in view may help some traders structure their monitoring around RBA decisions throughout 2026.
FAQs
Why does “tone” matter so much in 2026?
Because markets often pre-price the decision. The incremental information is guidance on whether the RBA sounds comfortable, concerned, or open to moving again.
What are the fastest tells right after a decision?
Some traders look to front-end rates, the AUD, and sector leadership as early indicators, but these signals can be noisy and influenced by positioning and liquidity.
Why are REITs called duration trades?
Because a large part of their valuation can be sensitive to discount rates and funding costs. When yields move, valuations can reprice quickly.
Are defensives always safer around the RBA?
Not always. If yields jump, long-duration defensives can still be repriced lower even with stable earnings.
Why do hard assets keep showing up in 2026 narratives?
Because they can act as a hedge when trust in policy credibility wobbles, but they also carry crowding and real-yield risks.
Expected earnings date: Wednesday, 25 February 2026 (US, after market close) / ~8:00 am, Thursday, 26 February 2026 (AEDT)
NVIDIA’s upcoming earnings release is expected to revolve around data centre revenue growth, the sustainability of AI-related demand, gross margin trajectory, and forward guidance into fiscal year 2027 (FY2027).
Markets are likely to focus on capital expenditure trends, supply capacity, and management’s AI infrastructure outlook.
Some market participants may also view NVIDIA’s results as a useful signal for broader AI-related investment sentiment, although outcomes can still be influenced by company-specific factors and wider market conditions.
Key areas in focus
Data centre (AI chips)
The data centre segment continues to be NVIDIA’s primary growth driver. Markets are likely to monitor revenue growth rates, gross margins, and guidance around AI accelerator demand.
Gaming
NVIDIA also sells graphics cards for gaming PCs. Markets will watch whether this part of the business remains steady and profitable, particularly alongside broader consumer and PC-cycle trends.
Automotive and Professional Visualisation
These are smaller divisions linked to AI development, design software and autonomous driving. They are not typically the main driver of near-term results, but commentary may be watched for signs of longer-term growth and product momentum.
Profit margins and costs
Markets will assess how profitable NVIDIA remains, particularly as AI-related investment and supply scaling continue. Margins are one factor closely watched alongside revenue growth, guidance, and broader risk sentiment.
What happened last quarter
In its most recent quarterly update, NVIDIA reported strong year-on-year revenue growth, led primarily by data centre demand.
Management commentary and subsequent reporting referenced ongoing strength in AI accelerator demand and referenced continued supply-scaling initiatives.
Bloomberg consensus estimates point to continued year-on-year revenue growth in the upcoming report, with markets focused on data centre performance and forward guidance into FY2027.
Bloomberg consensus reference point:
EPS: about US$1.52
Revenue: about US$65.5 billion
Full-year FY2027 EPS: about US$7.66
*All above points observed as of 16 February 2026.
Analysts broadly expect sustained AI-related demand, while attention remains on supply dynamics and the pace of any demand normalisation.
Market-implied expectations
Listed options were pricing an indicative move of approximately ±7% to ±8% around the earnings release, based on near-dated, at-the-money (ATM) options-implied expected-move estimates. Implied volatility was approximately 48% annualised.
What this means for Australian investors
NVIDIA’s earnings may influence near-term sentiment and volatility across major US equity indices, including the NASDAQ 100, with potential spillover into the Asia session following the release.
It may also influence sentiment toward ASX-listed technology-exposed companies and ETFs with exposure to US large-cap growth sectors, although correlations can shift quickly around major events.
Australian-based investors may also wish to factor in AUD/USD currency moves, which can affect the local-currency translation of offshore equities and ETFs.
Important risk note
Immediately after the US close and into the early Asia session, Nasdaq 100 (NDX) futures and related CFD pricing can reflect thinner liquidity, wider spreads, and sharper repricing around new information.
Such an environment can increase gap risk and execution uncertainty relative to regular-hours conditions.
Markets head into the week beginning 16 February with a heavy mix of economic data and ongoing earnings momentum, which will feed into the broader growth picture.
Flash PMIs (Friday): US, Eurozone, UK and Japan business surveys provide an early read on February growth momentum.
AI beyond tech: Commentary has increasingly focused on how AI could affect business models across industries, although sector moves can reflect multiple drivers.
Equity rotation: Recent tech performance has been mixed, and broader participation looks less consistent than a confirmed rotation.
Earnings: With most US mega caps reported, retail and consumer names are in focus this week, and the Australian reporting season remains busy.
Bitcoin (BTC): Pulled back after an attempted rebound and remains highly sensitive to shifts in sentiment.
Flash PMIs
Friday’s flash PMI readings across major economies could provide a timely read on business conditions and demand trends.
If services remain resilient while manufacturing stays soft, markets may interpret this as steady but uneven growth. If both weaken, growth concerns could return more quickly.
Earlier in the week, Japan GDP, UK labour data, UK CPI, Australian employment, and US trade data helped set the tone before Friday’s flash PMI releases from multiple countries.
Key dates
Flash PMIs (US, Eurozone and UK): Friday, 20 February
Monitor
Currency volatility around PMI releases.
Bond yield reactions to growth surprises or disappointment.
Sector and commodity performance shifts that may be tied to changing demand expectations.
AI disruption
Some market commentary has highlighted potential longer-term competitive implications of AI across a range of industries, although company and sector performance can still be driven by macro conditions, rates and earnings expectations.
Financials: Some discussion has focused on whether AI tools could alter parts of wealth management and advice delivery over time, though share-price moves can reflect multiple influences.
Logistics and freight: Some market discussion has centred on whether greater automation could affect costs and pricing dynamics over time, alongside other cyclical drivers.
Software: Reactions remain mixed, with some companies benefiting from AI integration while others face questions about differentiation and pricing power.
This shift means the AI theme could increasingly express itself through relative performance and dispersion, rather than a broad “risk-on” bid.
Monitor
Earnings guidance that references automation, AI investment, or AI-related competitive pressure.
Increased dispersion between sectors and within sectors.
Larger reactions to forward-looking commentary rather than headline beats or misses.
Equity rotation
The rebound in technology shares seen earlier last week has lost momentum. Rather than clear risk-off conditions, the market is showing mixed participation.
Financials, industrials and defensive sectors have attracted flows at times, but not consistently enough to confirm a durable rotation.
Participation remains uneven, and evidence of a more consistent pattern of money flow is still limited at this stage.
Monitor
Sustained relative strength in non-tech sectors.
Yield movements and their influence on growth-sensitive equities
Broader sector participation versus narrow tech leadership
NASDAQ 1-day chart | TradingView
Earnings focus
As the US earnings season moves towards its backend, attention turns toward retail names this week.
Retail results can provide signals about consumer strength, discretionary spending trends and margin resilience, particularly amid mixed perceptions about the state of the economy.
In Australia, reporting season continues, supporting stock-specific volatility across the ASX.
Monitor
Retail margin commentary and discounting trends
Consumer demand outlook statements and guidance tone
Large single-stock moves even when index direction is muted
Bitcoin sentiment-sensitive
Bitcoin has traded lower over recent sessions and remains highly volatile. A move back toward the 5 February low is possible, but prices can change quickly in either direction.
Some market participants view Bitcoin as one indicator of speculative sentiment, although any broader “risk appetite” read-through is uncertain and can be influenced by multiple drivers across crypto markets.
From tech disruptors to defence contractors, some of the market's most talked-about companies start their public journey through an initial public offering (IPO). For traders, these initial public listings can represent a unique trading environment, but also a period of heightened uncertainty.
Quick facts
An IPO is when a private company lists its shares on a public stock exchange for the first time.
IPOs can offer traders early access to high-growth companies, but come with elevated volatility and limited price history.
Once listed, traders can gain exposure to IPO stocks through direct share purchases or derivatives such as contracts for difference (CFDs).
What is an initial public offering (IPO)?
An IPO is when a company offers its shares to the public for the first time.
Before performing an IPO, shares in the company are typically only held by founders, early employees, and private investors. Going public makes the shares available to be purchased by anyone.
Depending on the size of the company, it will usually list its public shares on the local stock exchange (for example, the ASX in Australia). However, some large-valuation companies choose to only list on a global stock exchange, like the Nasdaq, no matter where their main headquarters is located.
For traders, IPOs are generally the first opportunity to gain exposure to a company’s stock. They can create a unique environment with increased volatility and liquidity, but also carry heightened risk, given the limited price history and sensitivity to sentiment swings.
Why do companies go public?
The biggest driver to perform an IPO is to access more capital. Listing on a public exchange means the company can raise significant funds by selling shares.
It also provides liquidity for existing shareholders. Founders, early employees, and private investors often sell a portion of their existing holdings on the open market, realising the returns on their years of support.
Beyond the monetary benefits, going public means companies can use their stock as currency for acquisitions and offer equity-based compensation to attract talent. And a public valuation provides a transparent benchmark, which is useful for strategic positioning and future fundraising.
However, it does come with trade-offs. Public companies must comply with ongoing disclosure and reporting obligations, and pressure from public shareholders can become a barrier to long-term progress if many are focused on short-term performance.
While the specifics vary by jurisdiction, going from a private company to a public listing generally involves the following stages:
1. Preparation
The company first selects the underwriter (typically an investment bank) to manage the offering. Together, they assess the company's financials, corporate structure, and market positioning to determine the best approach for going public. It is the heavy planning stage to make sure the company is actually ready to go public.
2. Registration
Once everything is prepared, the underwriters conduct a thorough due diligence check and then lodge the required disclosure documents with the relevant regulator. These documents give a detailed disclosure to the regulator about the company, its management, and its proposed offering. In Australia, this is typically a prospectus lodged with ASIC; in the US, a registration statement filed with the SEC.
3. Roadshow
Executives at the company and underwriters will then present the investment case to institutional investors and market analysts in a “roadshow”. This showcase is designed to gauge demand for the stock and help generate interest. Institutional investors can register their interest and valuation of the IPO, which helps inform the initial pricing.
4. Pricing
Based on feedback from the roadshow and current market conditions, the underwriters set the final share price and determine the number of shares to be issued. Shares are allocated on the ‘primary market’ to investors participating in the offer (before the stock is listed publicly on the secondary market). This process sets the pre-market price, which effectively determines the company’s initial public valuation.
5. Listing
On listing day, the company’s shares begin trading on the chosen stock exchange, officially opening the secondary market. For most traders, this is the first point at which they can trade the stock, either directly or through derivatives such as Share CFDs.
6. Post-IPO
Once listed, the company becomes subject to strict reporting and disclosure requirements. It must communicate regularly with shareholders, publish its financial results, and comply with the governance standards of the exchange on which it is listed.
IPO risks and benefits for traders
How do traders participate in IPOs?
For most traders, participating in an IPO comes once shares have listed and begun trading on the secondary market.
Once shares are live on the exchange, investors can buy the physical shares directly through a broker or online exchange, or they can use derivatives such as Share CFDs to take a position on the price without owning the underlying asset.
The first few days of IPO trading tend to be highly volatile. Traders should ensure they have taken appropriate risk management measures to help safeguard against potential sharp price swings.
The bottom line
IPOs mark when a company becomes investable to the public. They can offer early access to high-growth companies and create a unique trading environment driven by elevated volatility and market interest.
For traders, understanding how the process works, what drives pricing and post-IPO performance, and how to weigh potential rewards against the risks of trading newly listed shares is essential before taking a position.
2026 is not giving investors much breathing room. It seems markets may have largely moved past the idea that rate cuts are just around the corner and into a year where inflation may prove harder to control than many expected.
Goods inflation has picked up, while services inflation remains relatively sticky due to ongoing labour cost pressures. Housing costs, particularly rents, also remain a key source of inflation pressure.
The RBA is trying to stay credible on inflation without pushing the economy too far the other way.
Key data
CPI is still around 3.8 per cent (above target), wages are still rising at about 0.8 per cent over the quarter, and unemployment is around 4.1 per cent.
Based on market-implied pricing, rate hikes are not expected soon, so the way the RBA explains its decision can matter almost as much as the decision itself. If the tone shifts expectations, those expectations can move markets.
What this playbook covers
This is a playbook for RBA-heavy weeks in 2026. It covers what to watch across sectors, lists the key triggers, and explains which indicators may shift sentiment.
1. Banks and financials: how RBA decisions flow through to lending and borrowers
Banks are where the RBA shows up fastest in the Australian economy. Rates can hit borrowers quickly and feed into funding costs and sentiment.
In tighter phases, margins can improve at first, but that can flip if funding costs rise faster, or if credit quality starts to weaken. The balance between those forces is what matters most.
If banks rally into an RBA decision week, it may mean the market thinks higher for longer supports earnings. If they sell off, it may mean the market thinks higher for longer hurts borrowers. You can get two different readings from the same headline.
What to watch
The yield curve shape: A steeper curve can help margins, while an inverted curve can signal growth stress.
Deposit competition: It can quietly squeeze margins even when headline rates look supportive.
RBA wording on financial stability, household buffers, and resilience. Small phrases can shift the risk story.
Potential trigger
If the RBA sounds more hawkish than expected, banks may react early as markets reassess growth and credit risk expectations. The first move can sometimes set the tone for the session.
Key risks
Funding costs rising faster than loan yields: May point to margin pressure.
Clear tightening in credit conditions: Rising arrears or refinancing stress can change the narrative quickly.
Financials are the biggest sector in the S&P/ASX 200 index | S&P Global
2. Consumer discretionary and retail: where higher rates hit household spending
When policy is tight, consumer discretionary becomes a live test of household resilience. This is where higher everyday costs often show up fastest.
Big calls about the consumer can look obvious until the data stops backing them up. When that happens, the narrative can shift quickly.
What to watch
Wages versus inflation: The real income push or drag.
Early labour signals: Hours worked can soften before unemployment rises.
Reporting season clues: Discounting, cost pass-through, and margin pressure can indicate how stretched demand really is.
Potential trigger
If the tone from the RBA is more hawkish than expected, the sector may be sensitive to rate expectations. Any initial move may not persist, and subsequent price action can depend on incoming data and positioning
Key risks
A fast turn in the labour market.
New cost-of-living shocks, especially energy or housing, that hit spending quickly.
3. Resources: what to watch when tariffs, geopolitics, and policy shift
Resources can act as a read on global growth, but currency moves and central bank tone can change how that story lands in Australia.
In 2026, tariffs and geopolitics could also create sharper headline moves than usual, so gap risk can sit on top of the normal cycle.
The RBA still matters through two channels: the Australian dollar and overall risk appetite. Both can reprice the sector quickly, even when commodity prices have not moved much.
What to watch
The global growth pulse: Industrial demand expectations and China-linked signals.
The Australian dollar: The post-decision move can become a second driver for the sector.
Sector leadership: How resources trade versus the broader market can signal the current regime.
Potential trigger
If the RBA tone turns more restrictive while global growth stays stable, resources may hold up better than other parts of the market. Strong cash flows can matter more, and the real asset angle can attract buyers.
Key risks
In a real stress event, correlations can jump, and defensive positioning can fail.
If policy tightens into a growth scare, the cycle can take over, and the sector can fade quickly.
Materials (resources) have outperformed other ASX sectors YoY | Market Index
4. Defensives, staples, and quality healthcare
Defensives are meant to be the calmer corner of the market when everything else feels messy. In 2026, they still have one big weakness: discount rates.
Quality defensives can draw inflows when growth looks shaky, but some defensive growth stocks still trade like long-duration assets. They can be hit when yields rise, even if the business looks solid. That means earnings may be steady while valuations still move around.
What to watch
Relative strength: How defensives perform during RBA weeks versus the broader market.
Guidance language: Comments on cost pressure, pricing power, and whether volumes are holding up.
Yield behaviour: Rising yields can overpower the quality bid and push multiples down.
Potential trigger
If the RBA sounds hawkish and cyclicals start to wobble, defensives can attract relative inflows, but that can depend on yields staying contained. If yields rise sharply, long-duration defensives can still de-rate.
Key risks
Cost inflation that squeezes margins and weakens the defensive story.
Healthcare has underperformed vs S&P/ASX 200 since the end of the pandemic | Market Index
5. Hard assets, gold, and gold equities
In 2026, hard assets may be less about the simple inflation-hedge story and more about tail risk and policy uncertainty.
When confidence weakens, hard assets often receive more attention. They are not driven by one factor, and gold can still fall if the main drivers run against it.
What to watch
Real yield direction: Shapes the opportunity cost of holding gold.
US dollar direction: A major pricing channel for gold.
Gold equities versus spot gold: Miners add operating leverage, and they also add cost risk.
Potential trigger
If the market starts to question inflation control or policy credibility, the hard-asset narrative can strengthen. If the RBA stays restrictive while disinflation continues, gold can lose urgency, and money can rotate into other trades.
Key risks
Real yields rising significantly, which can pressure gold.
Crowding and positioning unwinds that can cause sharp pullbacks.
S&P/ASX All Ordinaries Gold vs Spot Gold (XAUUSD) 5Y-chart | TradingView
6. Market plumbing, FX, rates volatility, and dispersion
In some RBA weeks, the first move shows up in rates and the Australian dollar, and equities follow later through sector rotation rather than a clean index move.
When guidance shifts, the RBA can change how markets move together. You can end up with a flat index while sectors swing hard in opposite directions.
What to watch
Front-end rates: Repricing speed right after the decision can reveal the real surprise.
AUD reaction: Direction and follow-through often shape the next move in equities and resources.
Implied versus realised volatility: Can show whether the market paid too much or too little for the event.
Options skew: Can reflect demand for downside protection versus upside chasing.
Early tape behaviour: The first 5 to 15 minutes can be messy and can mean-revert.
Potential trigger
If the decision is expected but the statement leans hawkish, the front end may reprice first, and the AUD can move with it. Realised volatility can still jump even if the index barely moves, as the market rewrites the path and rotates positions under the surface.
Key risks
A true surprise that overwhelms what options implied and creates gap moves.
Competing macro headlines that dominate the tape and drown out the RBA signal.
Thin liquidity that creates false signals, whipsaw, and worse execution than models assume.
Australian interest rate and exchange rate volatility 1970-2020 | RBA
7. Theme baskets
Theme baskets may let traders express a macro regime while reducing single-name risk. They also introduce their own risks, especially around events.
What to watch
What the basket holds: Methodology, rebalance rules, hidden concentration.
Liquidity and spreads: Especially around event windows.
Tracking versus the narrative: Whether the “theme” behaves like the macro driver.
Potential trigger
If RBA language reinforces a “restrictive and uncertain” regime, theme baskets tied to value, quality, or hard assets may attract attention, particularly if broad indices get choppy.
Key risks
Theme reversal when macro expectations shift.
Liquidity risk around event windows, where spreads can widen materially.
The point of this playbook is not to predict the exact headline; it is to know where the second-order effects usually land, and to have a short checklist ready before the decision hits.
Keeping these triggers and risks in view may help some traders structure their monitoring around RBA decisions throughout 2026.
FAQs
Why does “tone” matter so much in 2026?
Because markets often pre-price the decision. The incremental information is guidance on whether the RBA sounds comfortable, concerned, or open to moving again.
What are the fastest tells right after a decision?
Some traders look to front-end rates, the AUD, and sector leadership as early indicators, but these signals can be noisy and influenced by positioning and liquidity.
Why are REITs called duration trades?
Because a large part of their valuation can be sensitive to discount rates and funding costs. When yields move, valuations can reprice quickly.
Are defensives always safer around the RBA?
Not always. If yields jump, long-duration defensives can still be repriced lower even with stable earnings.
Why do hard assets keep showing up in 2026 narratives?
Because they can act as a hedge when trust in policy credibility wobbles, but they also carry crowding and real-yield risks.
Expected earnings date: Wednesday, 25 February 2026 (US, after market close) / ~8:00 am, Thursday, 26 February 2026 (AEDT)
NVIDIA’s upcoming earnings release is expected to revolve around data centre revenue growth, the sustainability of AI-related demand, gross margin trajectory, and forward guidance into fiscal year 2027 (FY2027).
Markets are likely to focus on capital expenditure trends, supply capacity, and management’s AI infrastructure outlook.
Some market participants may also view NVIDIA’s results as a useful signal for broader AI-related investment sentiment, although outcomes can still be influenced by company-specific factors and wider market conditions.
Key areas in focus
Data centre (AI chips)
The data centre segment continues to be NVIDIA’s primary growth driver. Markets are likely to monitor revenue growth rates, gross margins, and guidance around AI accelerator demand.
Gaming
NVIDIA also sells graphics cards for gaming PCs. Markets will watch whether this part of the business remains steady and profitable, particularly alongside broader consumer and PC-cycle trends.
Automotive and Professional Visualisation
These are smaller divisions linked to AI development, design software and autonomous driving. They are not typically the main driver of near-term results, but commentary may be watched for signs of longer-term growth and product momentum.
Profit margins and costs
Markets will assess how profitable NVIDIA remains, particularly as AI-related investment and supply scaling continue. Margins are one factor closely watched alongside revenue growth, guidance, and broader risk sentiment.
What happened last quarter
In its most recent quarterly update, NVIDIA reported strong year-on-year revenue growth, led primarily by data centre demand.
Management commentary and subsequent reporting referenced ongoing strength in AI accelerator demand and referenced continued supply-scaling initiatives.
Bloomberg consensus estimates point to continued year-on-year revenue growth in the upcoming report, with markets focused on data centre performance and forward guidance into FY2027.
Bloomberg consensus reference point:
EPS: about US$1.52
Revenue: about US$65.5 billion
Full-year FY2027 EPS: about US$7.66
*All above points observed as of 16 February 2026.
Analysts broadly expect sustained AI-related demand, while attention remains on supply dynamics and the pace of any demand normalisation.
Market-implied expectations
Listed options were pricing an indicative move of approximately ±7% to ±8% around the earnings release, based on near-dated, at-the-money (ATM) options-implied expected-move estimates. Implied volatility was approximately 48% annualised.
What this means for Australian investors
NVIDIA’s earnings may influence near-term sentiment and volatility across major US equity indices, including the NASDAQ 100, with potential spillover into the Asia session following the release.
It may also influence sentiment toward ASX-listed technology-exposed companies and ETFs with exposure to US large-cap growth sectors, although correlations can shift quickly around major events.
Australian-based investors may also wish to factor in AUD/USD currency moves, which can affect the local-currency translation of offshore equities and ETFs.
Important risk note
Immediately after the US close and into the early Asia session, Nasdaq 100 (NDX) futures and related CFD pricing can reflect thinner liquidity, wider spreads, and sharper repricing around new information.
Such an environment can increase gap risk and execution uncertainty relative to regular-hours conditions.