Market news & insights
Stay ahead of the markets with expert insights, news, and technical analysis to guide your trading decisions.
If you have been watching markets over the past year, you will have noticed that the "growth at any cost" era has effectively hit a wall. The April 2026 earnings cycle arrives at a moment when the market's focus has undergone a structural reorientation. It is not just about profit and loss statements anymore. It is about the signals sitting behind them.
With interest rate uncertainty lingering and geopolitical shocks pushing oil above US$100, the playbook has shifted from AI hype toward institutional resilience and the industrialisation of compute. For traders in Australia, Asia and Latin America, these results may act as a mood ring for global risk appetite and the emerging security supercycle.

Why BMO and AMC matter
A BMO result hits before the US cash market opens, so price discovery happens in pre-market trading where liquidity is thinner and moves can be exaggerated. An AMC result hits after close, meaning the reaction is compressed into a short pre-market window the following morning. Understanding which window your company reports in is as important as understanding what it reports.
It's worth asking: Is the obvious trade already priced for perfection?
2026 is shaping up as a year of proof. Companies that spent heavily on AI over the past two years are now being asked to show the return. The market is no longer rewarding the announcement of AI investment. It is rewarding the evidence of AI-driven revenue outcomes.
A better framing question for each result is this: are you reacting to a headline, or are you assessing the company's role in the physical AI supply chain or as a potential volatility hedge? Those are very different analytical tasks, and they tend to produce very different positioning decisions.


Start with what actually happened to FX markets in the lead-up to April: there was a geopolitical shock and oil supply out of the Middle East came under pressure. The immediate reaction across currency markets was the one traders have seen before: money moved toward safety, toward yield, and away from anything that looked exposed to the disruption.
Safe-haven flows meet yield divergence
The US dollar benefited from both of those forces at once. It is a safe haven and it also carries a yield advantage that most of its peers cannot match right now. The Swiss franc picked up some of the overflow from European risk aversion. The yen, which used to attract safe-haven flows almost automatically, is stuck in a different situation altogether where the yield gap against the dollar is now so wide that safe-haven logic has been overridden by carry logic.
The currencies that had the toughest month were the ones caught in the middle: risk-sensitive, commodity-linked, or running policy rates that simply cannot compete. The New Zealand dollar is the clearest example while the Australian dollar is a messier story. Sitting underneath all of it is a repricing of 2026 rate cut expectations that central banks in multiple countries are now reassessing.
Strongest mover: US dollar (USD)
The US dollar spent most of 2025 gradually losing ground as the Fed cut rates and the rest of the world played catch-up. That story stalled hard in late March. The Iran conflict changed the calculus, and the dollar reasserted itself in a way that reflects something real about its structural position in global markets.
The US exports oil and when energy prices rise, that is a terms-of-trade improvement, not a terms-of-trade shock. Most of the dollar's major peers sit on the other side of that equation. Add a policy rate range of 3.50% to 3.75% that now looks locked in for longer, and the dollar's advantage is both cyclical and structural at the same time. The US Dollar Index (DXY) has regained the 100 level but tThe question heading into April is whether it holds there or pushes further.
Weakest mover: New Zealand dollar (NZD)
If you wanted to design a currency that would struggle in the current environment, the NZD fits the brief almost perfectly. It is risk-sensitive. It is commodity-linked. It runs a policy rate of 2.25%, which sits below the Fed and now below the RBA as well. New Zealand is also an energy importer, so rising oil prices hit the trade balance and the domestic inflation outlook at the same time.
None of those things are new but the combination of all of them hitting at once, against a backdrop of a surging dollar and broad risk-off sentiment, has compressed the NZD in a way that is hard to ignore. The carry trade that once made NZD attractive has reversed as capital has been moving out, not in.
USD/JPY
USD/JPY is the pair that most clearly illustrates what happens when a currency's safe-haven status gets overridden by carry logic. The yen used to be the first port of call for traders looking for protection during geopolitical stress. That dynamic has been suppressed, and the reason is straightforward: you give up too much yield to hold yen right now.
The Bank of Japan (BOJ) policy rate sits at 0.75% while the Fed's sits at 3.50% to 3.75% and that gap does not encourage safe-haven flows. It encourages borrowing in yen and deploying elsewhere. So while the dollar rose on geopolitical risk, the yen fell on the same event. That is not how it is supposed to work, but it is how the maths works out when yield differentials are this wide.
USD/JPY is sitting near 159, which leaves it not far from the 160 level that Japan's Ministry of Finance has consistently flagged as a line requiring attention. The BOJ meeting on 27 and 28 April is now a genuinely live event.
Data to watch next
Four events stand out as the clearest potential FX catalysts in the weeks ahead. Each has a direct transmission channel into rate expectations, and rate expectations are driving much of the move in FX right now.
Key levels and signals
These are the reference points that traders and policymakers are watching most closely. Each one represents a potential trigger for a shift in positioning or an official response.
Access a broader FX universe and stay flexible as conditions change.
Open an account · Log in

Here is the situation as April begins. A war is affecting one of the world's most important oil chokepoints. Brent crude is trading above US$100. And the Federal Reserve (Fed), which spent much of 2025 engineering a soft landing, is now facing an inflation threat driven less by wages, services or the domestic economy, and more by energy. It is watching an oil shock.
The Fed funds rate sits at 3.50% to 3.75%. The next Federal Open Market Committee (FOMC) meeting is on 28 and 29 April and the key question for markets is not whether the Fed will cut, it is whether the Fed can cut, or whether the energy shock may have shut that door for much of 2026.
A heavy run of major data releases lands in April. The March consumer price index (CPI), non-farm payrolls (NFP) and the advance estimate of Q1 gross domestic product (GDP) are the three that matter most. But the FOMC statement on 29 April may be the release that sets the tone for the rest of the year.
Growth: Business activity and demand
Think about what the US economy looked like coming into this year: AI-driven capital expenditure (capex) was a major part of the growth narrative, corporate investment intentions looked firm and the One, Big, Beautiful Bill Act was already in the mix. On paper, the growth story looked solid.
Then the Strait of Hormuz situation changed the calculus. Not because the US is a net energy importer, it is not, and that structural insulation matters. But what is good for US energy producers can still squeeze margins elsewhere and weigh on global demand. The 30 April advance Q1 gross domestic product (GDP) estimate is now likely to be read through two lenses: how strong was the economy before the shock, and what it may signal about the quarters ahead.
Labour: Payrolls and employment
February's jobs report was, depending on how you read it, either a blip or a warning sign. Non-farm payrolls (NFP) fell by 92,000, unemployment edged up to 4.4% and the official line was that weather played a role. That may be true but here is what also happened. The labour market suddenly looked a little less convincing as the main argument for keeping rates elevated.
The 3 April employment report for March is now genuinely consequential. A bounce back to positive payroll growth would probably steady nerves and a second consecutive soft print, particularly against a backdrop of higher energy prices, would start to build a very uncomfortable narrative for the Fed. It would be looking at slower jobs growth and an inflation threat at the same time. That is not a comfortable place to be.
Inflation: CPI, PPI and PCE
Here is the uncomfortable truth about where inflation sits right now. Core personal consumption expenditures (PCE), the Fed's preferred gauge, was already running at 3.1% year on year in January, before any oil shock had fed through. The Fed had not fully solved its inflation problem, rather, it had slowed it down. That is a different thing.
And now, on top of a not-quite-solved inflation problem, oil prices have moved sharply higher. Energy prices can feed into the consumer price index (CPI) relatively quickly, through petrol, transport and logistics costs that can eventually show up in the price of nearly everything. The 10 April CPI print for March is probably the most important single data release of the month, it is the one that may tell us whether the energy shock is already showing up in the numbers the Fed watches.
Policy, trade and earnings
April is also the start of US earnings season, and this quarter's results carry an unusual amount of weight. Investors have been pouring capital into AI infrastructure on the basis that returns are coming. The question is when. With geopolitical volatility driving a rotation away from growth-oriented technology and towards energy and defence, JPMorgan Chase's 14 April earnings will be read as much for what management says about the macro environment as for the numbers themselves.
Then there is the FOMC meeting on 28 and 29 April. After the early-April run of data, including NFP, CPI and producer price index (PPI), the Fed will have more than enough information to update its language. Whether it signals that rate cuts could remain on hold through 2026, or whether it leaves the door slightly ajar, may be the most consequential communication of the quarter.
Geopolitical volatility has already pushed investors to reassess growth-heavy positioning. The estimated US$650 billion AI infrastructure buildout is also coming under heavier scrutiny on return on investment. If earnings season disappoints on that front, and if the FOMC signals a prolonged hold, the combination could test risk appetite heading into May.
Big US data release ahead? Stay focused.
Open an account · Log in

Asia-Pacific markets start April with a focus on how prolonged disruption in the Strait of Hormuz feeds through to inflation, trade flows, and policy expectations. China's 15th Five-Year Plan shifts attention toward artificial intelligence and technological self-reliance, with knock-on effects for supply chains and regional growth. Japan and Australia both face the challenge of managing imported energy inflation while gauging how far they can normalise policy without derailing domestic demand.
For traders, the mix of elevated energy prices and policy divergence may keep volatility elevated across regional indices and currencies.
China
Lawmakers in Beijing have approved the 15th Five-Year Plan (2026-2030), placing artificial intelligence (AI) and technological self-reliance at the centre of the national agenda. The government has set a growth target of 4.5% to 5.0% for 2026, the lowest in decades, as it prioritises quality of growth over speed.
Japan
The Bank of Japan (BOJ) faces increasing pressure to normalise policy as energy-driven inflation risks a resurgence. While consumer prices excluding fresh food slowed to 1.6% in February, the recent oil price spike may push the consumer price index (CPI) back toward the 2% target in coming months.
Australia
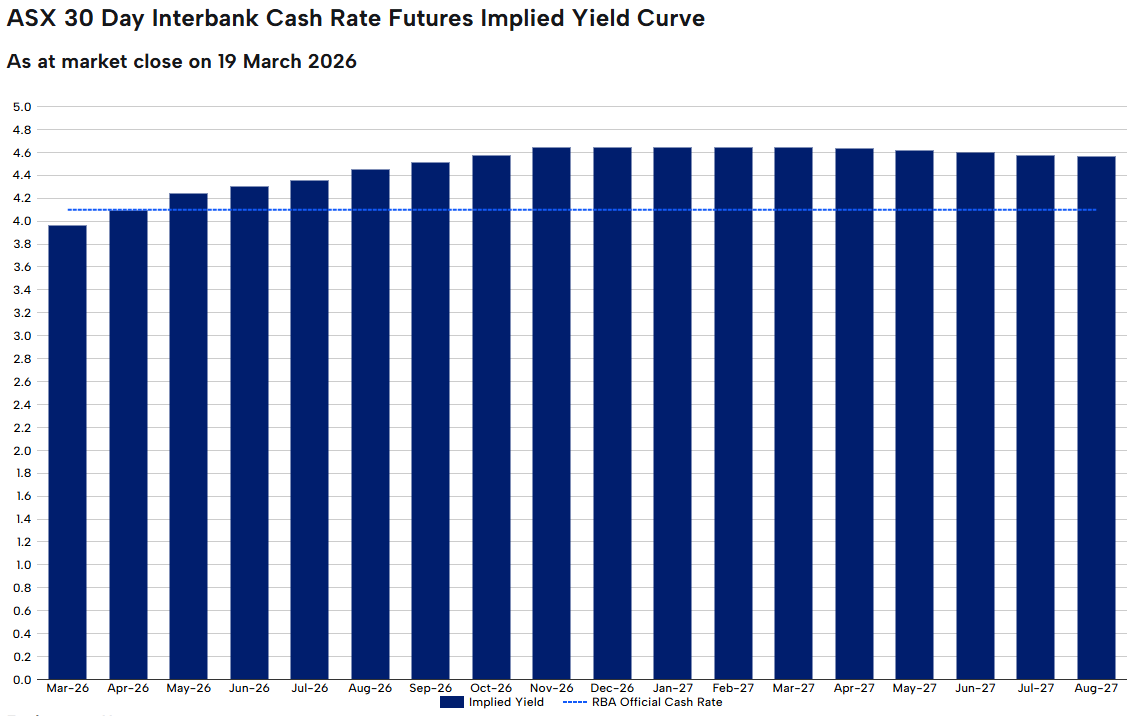
The Australian economy remains in a state of two-speed divergence, with older households increasing spending while younger cohorts face significant affordability pressures. Following the Reserve Bank of Australia's (RBA) rate increase to 4.10% in March, markets are highly focused on upcoming inflation data to assess whether additional tightening may be required.
Track Asia-Pacific themes and
monitor moves as they unfold.
Open an account · Log in

With the Iran conflict reshaping energy markets, central banks turning hawkish, and gold in freefall despite the chaos, the safe haven playbook in 2026 is more complicated than ever.
Quick facts
- Gold has fallen more than 20% from its all-time high, despite an active war in the Middle East
- The Singapore dollar is near its strongest level against the USD since October 2014
- The Reserve Bank of Australia (RBA) hiked rates to 4.10% in March 2026 as Iran-driven oil prices push Australian inflation higher
1. Gold (XAU/USD)
Gold remains the most widely traded safe haven globally. It benefits from geopolitical stress, US dollar weakness, and negative real interest rate environments. However, its short-term behaviour in 2026 demands explanation.
Despite an active war in the Middle East, gold has sold off sharply. The likely cause is the Fed trimming its 2026 rate cut projections, citing hotter-than-expected producer inflation and Strait of Hormuz-driven oil prices creating inflation persistence.
Ultimately, gold's bull case rests on falling real yields and a weaker dollar, and right now neither condition is in place. Traders should be aware that during an inflationary supply shock like the one the Iran conflict has delivered, gold does not always behave as expected.
However, if you zoom out, the longer-term picture reinforces gold’s safe-haven status, ending 2025 as one of its strongest years on record.
Key variables to watch: US Federal Reserve guidance, real yields, and USD direction.
2. Japanese Yen (JPY)
The yen has long functioned as a safe-haven currency thanks to Japan's status as the world's largest net creditor nation. In times of stress, Japanese investors tend to repatriate capital, driving the yen higher.
However, that dynamic seems to have shifted in 2026 so far. The yen is down 6.63% YoY, near its weakest level since July 2024, and surging oil import costs are weighing on the currency.
The yen's safe-haven role has not disappeared, though. It tends to reassert itself during sharp equity selloffs and liquidity events. But in an oil-driven inflation shock, it faces structural headwinds.
Key variables to watch: BOJ rate decisions, US-Japan yield differentials, and any intervention signals from Japanese authorities.
3. Swiss Franc (CHF)
Switzerland's political neutrality, account surplus, and strong institutional framework make the franc a reflexive safe-haven currency. Unlike the yen, the CHF is holding up in the current environment, with the franc gaining against the dollar in 2026, and EUR/CHF remaining stable.
For traders across Europe and the Middle East, CHF is often the first port of call during stress events.
Key variables to watch: Swiss National Bank intervention language, European geopolitical developments, and global risk indices.
4. US Treasury Bonds (US10Y)
Under normal conditions, US government bonds are some of the deepest, most liquid safe-haven instruments in the world. But 2026 is not normal conditions…
Yields have been rising, not falling, meaning bond prices are moving in the wrong direction for anyone seeking safety.
When yields rise during a risk-off event, it signals the market is treating bonds as an inflation risk rather than a safety asset.
However, short-duration Treasuries like bills and 2-year notes are a different story. They may offer higher income with less duration risk than longer-dated bonds, which is why some investors use them more defensively in volatile periods.
Key variables to watch: Fed communication, CPI and PCE data, and whether the 10Y yield breaks above 4.50% or pulls back below 4.00%.
5. Australian Dollar vs. US Dollar (AUD/USD): inverse play
The Australian dollar is widely considered a risk-on currency, tied closely to global commodity demand and Chinese growth.
In risk-off environments, AUD/USD typically falls. A falling AUD/USD can serve as a leading indicator of broader global stress, which can be useful context for traders with regional exposure.
The RBA hiking cycle (two hikes since the start of 2026) is providing some floor under the AUD, but in a sustained global risk-off move, that support has limits.
Key variables to watch: RBA forward guidance, Chinese PMI data, iron ore prices, and oil's impact on Australian inflation expectations.
6. US Dollar Index (DXY)
The US dollar acts as the world's reserve currency and a reflexive safe haven during acute stress. When liquidity dries up, global demand for USD tends to spike regardless of the underlying trend.
Over the past 12 months, the dollar has lost ground as global confidence in US fiscal trajectory has wavered. But over the past month, it has firmed, supported by a hawkish Fed and elevated geopolitical risk.
In risk-off environments, the USD continues to attract safe-haven flows. However, rising oil prices can increase inflation risks, complicating Federal Reserve policy expectations.
Key variables to watch: Fed rate path, US inflation data, and global liquidity conditions.
7. Singapore Dollar (SGD)
Less discussed globally but highly relevant across Southeast Asia, the SGD is one of the most quietly resilient currencies in the current environment.
The Singapore dollar has advanced to near its highest level since October 2014, supported by safe haven flows and investors drawn to Singapore's AAA-rated bonds, a dividend-heavy stock market, and predictable government policies.
The MAS manages the SGD through a nominal effective exchange rate band rather than an interest rate, giving it a different character from other safe-haven currencies.
For traders with exposure to Indonesia, Malaysia, Thailand, Vietnam, and the broader ASEAN region, USD/SGD can act as a practical benchmark for regional risk appetite.
Key variables to watch: MAS policy band adjustments, regional trade flows, and USD/Asia dynamics more broadly.
8. Cash and Short-Duration Fixed Income
Sometimes, the most effective safe haven can be to simply reduce exposure. With central bank rates still elevated across major economies, cash and short-duration government bonds can offer a meaningful yield while sitting outside market risk.
The RBA raised the cash rate to 4.10% at its March meeting. The Bank of England held at 3.75%, while the ECB kept its deposit facility rate at 2.00% and main refinancing rate at 2.15%. Across all major economies, short-duration government paper is offering a real return for the first time in years.
In a volatile environment, capital preservation can sometimes matter more than return maximisation.
Key variables to watch: Central bank meeting calendars across all major economies, and any shifts in forward guidance on the rate path.
What to Watch Next
Fed inflation data. Core PCE is the single most important data point for gold, bonds, and the dollar right now. Any surprise in either direction could move all three simultaneously.
Yen intervention risk. The yen is near levels that have previously triggered action from Japanese authorities. Traders with Asia-Pacific exposure should monitor closely.
RBA's next move. With Australia now at 4.10% and inflation still above target, the question is whether the hiking cycle has further to run. The next RBA meeting is on 5 May.
Geopolitical trajectory. Any move toward de-escalation in the Middle East would quickly reduce safe haven demand and rotate capital back into risk assets. The reverse is equally true.
China's growth signal. A stronger-than-expected Chinese recovery could lift commodity currencies and reduce defensive positioning across Asia-Pacific.
The Longer-Term Lens
The 2026 environment is exposing that the effectiveness of safe haven assets depends on the type of shock, not just its severity.
An inflationary supply shock like the Iran conflict has delivered is one of the most difficult environments for traditional safe havens.
Gold falls as real yields rise. Bonds sell off as inflation expectations climb. Even the yen can weaken as Japan's import costs surge.
What has held up are assets with institutional credibility, managed frameworks, and deep liquidity regardless of macro conditions. The Swiss franc, Singapore dollar, and short-duration cash instruments fit that description better than gold or long bonds do right now.
In 2026, the question for traders is not "which safe haven?" It is "a safe haven from what?"

If you've spent any time looking at a trading terminal, you've seen it. A news headline breaks, a chart line snaps, and suddenly everyone is rushing for the same exit or the same entrance. It looks like chaos. In practice, it is often a chain of mechanical responses.
This matters for a couple of reasons. Many readers assume the story is the trade. It is not. The story, whether it is an interest rate decision, a supply shock or an earnings miss, is the fuel and the playbook is the engine.
Below are seven core strategies often used in contracts for difference (CFDs) trading. With CFDs, you are not buying the underlying asset. You are speculating on the change in value. That means a trader can take a long position if the price rises, or a short position if it falls.
Seven strategies to understand first
1. Trend following (the establishment play)
Trend following works on the idea that a market already in motion can remain in motion until it meets a clear structural obstacle. Some market participants view it as a chart-based approach because it focuses on the prevailing direction rather than trying to call an exact turning point.
The rationale: The aim is to identify a clear directional bias, such as higher highs and higher lows, and follow that momentum rather than position against it.
What traders look for: Exponential moving averages (EMAs), such as the 50-day or 200-day EMA, are commonly used to interpret trend strength, though indicators can produce false signals and are not reliable on their own.

How it works: The 50-period EMA can act as a dynamic support level that rises as price rises. In an uptrend, some traders watch for the market to make a new higher high (HH), then pull back towards the EMA before moving higher again. Each higher low (HL) may suggest buyers are still in control.
When price touches or comes close to the 50-period EMA during that pullback, some traders treat that area as a potential decision zone rather than assuming the trend will resume automatically.
What to watch: The sequence of HHs and HLs is part of the structural evidence of a trend. If that sequence breaks, for example if price falls below the previous HL, the trend may be weakening and the setup may no longer hold.
2. Range trading (the ping-pong play)
Markets can spend long stretches moving sideways. That creates a range, where buyers and sellers are in temporary balance. Range trading is built around this behaviour, focusing on moves near the bottom and top of an established range.
The rationale: Price moves between a floor, known as support, and a ceiling, known as resistance. Moves near those boundaries can help define the width of the range.
What traders look for: Some traders use oscillators such as the Relative Strength Index (RSI) to help judge whether the asset looks overbought or oversold near each boundary.

How it works: The support level is a price zone where buying interest has historically been strong enough to stop the market from falling further. The resistance level is where selling pressure has historically prevented further gains.
When price approaches support, some traders look for signs of a potential rebound. When it approaches resistance, they look for signs that momentum may be fading. RSI readings below 35 can suggest the market is oversold near support, while readings above 65 can suggest it is overbought near resistance.
What to watch: The main risk in range trading is a breakout, when price pushes decisively through either level with strong momentum. This may signal the start of a new trend and using a stop-loss just outside the range on each trade may help manage that risk.
3. Breakouts (the coiled spring play)
Eventually, every range comes under pressure. A breakout happens when the balance shifts and price pushes through support or resistance. Markets alternate between periods of low volatility, where price moves sideways in a tight range, and high-volatility bursts where price can make a larger directional move.
The rationale: Quiet consolidation can sometimes be followed by a broader expansion in volatility. The tighter the compression, the more energy may be stored for the next move.
What traders look for: Bollinger Bands are often used to interpret changes in volatility. When the bands tighten, a squeeze is forming. Some market participants view a move outside the bands as a sign that conditions may be changing.

How it works: Bollinger Bands consist of a middle line, the 20-period moving average, and 2 outer bands that expand or contract based on recent price volatility. When the bands narrow and come close together, the squeeze, the market has been unusually calm.
This is often described as a coiled spring. Energy may be building, and a sharper move can follow. Some traders treat the first move through an outer band as an early clue on direction, rather than a definitive signal on its own.
What to watch: Not every squeeze leads to a powerful breakout. A false breakout occurs when price briefly moves outside a band, then quickly reverses back inside. Waiting for the candle to close outside the band, rather than entering mid-candle, can reduce the risk of being caught in a false move.
4. News trading (the deviation play)
This is event-driven trading. The focus is on the gap between what the market expected and what the data or headline actually delivered. Economic data releases, such as inflation figures (CPI), employment reports and central bank decisions, can cause sharp, fast moves in financial markets.
The rationale: High-impact releases, such as inflation data or central bank decisions, can force a fast repricing of assets. The bigger the surprise relative to expectations, the larger the move may be.
What traders look for: Traders often use an economic calendar to track timing. Some focus on how the market behaves after the initial reaction, rather than treating the first move as definitive.

How it works: Before the news, price may move in a calm, tight range as traders wait. When the data is released, if the actual reading differs significantly from the consensus expectation, repricing can happen fast.
Gold, for example, may spike sharply on a CPI reading that comes in above expectations. However, the candle can also print a very long upper wick, meaning price reached the spike high but was then rejected strongly. Sellers may step in quickly, and price may retrace. This spike-and-retrace pattern is one of the more recognisable setups in news trading.
What to watch: The direction and size of the initial spike do not always tell the full story. Wick length can offer an important clue. A long wick may suggest the initial move was rejected, while shorter wicks after a data release may indicate a more sustained directional move.
5. Mean reversion (the rubber-band play)
Prices can sometimes move too far, too fast. Mean reversion is built on the idea that an overextended move may drift back towards its historical average, like a rubber band pulled too tight, then snapping back.
The rationale: This is a contrarian approach. It looks for stretches of optimism or pessimism that may not be sustainable, and positions for a return to equilibrium.
What traders look for: A common example is price moving well away from a 20-day moving average (MA) while RSI also reaches an extreme reading. In that setup, traders watch for a move back towards the mean rather than a continuation away from it.

How it works: The 20-period MA represents the market's recent average price. When price moves into an extreme zone, such as more than 3 standard deviations above or below that average, it has moved a long way from its recent trend.
An RSI above 70 can suggest the market is stretched to the upside, while below 30 can suggest the same to the downside. Some mean reversion traders use these combined signals as a sign that a pullback towards the 20-period MA may be possible, rather than assuming the move will continue to extend.
What to watch: Mean reversion strategies can carry significant risk in strongly trending markets. A market can remain extended for longer than expected, and a position entered against the short-term trend can generate large drawdowns. Position sizing and clear stop-losses are critical.
6. Psychological levels (the big figure play)
Markets are driven by people, and people tend to focus on round numbers. US$100, US$2,000 or parity at 1.000 on a currency pair can act as magnets. In financial markets, certain price levels can attract a disproportionate amount of buying and selling activity, not because of technical analysis alone, but because of human psychology.
The rationale: Large orders, stop-losses and take-profit levels can cluster around these big figures, which may reinforce support or resistance. This self-reinforcing behaviour is one reason these rejections can become meaningful for traders.
What traders look for: Traders often watch how price behaves as it approaches a round number. The market may hesitate, reject the level or break through it with momentum. Multiple wick rejections at the same level may carry more weight than a single one.

How it works: When price approaches a round number from below, some traders watch for long upper wicks, the thin vertical line above the candle body. A long upper wick means price reached that level, but sellers stepped in aggressively and pushed it back down before the candle closed.
One wick rejection may be notable. Three in a cluster may be more significant. Some traders use this accumulated rejection as part of the case for a short (sell) setup at that level.
What to watch: Psychological levels can also act as magnets in the opposite direction. If price breaks through with conviction, the level may then act as support. A decisive close above the level, rather than just a wick break, can be an early sign that the rejection setup is no longer holding.
7. Sector rotation (the economic season play)
This is a macro strategy. As the economic backdrop changes, capital may move from higher-growth sectors into more defensive ones, and back again. Not all parts of the sharemarket move in the same direction at the same time.
The rationale: In a slowing economy, discretionary spending may weaken while demand for essential services can remain more stable. Investors may rotate capital between sectors accordingly.
What traders look for: With CFDs, some traders express this view through relative strength, taking exposure to a stronger sector while reducing or offsetting exposure to a weaker one.

How it works: During a growth phase, when the economy is expanding, investors tend to prefer growth-oriented sectors like technology. As the economic environment shifts, perhaps due to rising interest rates, slowing earnings or increasing recession risk, a rotation point may emerge.
In the slowdown phase, the pattern can reverse. Technology may weaken while utilities may strengthen, as investors move capital into defensive, income-generating sectors. Early signals can include relative underperformance in growth sectors combined with unusual strength in defensives.
What to watch: Sector rotation is not usually an overnight event. It typically unfolds over weeks to months. Tracking the ratio between two sectors, often shown in a relative strength chart, can make this shift visible before it becomes obvious in absolute price terms.

Why risk management is the engine of survival
The headline move is one thing. The market implication for your account is another. If you do not manage the mechanics, the strategy does not matter.
Because CFDs are traded on margin, a small market move may have an outsized impact on the account. If leverage is too high, even a minor wobble may trigger a margin call or automatic position closure, depending on the provider's terms. This is not a theoretical risk. It is a common reason new traders lose more than they expected on a trade that was directionally correct.
The market does not always move in a straight line. Sometimes, price gaps from one level to another, especially after a weekend or major news event and in those conditions, a stop-loss may not be filled at the exact requested price. That is known as slippage. It is one reason large positions may carry additional risk into major announcements.
Bottom line
The vehicle is powerful, but the playbook is what helps keep you on the road.
The obvious trade is often already priced in. What matters more is understanding which market condition is in front of you. Is it trending, ranging, breaking out or simply reacting to a headline?
Readers assessing leveraged products often focus on position sizing, risk limits and product disclosure before deciding whether the product is appropriate for them. The headlines will keep changing. The maths of risk management does not.
Ready to trade beyond the majors?
Open an account · Log in
Disclaimer: This article is general information only and is intended for educational purposes. It explains common trading concepts and market behaviours and does not constitute financial product advice, a recommendation, or a trading signal. Any examples are illustrative only and do not take into account your objectives, financial situation or needs. CFDs are complex, leveraged products that carry a high level of risk. Before acting, consider the PDS and TMD and whether trading CFDs is appropriate for you. Seek independent advice if needed. Past performance is not a reliable indicator of future results.
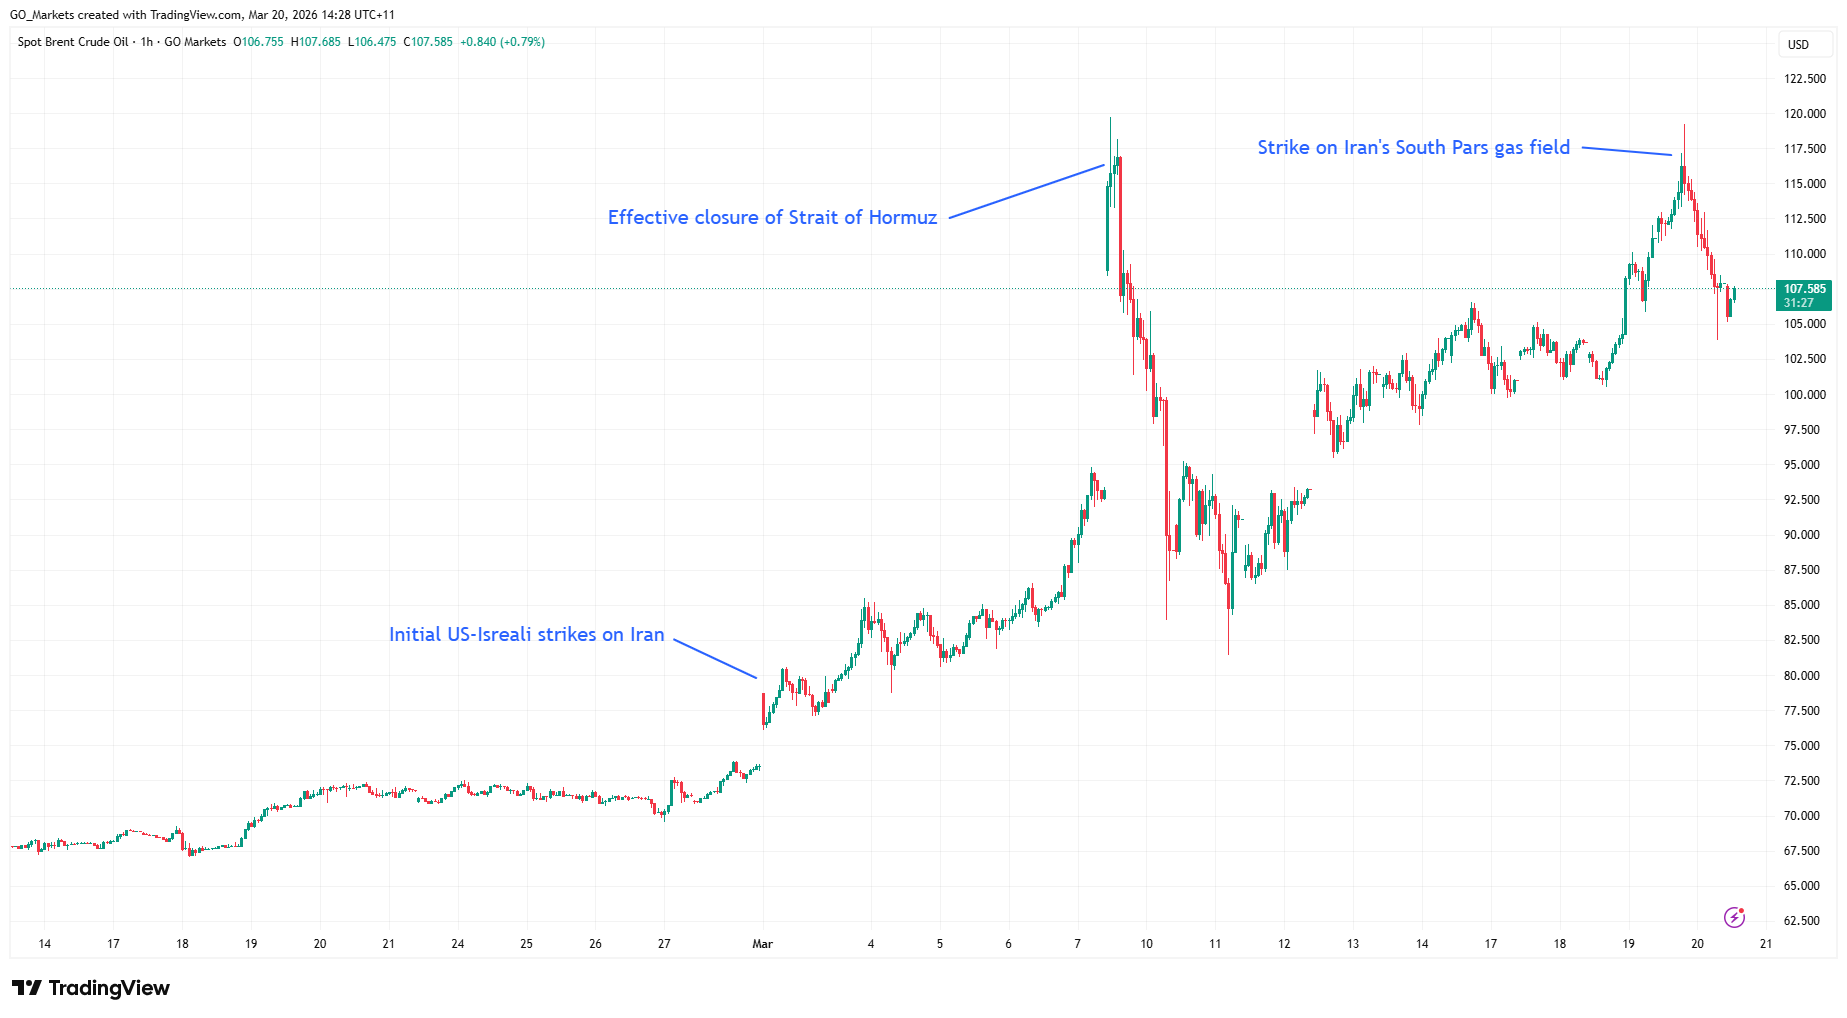
Last week was as consequential as advertised. The RBA hiked, the Fed held, and markets barely had time to process any of it before reports emerged that Israel had struck Iran's South Pars gas field.
The week ahead brings fewer central bank decisions, but it may be just as important for markets. Flash PMIs will offer the first broad read on whether the war is already showing up in business confidence. Australia's February CPI is the domestic data point that matters most for the RBA's next move. And the oil market remains the dominant macro variable.
Quick facts
- Brent crude spiked above $110 per barrel after Israel struck Iran's South Pars gas field for the first time.
- Flash PMIs for Australia, Japan, the eurozone, UK, and the US all land Tuesday.
- Australia's February CPI lands Wednesday, the first inflation read since the back-to-back RBA hikes.
Oil: From crisis to emergency
The oil situation deteriorated significantly last week. Brent crude has now surged roughly 80% since the war began on 28 February.
The 18 March strike on Iran's South Pars gas field was the first time upstream oil and gas infrastructure has been targeted.
Iran responded to the strike by threatening to target facilities across Saudi Arabia, the UAE and Qatar. If any of these threats are executed, the global oil shock would escalate from a supply disruption to a direct attack on the region's production capacity.
Analysts are now saying $150 Brent is achievable and $200 is not outside the realm of possibility. The 1970s Arab oil embargo resulted in a quadrupling of prices, and the current shock is already being described in those terms by senior energy executives.
For markets this week, oil is the dominant variable. Any signal of ceasefire, diplomatic progress or resumed Hormuz shipping could likely trigger a correction in oil prices. Any Iranian strike on Gulf infrastructure could send them higher.
Monitor
- Daily vessel transit numbers through the Strait of Hormuz.
- Iranian retaliation against Gulf infrastructure, a strike on Saudi or UAE facilities would be a major escalation.
- When and how American and European IEA reserves reach the market.
- Qatar's South Pars disruption is affecting the European LNG market.
- Trump statements that could cause intraday oil price movement.
Global Flash PMIs: The first read on an economy at war
Tuesday delivers the S&P Global flash PMI estimates for March across every major economy simultaneously.
This will be the first data set to capture how manufacturers and services firms are responding to $100+ oil, the Strait of Hormuz blockade, and the broader uncertainty created by the war in the Middle East.
The key question for each economy is whether the oil price surge and war uncertainty have dented business confidence, suppressed new orders or pushed input price indices to new multi-year highs.
Given that oil crossed $100 before the survey window closed for most economies, input cost readings could be significantly elevated.
Key dates
- S&P Global Flash Australia PMI: Tuesday 24 March, 9:00 am AEDT
- S&P Global Flash Japan PMI: Tuesday 24 March, 11:30 am AEDT
- HSBC Flash India PMI: Tuesday 24 March, 4:00 pm AEDT
- HCOB Flash France PMI: Tuesday 24 March, 7:15 pm AEDT
- HCOB Flash Germany PMI: Tuesday 24 March, 7:30 pm AEDT
- HCOB Flash Eurozone PMI: Tuesday 24 March, 8:00 pm AEDT
- S&P Global Flash UK PMI: Tuesday 24 March, 8:30 pm AEDT
- S&P Global Flash US PMI: Wednesday 25 March, 12:45 am AEDT
Monitor
- Input price components for any multi-year highs across manufacturing and services.
- Business confidence indices for how much the war shock has dented forward expectations.
- New orders as an indicator for future output; a sharp fall could signal demand destruction is underway.
- US composite PMI: already the weakest of major economies in February, another soft reading could raise growth alarm bells.
Hormuz crisis explained
Australia: Is another hike coming?
The RBA hiked for the second meeting in a row on 17 March, lifting the cash rate to 4.10% in a narrow 5-4 vote.
Governor Bullock described it as a "very active discussion" where the direction of policy was not in question, only the timing.
This week will see the release of February's CPI as the first read to capture any of the oil shock. The trimmed mean, which strips out volatile items including fuel, will be the number the RBA watches most closely. A reading above 3.5% could cement the case for a May hike. A softer result could revive the argument for a pause.
ANZ and NAB have both stated expectations of a third hike in May, taking the cash rate to 4.35%.
Key dates
- ABS Consumer Price Index (CPI): Wednesday 25 March, 11:30 am AEDT
Monitor
- Trimmed mean inflation as the RBA's preferred measure.
- Fuel and energy components that could separate the oil shock from domestic price pressure.
- Housing and services inflation as sticky components driving the RBA's long-run concern.