Trading strategies
Explore practical techniques to help you plan, analyse and improve your trades.
Our library of trading strategy articles is designed to help you strengthen your market approach. Discover how different strategies can be applied across asset classes, and how to adapt to changing market conditions.


With the Iran conflict reshaping energy markets, central banks turning hawkish, and gold in freefall despite the chaos, the safe haven playbook in 2026 is more complicated than ever.
Quick facts
- Gold has fallen more than 20% from its all-time high, despite an active war in the Middle East
- The Singapore dollar is near its strongest level against the USD since October 2014
- The Reserve Bank of Australia (RBA) hiked rates to 4.10% in March 2026 as Iran-driven oil prices push Australian inflation higher
1. Gold (XAU/USD)
Gold remains the most widely traded safe haven globally. It benefits from geopolitical stress, US dollar weakness, and negative real interest rate environments. However, its short-term behaviour in 2026 demands explanation.
Despite an active war in the Middle East, gold has sold off sharply. The likely cause is the Fed trimming its 2026 rate cut projections, citing hotter-than-expected producer inflation and Strait of Hormuz-driven oil prices creating inflation persistence.
Ultimately, gold's bull case rests on falling real yields and a weaker dollar, and right now neither condition is in place. Traders should be aware that during an inflationary supply shock like the one the Iran conflict has delivered, gold does not always behave as expected.
However, if you zoom out, the longer-term picture reinforces gold’s safe-haven status, ending 2025 as one of its strongest years on record.
Key variables to watch: US Federal Reserve guidance, real yields, and USD direction.
2. Japanese Yen (JPY)
The yen has long functioned as a safe-haven currency thanks to Japan's status as the world's largest net creditor nation. In times of stress, Japanese investors tend to repatriate capital, driving the yen higher.
However, that dynamic seems to have shifted in 2026 so far. The yen is down 6.63% YoY, near its weakest level since July 2024, and surging oil import costs are weighing on the currency.
The yen's safe-haven role has not disappeared, though. It tends to reassert itself during sharp equity selloffs and liquidity events. But in an oil-driven inflation shock, it faces structural headwinds.
Key variables to watch: BOJ rate decisions, US-Japan yield differentials, and any intervention signals from Japanese authorities.
3. Swiss Franc (CHF)
Switzerland's political neutrality, account surplus, and strong institutional framework make the franc a reflexive safe-haven currency. Unlike the yen, the CHF is holding up in the current environment, with the franc gaining against the dollar in 2026, and EUR/CHF remaining stable.
For traders across Europe and the Middle East, CHF is often the first port of call during stress events.
Key variables to watch: Swiss National Bank intervention language, European geopolitical developments, and global risk indices.
4. US Treasury Bonds (US10Y)
Under normal conditions, US government bonds are some of the deepest, most liquid safe-haven instruments in the world. But 2026 is not normal conditions…
Yields have been rising, not falling, meaning bond prices are moving in the wrong direction for anyone seeking safety.
When yields rise during a risk-off event, it signals the market is treating bonds as an inflation risk rather than a safety asset.
However, short-duration Treasuries like bills and 2-year notes are a different story. They may offer higher income with less duration risk than longer-dated bonds, which is why some investors use them more defensively in volatile periods.
Key variables to watch: Fed communication, CPI and PCE data, and whether the 10Y yield breaks above 4.50% or pulls back below 4.00%.
5. Australian Dollar vs. US Dollar (AUD/USD): inverse play
The Australian dollar is widely considered a risk-on currency, tied closely to global commodity demand and Chinese growth.
In risk-off environments, AUD/USD typically falls. A falling AUD/USD can serve as a leading indicator of broader global stress, which can be useful context for traders with regional exposure.
The RBA hiking cycle (two hikes since the start of 2026) is providing some floor under the AUD, but in a sustained global risk-off move, that support has limits.
Key variables to watch: RBA forward guidance, Chinese PMI data, iron ore prices, and oil's impact on Australian inflation expectations.
6. US Dollar Index (DXY)
The US dollar acts as the world's reserve currency and a reflexive safe haven during acute stress. When liquidity dries up, global demand for USD tends to spike regardless of the underlying trend.
Over the past 12 months, the dollar has lost ground as global confidence in US fiscal trajectory has wavered. But over the past month, it has firmed, supported by a hawkish Fed and elevated geopolitical risk.
In risk-off environments, the USD continues to attract safe-haven flows. However, rising oil prices can increase inflation risks, complicating Federal Reserve policy expectations.
Key variables to watch: Fed rate path, US inflation data, and global liquidity conditions.
7. Singapore Dollar (SGD)
Less discussed globally but highly relevant across Southeast Asia, the SGD is one of the most quietly resilient currencies in the current environment.
The Singapore dollar has advanced to near its highest level since October 2014, supported by safe haven flows and investors drawn to Singapore's AAA-rated bonds, a dividend-heavy stock market, and predictable government policies.
The MAS manages the SGD through a nominal effective exchange rate band rather than an interest rate, giving it a different character from other safe-haven currencies.
For traders with exposure to Indonesia, Malaysia, Thailand, Vietnam, and the broader ASEAN region, USD/SGD can act as a practical benchmark for regional risk appetite.
Key variables to watch: MAS policy band adjustments, regional trade flows, and USD/Asia dynamics more broadly.
8. Cash and Short-Duration Fixed Income
Sometimes, the most effective safe haven can be to simply reduce exposure. With central bank rates still elevated across major economies, cash and short-duration government bonds can offer a meaningful yield while sitting outside market risk.
The RBA raised the cash rate to 4.10% at its March meeting. The Bank of England held at 3.75%, while the ECB kept its deposit facility rate at 2.00% and main refinancing rate at 2.15%. Across all major economies, short-duration government paper is offering a real return for the first time in years.
In a volatile environment, capital preservation can sometimes matter more than return maximisation.
Key variables to watch: Central bank meeting calendars across all major economies, and any shifts in forward guidance on the rate path.
What to Watch Next
Fed inflation data. Core PCE is the single most important data point for gold, bonds, and the dollar right now. Any surprise in either direction could move all three simultaneously.
Yen intervention risk. The yen is near levels that have previously triggered action from Japanese authorities. Traders with Asia-Pacific exposure should monitor closely.
RBA's next move. With Australia now at 4.10% and inflation still above target, the question is whether the hiking cycle has further to run. The next RBA meeting is on 5 May.
Geopolitical trajectory. Any move toward de-escalation in the Middle East would quickly reduce safe haven demand and rotate capital back into risk assets. The reverse is equally true.
China's growth signal. A stronger-than-expected Chinese recovery could lift commodity currencies and reduce defensive positioning across Asia-Pacific.
The Longer-Term Lens
The 2026 environment is exposing that the effectiveness of safe haven assets depends on the type of shock, not just its severity.
An inflationary supply shock like the Iran conflict has delivered is one of the most difficult environments for traditional safe havens.
Gold falls as real yields rise. Bonds sell off as inflation expectations climb. Even the yen can weaken as Japan's import costs surge.
What has held up are assets with institutional credibility, managed frameworks, and deep liquidity regardless of macro conditions. The Swiss franc, Singapore dollar, and short-duration cash instruments fit that description better than gold or long bonds do right now.
In 2026, the question for traders is not "which safe haven?" It is "a safe haven from what?"


If you've spent any time looking at a trading terminal, you've seen it. A news headline breaks, a chart line snaps, and suddenly everyone is rushing for the same exit or the same entrance. It looks like chaos. In practice, it is often a chain of mechanical responses.
This matters for a couple of reasons. Many readers assume the story is the trade. It is not. The story, whether it is an interest rate decision, a supply shock or an earnings miss, is the fuel and the playbook is the engine.
Below are seven core strategies often used in contracts for difference (CFDs) trading. With CFDs, you are not buying the underlying asset. You are speculating on the change in value. That means a trader can take a long position if the price rises, or a short position if it falls.
Seven strategies to understand first
1. Trend following (the establishment play)
Trend following works on the idea that a market already in motion can remain in motion until it meets a clear structural obstacle. Some market participants view it as a chart-based approach because it focuses on the prevailing direction rather than trying to call an exact turning point.
The rationale: The aim is to identify a clear directional bias, such as higher highs and higher lows, and follow that momentum rather than position against it.
What traders look for: Exponential moving averages (EMAs), such as the 50-day or 200-day EMA, are commonly used to interpret trend strength, though indicators can produce false signals and are not reliable on their own.

How it works: The 50-period EMA can act as a dynamic support level that rises as price rises. In an uptrend, some traders watch for the market to make a new higher high (HH), then pull back towards the EMA before moving higher again. Each higher low (HL) may suggest buyers are still in control.
When price touches or comes close to the 50-period EMA during that pullback, some traders treat that area as a potential decision zone rather than assuming the trend will resume automatically.
What to watch: The sequence of HHs and HLs is part of the structural evidence of a trend. If that sequence breaks, for example if price falls below the previous HL, the trend may be weakening and the setup may no longer hold.
2. Range trading (the ping-pong play)
Markets can spend long stretches moving sideways. That creates a range, where buyers and sellers are in temporary balance. Range trading is built around this behaviour, focusing on moves near the bottom and top of an established range.
The rationale: Price moves between a floor, known as support, and a ceiling, known as resistance. Moves near those boundaries can help define the width of the range.
What traders look for: Some traders use oscillators such as the Relative Strength Index (RSI) to help judge whether the asset looks overbought or oversold near each boundary.

How it works: The support level is a price zone where buying interest has historically been strong enough to stop the market from falling further. The resistance level is where selling pressure has historically prevented further gains.
When price approaches support, some traders look for signs of a potential rebound. When it approaches resistance, they look for signs that momentum may be fading. RSI readings below 35 can suggest the market is oversold near support, while readings above 65 can suggest it is overbought near resistance.
What to watch: The main risk in range trading is a breakout, when price pushes decisively through either level with strong momentum. This may signal the start of a new trend and using a stop-loss just outside the range on each trade may help manage that risk.
3. Breakouts (the coiled spring play)
Eventually, every range comes under pressure. A breakout happens when the balance shifts and price pushes through support or resistance. Markets alternate between periods of low volatility, where price moves sideways in a tight range, and high-volatility bursts where price can make a larger directional move.
The rationale: Quiet consolidation can sometimes be followed by a broader expansion in volatility. The tighter the compression, the more energy may be stored for the next move.
What traders look for: Bollinger Bands are often used to interpret changes in volatility. When the bands tighten, a squeeze is forming. Some market participants view a move outside the bands as a sign that conditions may be changing.

How it works: Bollinger Bands consist of a middle line, the 20-period moving average, and 2 outer bands that expand or contract based on recent price volatility. When the bands narrow and come close together, the squeeze, the market has been unusually calm.
This is often described as a coiled spring. Energy may be building, and a sharper move can follow. Some traders treat the first move through an outer band as an early clue on direction, rather than a definitive signal on its own.
What to watch: Not every squeeze leads to a powerful breakout. A false breakout occurs when price briefly moves outside a band, then quickly reverses back inside. Waiting for the candle to close outside the band, rather than entering mid-candle, can reduce the risk of being caught in a false move.
4. News trading (the deviation play)
This is event-driven trading. The focus is on the gap between what the market expected and what the data or headline actually delivered. Economic data releases, such as inflation figures (CPI), employment reports and central bank decisions, can cause sharp, fast moves in financial markets.
The rationale: High-impact releases, such as inflation data or central bank decisions, can force a fast repricing of assets. The bigger the surprise relative to expectations, the larger the move may be.
What traders look for: Traders often use an economic calendar to track timing. Some focus on how the market behaves after the initial reaction, rather than treating the first move as definitive.

How it works: Before the news, price may move in a calm, tight range as traders wait. When the data is released, if the actual reading differs significantly from the consensus expectation, repricing can happen fast.
Gold, for example, may spike sharply on a CPI reading that comes in above expectations. However, the candle can also print a very long upper wick, meaning price reached the spike high but was then rejected strongly. Sellers may step in quickly, and price may retrace. This spike-and-retrace pattern is one of the more recognisable setups in news trading.
What to watch: The direction and size of the initial spike do not always tell the full story. Wick length can offer an important clue. A long wick may suggest the initial move was rejected, while shorter wicks after a data release may indicate a more sustained directional move.
5. Mean reversion (the rubber-band play)
Prices can sometimes move too far, too fast. Mean reversion is built on the idea that an overextended move may drift back towards its historical average, like a rubber band pulled too tight, then snapping back.
The rationale: This is a contrarian approach. It looks for stretches of optimism or pessimism that may not be sustainable, and positions for a return to equilibrium.
What traders look for: A common example is price moving well away from a 20-day moving average (MA) while RSI also reaches an extreme reading. In that setup, traders watch for a move back towards the mean rather than a continuation away from it.

How it works: The 20-period MA represents the market's recent average price. When price moves into an extreme zone, such as more than 3 standard deviations above or below that average, it has moved a long way from its recent trend.
An RSI above 70 can suggest the market is stretched to the upside, while below 30 can suggest the same to the downside. Some mean reversion traders use these combined signals as a sign that a pullback towards the 20-period MA may be possible, rather than assuming the move will continue to extend.
What to watch: Mean reversion strategies can carry significant risk in strongly trending markets. A market can remain extended for longer than expected, and a position entered against the short-term trend can generate large drawdowns. Position sizing and clear stop-losses are critical.
6. Psychological levels (the big figure play)
Markets are driven by people, and people tend to focus on round numbers. US$100, US$2,000 or parity at 1.000 on a currency pair can act as magnets. In financial markets, certain price levels can attract a disproportionate amount of buying and selling activity, not because of technical analysis alone, but because of human psychology.
The rationale: Large orders, stop-losses and take-profit levels can cluster around these big figures, which may reinforce support or resistance. This self-reinforcing behaviour is one reason these rejections can become meaningful for traders.
What traders look for: Traders often watch how price behaves as it approaches a round number. The market may hesitate, reject the level or break through it with momentum. Multiple wick rejections at the same level may carry more weight than a single one.

How it works: When price approaches a round number from below, some traders watch for long upper wicks, the thin vertical line above the candle body. A long upper wick means price reached that level, but sellers stepped in aggressively and pushed it back down before the candle closed.
One wick rejection may be notable. Three in a cluster may be more significant. Some traders use this accumulated rejection as part of the case for a short (sell) setup at that level.
What to watch: Psychological levels can also act as magnets in the opposite direction. If price breaks through with conviction, the level may then act as support. A decisive close above the level, rather than just a wick break, can be an early sign that the rejection setup is no longer holding.
7. Sector rotation (the economic season play)
This is a macro strategy. As the economic backdrop changes, capital may move from higher-growth sectors into more defensive ones, and back again. Not all parts of the sharemarket move in the same direction at the same time.
The rationale: In a slowing economy, discretionary spending may weaken while demand for essential services can remain more stable. Investors may rotate capital between sectors accordingly.
What traders look for: With CFDs, some traders express this view through relative strength, taking exposure to a stronger sector while reducing or offsetting exposure to a weaker one.

How it works: During a growth phase, when the economy is expanding, investors tend to prefer growth-oriented sectors like technology. As the economic environment shifts, perhaps due to rising interest rates, slowing earnings or increasing recession risk, a rotation point may emerge.
In the slowdown phase, the pattern can reverse. Technology may weaken while utilities may strengthen, as investors move capital into defensive, income-generating sectors. Early signals can include relative underperformance in growth sectors combined with unusual strength in defensives.
What to watch: Sector rotation is not usually an overnight event. It typically unfolds over weeks to months. Tracking the ratio between two sectors, often shown in a relative strength chart, can make this shift visible before it becomes obvious in absolute price terms.

Why risk management is the engine of survival
The headline move is one thing. The market implication for your account is another. If you do not manage the mechanics, the strategy does not matter.
Because CFDs are traded on margin, a small market move may have an outsized impact on the account. If leverage is too high, even a minor wobble may trigger a margin call or automatic position closure, depending on the provider's terms. This is not a theoretical risk. It is a common reason new traders lose more than they expected on a trade that was directionally correct.
The market does not always move in a straight line. Sometimes, price gaps from one level to another, especially after a weekend or major news event and in those conditions, a stop-loss may not be filled at the exact requested price. That is known as slippage. It is one reason large positions may carry additional risk into major announcements.
Bottom line
The vehicle is powerful, but the playbook is what helps keep you on the road.
The obvious trade is often already priced in. What matters more is understanding which market condition is in front of you. Is it trending, ranging, breaking out or simply reacting to a headline?
Readers assessing leveraged products often focus on position sizing, risk limits and product disclosure before deciding whether the product is appropriate for them. The headlines will keep changing. The maths of risk management does not.
Ready to trade beyond the majors?
Open an account · Log in
Disclaimer: This article is general information only and is intended for educational purposes. It explains common trading concepts and market behaviours and does not constitute financial product advice, a recommendation, or a trading signal. Any examples are illustrative only and do not take into account your objectives, financial situation or needs. CFDs are complex, leveraged products that carry a high level of risk. Before acting, consider the PDS and TMD and whether trading CFDs is appropriate for you. Seek independent advice if needed. Past performance is not a reliable indicator of future results.

So, here’s the thing...
If you have been following the tech story for the last decade, you have been trained to look at a very specific, very small patch of real estate in Northern California. But as we sit here in early 2026, the "connect-the-dots" moment for investors is this: the AI trade has stopped being about shiny software demos in Palo Alto and has started being about the physical industrialisation of compute.
Want to know more? Read our 2026 AI playbook
What changed, and why it matters
We have entered the "Year of Proof". The world’s largest companies, the hyperscalers, are projected to spend a staggering US$650 billion on capital expenditures this year. But here’s the part most people miss: that money is not staying in Silicon Valley. It’s flowing to the "picks and shovels" players in Idaho, Washington, Colorado and even overseas.
If you want to understand where the actual return on investment (ROI) may be landing this earnings season, you have to look outside the 650 area code. The shift from AI hype to AI industrialisation is changing the map.
Five companies · AI infrastructure play · 2026
The full AI stack: from capex to consulting
Infrastructure builders compared to the implementation bridge across the AI value chain

Hyperscaler CapEx: Early 2026 analyst estimates, midpoint of ranges. Amazon approx. 100% YoY, Alphabet approx. 100%, Meta approx. 87%, Microsoft approx. 50%.
Accenture: Cumulative advanced AI bookings $11.5B through Q1 FY2026. Q1 AI bookings $2.2B (up 76% YoY), AI revenue $1.1B (up 120% YoY) across 1,300+ clients.
Five companies shaping the next phase of AI
Micron Technology (MU), Boise, Idaho
Micron is the "memory backbone" of the current cycle. While everyone was watching the chip designers, many overlooked the fact that AI chips are far less useful without high-bandwidth memory (HBM). Micron is currently viewed by some analysts as a strong buy because its capacity is reportedly sold out through the end of 2026. Analysts are also eyeing a 457% jump in earnings per share (EPS) as the memory cycle reaches what some describe as a robust peak.
Microsoft (MSFT), Redmond, Washington
Microsoft is the enterprise backbone of this transition. It has moved beyond simple chatbots and is now building what analysts call "Intelligence Factories". While the stock has faced pressure recently over capacity constraints, underlying demand for Azure AI is reportedly still running ahead of capacity. The broader bull case is that Microsoft is moving into "Agentic AI", systems that do not just talk to users but may also execute multi-step business workflows.
Which Asian companies are betting big on artificial intelligence?
Amazon (AMZN), Seattle, Washington
Amazon is playing a long-term game of vertical integration. To reduce its reliance on expensive third-party hardware, it’s building its own AI chips in-house. Amazon Web Services (AWS) remains the primary driver of profitability, and the company is using its retail data to train specialised models that many Silicon Valley start-ups may struggle to replicate.
Palantir Technologies (PLTR), Denver, Colorado
If Micron provides the memory and Microsoft the platform, Palantir provides the "operating system" for the modern AI factory. The company has posted strong momentum, with US commercial sales recently growing 93% year over year. It’s often framed as a bridge between raw data and corporate profitability, which remains a key focus for investors in 2026.
Accenture (ACN), Dublin, Ireland
You cannot just "plug in" AI. Businesses often need to redesign processes around it, and that’s where Accenture comes in.
The company is viewed as an implementation bridge, with one analyst arguing that "GenAI needs Accenture" to move from pilot programs to production though the cautionary angle is that the AI story has not fully excited investors here yet because consulting revenue can take longer to show up than chip sales.
What could happen next?
The chart maps the three time horizons likely to shape the next phase of the AI industrialisation trade.
In the near term, markets are still reacting to chipmaker earnings, guidance, and any signs of capacity strain. Over the next month, attention shifts to the real-world inputs behind AI growth, especially power, financing, and infrastructure. By the 60-day window, the key question is whether AI spending is broadening into a wider market re-rating or running ahead of near-term returns.
Across all three periods, the focus is the same: proof. Investors are looking for signs that AI capital expenditure is translating into real demand for energy, land, and industrial capacity. That is why updates from companies tied to power and data centre buildout matter more than ever.
Scenario planning · March 2026
What could happen next
Three time horizons, three scenarios to watch across the AI industrialisation cycle
Chipmaker reports
Possible
Market volatility continues as traders digest the latest reports from chipmakers like Micron
Upside scenario
"Bulletproof" guidance from remaining infrastructure names triggers a sector-wide relief rally
Watch for
Any mention of "capacity constraints" or "supply bottlenecks" in earnings calls
Energy and rates
Possible
Focus shifts to "real economy" energy players like NextEra that power the data centres
Downside scenario
Rising oil prices from Middle East conflict act as a tax on tech margins, rotating into defensives
Action point
Monitor Fed language on rates. Higher for longer makes $650B capex bills far more expensive to finance
The great dispersion
Possible
Market rewards companies with real AI revenue and punishes those still stuck in experimentation
Upside scenario
NextEra Energy (NEE) data centre announcements in late April/May trigger a utility renaissance rally
Downside scenario
An "air pocket" in profits occurs where debt-funded investment outpaces revenue gains
Watch
May reports from Texas Pacific Land (TPL) — is data centre land demand still "red hot"?
Action point
Review your portfolio for geographic diversity. The AI story is now a global power race
The psychological trap
The emotional trap many traders fall into right now is recency bias. You have seen NVIDIA and the "Magnificent 7" win for so long that it feels like they are the only way to play this. But the "obvious" trade is often the one that has already been priced in. Before acting, ask yourself: "Am I buying this stock because I understand its role in the physical AI supply chain, or because I’m afraid of missing the next leg of a rally that started two years ago?"
Ready to trade beyond the majors?
Open an account · Log in
Disclaimer: This content is general information only and should not be relied on as personal financial advice or a recommendation to buy, sell, or hold any financial product. References to companies or themes, including AI-related stocks, are illustrative only. Share and derivative markets can move sharply, and concentrated sectors such as AI and technology may experience elevated volatility, valuation risk, and liquidity risk. If you trade derivatives such as CFDs, leverage can magnify both gains and losses. Past performance is not a reliable indicator of future performance.
After three consecutive years in which mega-cap AI-linked names carried the Nasdaq, the mix of winners may be starting to change.
2026 is the "show me the money" year. Any hint of doubt about whether tech companies were correct to spend nearly US$700 billion on AI last year could have a major impact on market sentiment.
Quick facts
- Global AI capex is projected to exceed US$600 billion in 2026.
- The total addressable market (TAM) for AI data centre systems is estimated to exceed US$1.2 trillion by 2030.
- Nvidia, Microsoft and TSMC are all trading below analyst fair value estimates, despite surging revenues.
- Broadcom's AI chip division is targeting US$100 billion in AI revenue by 2027.
What is powering the AI trade?
Multiple macro forces are likely to underpin the AI investment theme through 2026. The direction of US interest rates, the scale of AI infrastructure spending and the geopolitical backdrop are all likely to matter.
Rates and valuations
The Federal Reserve delivered 75 basis points (bps) of rate cuts in 2025, and markets expect another 50 bps in 2026. Lower rates can reduce the discount applied to future tech earnings and typically support growth stocks, including AI-linked names.
Infrastructure spending and earnings expectations
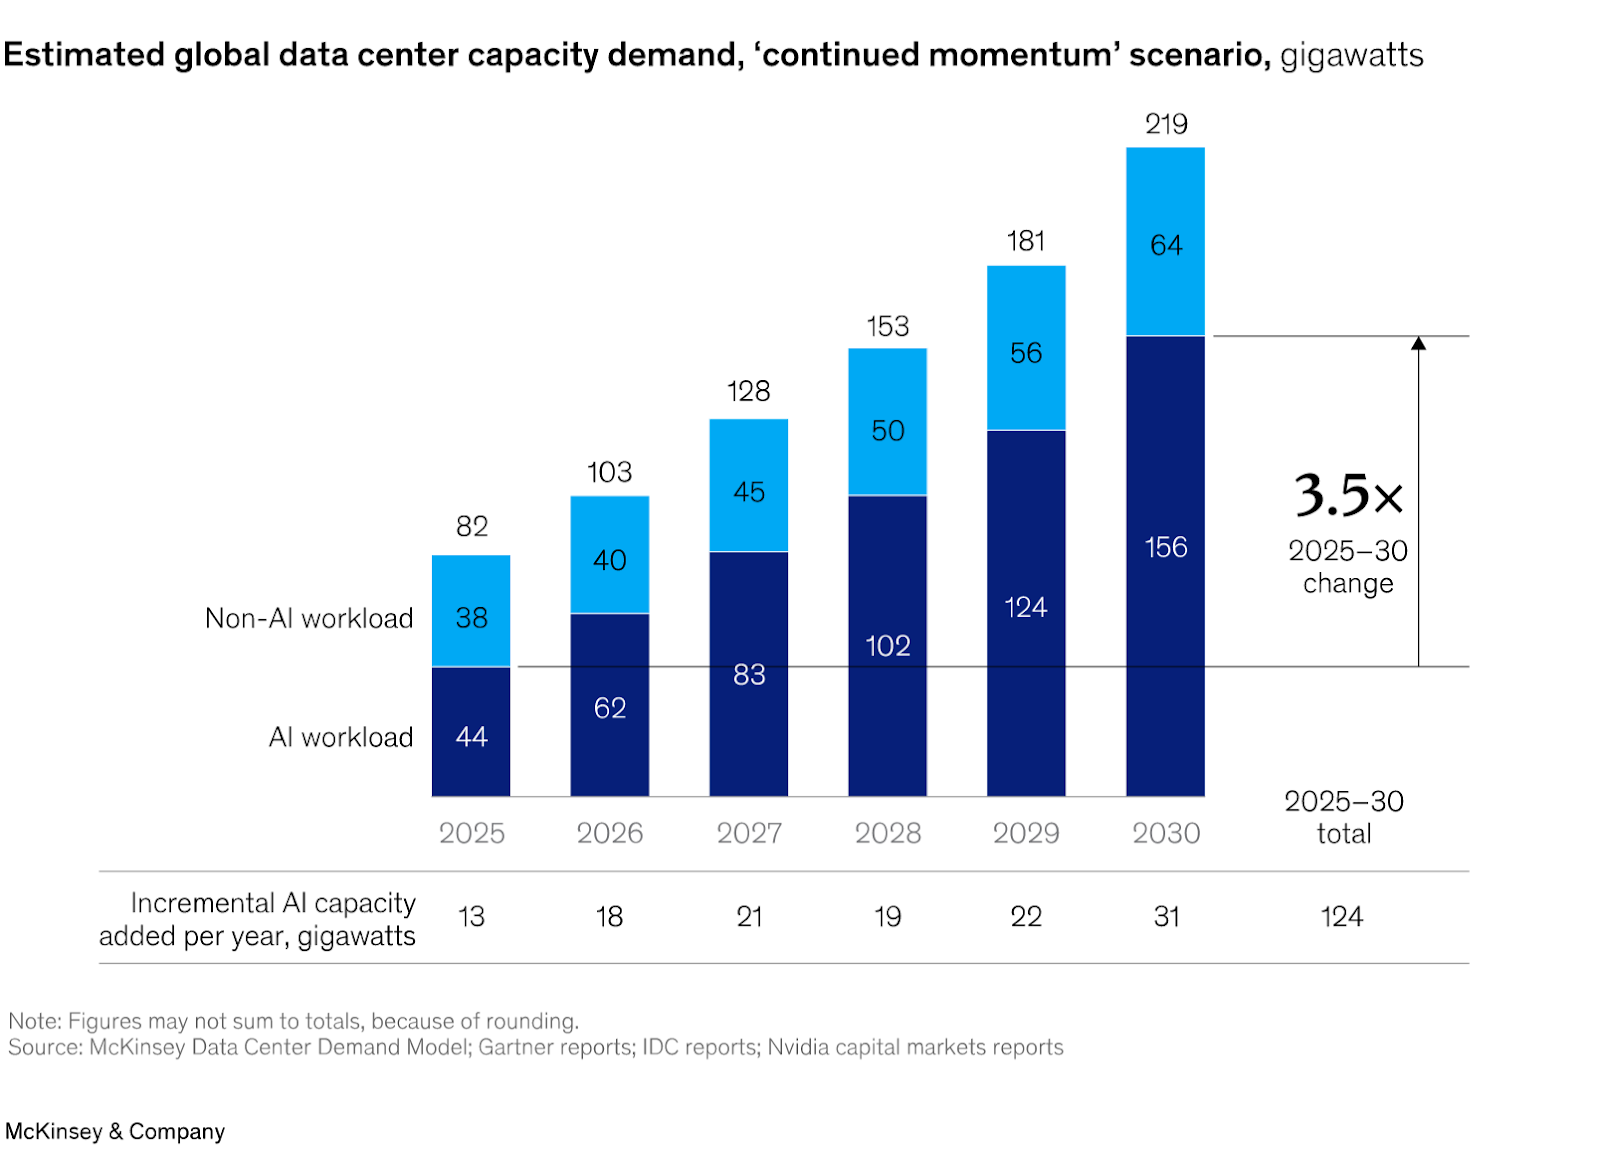
On the spending side, Nvidia CEO Jensen Huang has said data centre operators could spend up to US$4 trillion annually by 2030, and AI capital spending is projected to reach US$571 billion in 2026 alone.
However, markets appear to have already priced in much of this optimism. Analysts are projecting 14% to 16% annual earnings per share (EPS) growth in 2026. That would require S&P 500 stocks outside the Magnificent 7 to roughly double the pace of earnings growth recorded in 2025.
Geopolitics and export controls
Geopolitics could also shape the outlook. US-China export controls on AI chips, along with reduced access to key international buyers, could weigh on data centre growth projections.
Top AI-linked stocks
Nvidia (NVDA)
Nvidia remains the clearest expression of the AI trade. It holds a wide economic moat thanks to its market leadership in GPUs, hardware, software, and networking tools.
Goldman Sachs and Morgan Stanley both carry price targets near $250 on NVDA, with Goldman's call based on a 2027 revenue forecast of over $380 billion. Bank of America sits in the $275 camp, effectively pricing in more AI upside on 2027 earnings.
At 21.6 times forward earnings, Nvidia is now trading below the broader S&P 500's multiple. Key risks include the overhang from US–China export restrictions and any softening in data centre capex guidance from major cloud providers.
Microsoft (MSFT)
Microsoft is down around 25% from its all-time high. During the second quarter of fiscal year 2026, Azure's revenue increased 39% year over year, and the company holds a US$625 billion backlog of contracted usage still to come.
The gap between the stock's recent performance and its underlying revenue growth has drawn attention from analysts, though elevated valuations across the broader tech sector remain a risk to watch.
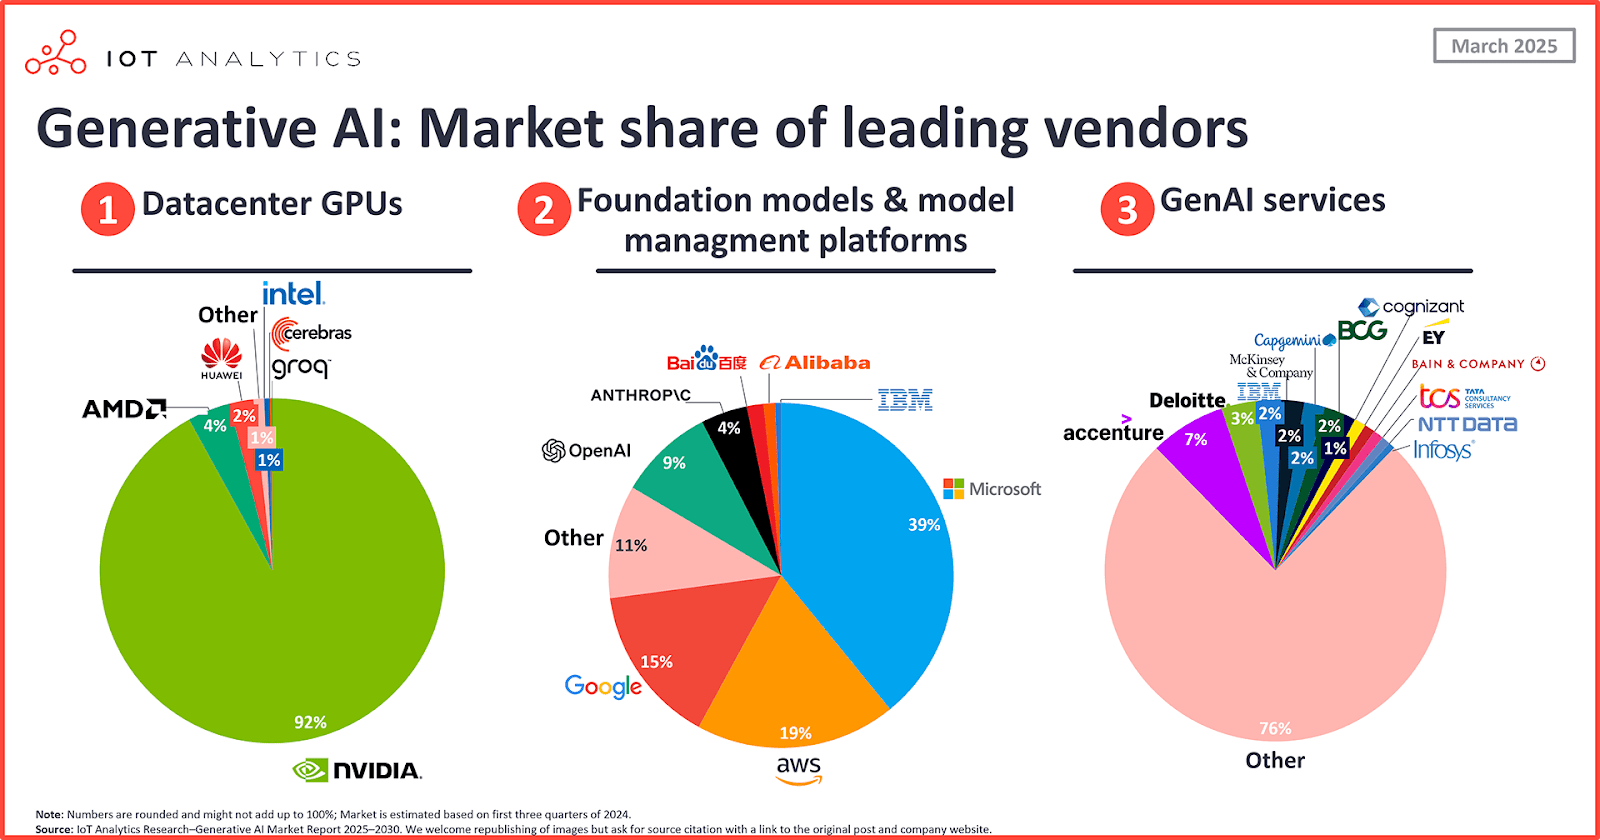
Broadcom (AVGO)
While Nvidia makes broad-purpose GPUs, Broadcom is winning business by going bespoke, designing custom AI chips tailored specifically to the needs of individual hyperscalers like Google and Meta.
During Q1 of FY2026, Broadcom's AI semiconductor division grew at a 106% pace to US$8.4 billion, and by the end of 2027 it expects its AI chip revenue to reach more than US$100 billion.
Broadcom trades at a significant premium to the broader market, which could amplify any downside if growth expectations are not met.
TSMC (TSM)
Almost every major AI chip is manufactured by TSMC. The company holds approximately 70% market share in chip foundry, making it the single most critical piece of infrastructure in the entire AI supply chain.
TSMC sales are projected to increase by 30% in 2026, with gross margins expected to remain above 60% as new fabrication capacity comes online.
The primary risk is geopolitical: any escalation in Taiwan Strait tensions could weigh heavily on the stock regardless of its underlying fundamentals.
Vertiv (VRT)
Less prominent than the semiconductor giants, Vertiv provides the power management, cooling, and data centre infrastructure that keeps AI hardware running.
Nvidia, Broadcom, and Vertiv sit at different points in the AI build-out, including compute, custom silicon, networking and physical infrastructure.
Vertiv's revenue is tied to overall AI capex rather than any single chip maker, which gives it a different risk profile to the names above.
Corning (GLW)
Corning's stock rose 84% in 2025 thanks to surging demand from data centres for its fibre optic cables. Its optical communications segment has grown 69% YoY.
At a Price-to-Earnings (P/E) ratio of roughly 37x, Corning trades at a discount to Nvidia and Broadcom while still carrying direct exposure to AI infrastructure spending. However, its valuation depends heavily on continued capex from the major hyperscalers.
US market drivers for March 2026
AI trades beyond the headline stocks
Energy and utilities
Training large-scale AI models is extraordinarily energy-intensive. A typical 1 gigawatt AI data centre facility requires upwards of US$60 billion in capital expenditure, with roughly half going directly to hardware. Utilities exposed to data centre power demand could also be affected by the AI build-out.
International spillover
South Korea's Kospi surged 76% in 2025 due to AI-linked chipmakers like SK Hynix. Japan's Topix, Germany's DAX, and the UK's FTSE 100 also saw gains of more than 20%. Memory supplier Kioxia was the world's best-performing stock, surging 540%.
Data centre infrastructure
Companies like Emcor, which provides critical electrical, HVAC, and power infrastructure to data centres, reported its contracted backlog surged 31.2% year over year to a record US$13.25 billion. These companies can offer different exposure to the AI capex cycle, but they carry their own execution, backlog, margin and valuation risks.
What could derail the AI trade?
Valuation compression
Broadcom trades at about 50x earnings and AMD at 56x. Any disappointment in forward guidance could trigger a sharp contraction in multiples.
The return on investment test
Companies are investing today on the assumption that highly profitable business applications of AI will emerge over time. If the timing or scale of those returns disappoints, the AI trade could face pullbacks.
Index concentration
The 10 largest stocks in the S&P 500 account for about 40% of the index's total value. A rotation out of mega-cap tech could disproportionately affect broad indices.
Efficiency disruption
China's DeepSeek recently published research suggesting large language models may be developed more efficiently than previously assumed. If AI can be built with less compute, demand for GPUs and data centre hardware could fall short of current forecasts.
Bottom line for traders
The AI trade is maturing but far from over. 2026 is shaping up to be a more nuanced chapter, spreading across the full AI value chain.
The US earnings season will be closely watched for evidence that the hundreds of billions being poured into AI infrastructure are beginning to generate the anticipated returns.
All data points referenced in this article were verified against primary sources on 18 March 2026.
Latin America recorded $730 billion in crypto volume in 2025. Across the region, 57.7 million people now own some form of digital currency rankingslatam, a base that is growing faster than anywhere else in the world
As institutional capital arrives and regulation matures, these are the publicly traded names investors are watching closest.
Why LATAM is a crypto powerhouse right now
Top LATAM crypto stocks to watch
1. Nu Holdings (NYSE: NU)
Digital banking · 127M users across Brazil, Mexico and Colombia
Nubank could be one of the most direct listed proxies for LATAM's fintech and crypto boom. The company integrated cryptocurrency trading directly into its Nu app and partnered with Lightspark to embed the Bitcoin Lightning Network for faster and more cost-effective Bitcoin transactions.
In Q3 2025, revenue jumped 42% year-on-year to $4.17 billion, customer deposits rose 37% to $38.8 billion, and gross profit was up 35% to $1.81 billion.
The stock has returned roughly 36% over the past year and tripled the S&P 500's returns over the last three years. The company dominates Brazil, with over 60% of the adult population using Nubank.
Nu Holdings also recently secured conditional approval to launch Nubank N.A., a US national digital bank. However, the announcement triggered a pullback, with investors cautious about capital deployment timelines and expansion costs.
UBS has lowered its price target to $17.20, citing some market caution despite positive operational shifts.
What to watch
- Credit quality trends in Brazil and Mexico.
- Pace of USDC adoption via Nubank rewards.
- US bank charter timeline and early cost disclosures.
2. MercadoLibre (NASDAQ: MELI)
E-Commerce/Fintech · 18 countries across Latin America
MercadoLibre is not a pure crypto play, but Mercado Pago (its fintech arm) has become one of the most important financial rails in LATAM. The company holds around 570 BTC on its balance sheet as a hedge against regional inflation, and has issued its own US dollar-pegged stablecoin, Meli Dólar.
Full year 2025 net revenue from Mercado Pago reached $12.6 billion, up 46% year-on-year, while total payment volume hit $278 billion, up 41%. Fintech monthly active users have grown close to 30% for ten consecutive quarters, and the credit portfolio nearly doubled to $12.5 billion year-on-year.
The catch for MercadoLibre is profitability. Overall margin compression of 5–6% is attributed to persistent investments in free shipping, credit card expansion, first-party commerce, and cross-border trade.
The stock has declined around 14.5% over the past six months, with the market repricing the stock around what management has framed as a deliberate investment phase heading into 2026.
The longer-term case remains compelling. Mercado Pago has introduced crypto-asset management and insurance products across its core markets, positioning it less as an e-commerce company and more as a full-scale digital bank with crypto infrastructure built in.
What to watch
- Mercado Pago loan loss trends and credit portfolio quality.
- Stablecoin integration and crypto volume through its payment network.
- Whether the Argentina credit card launch can reach profitability.
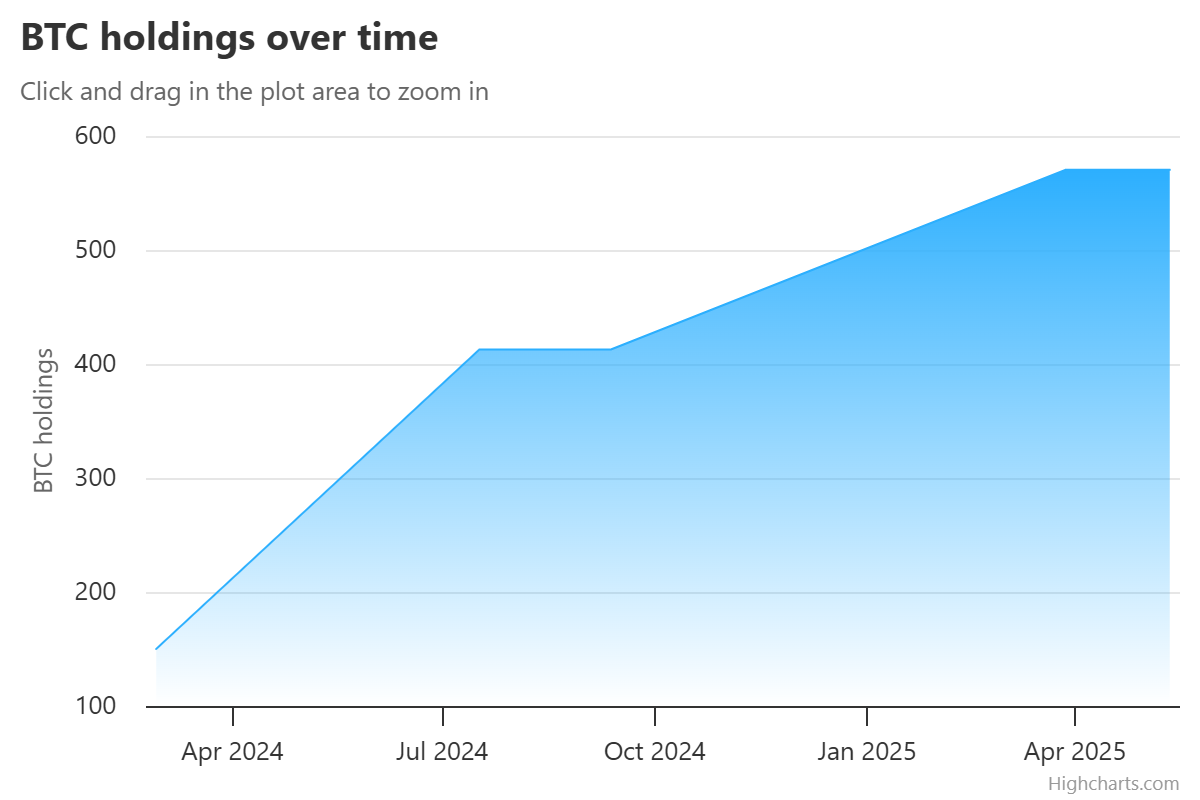
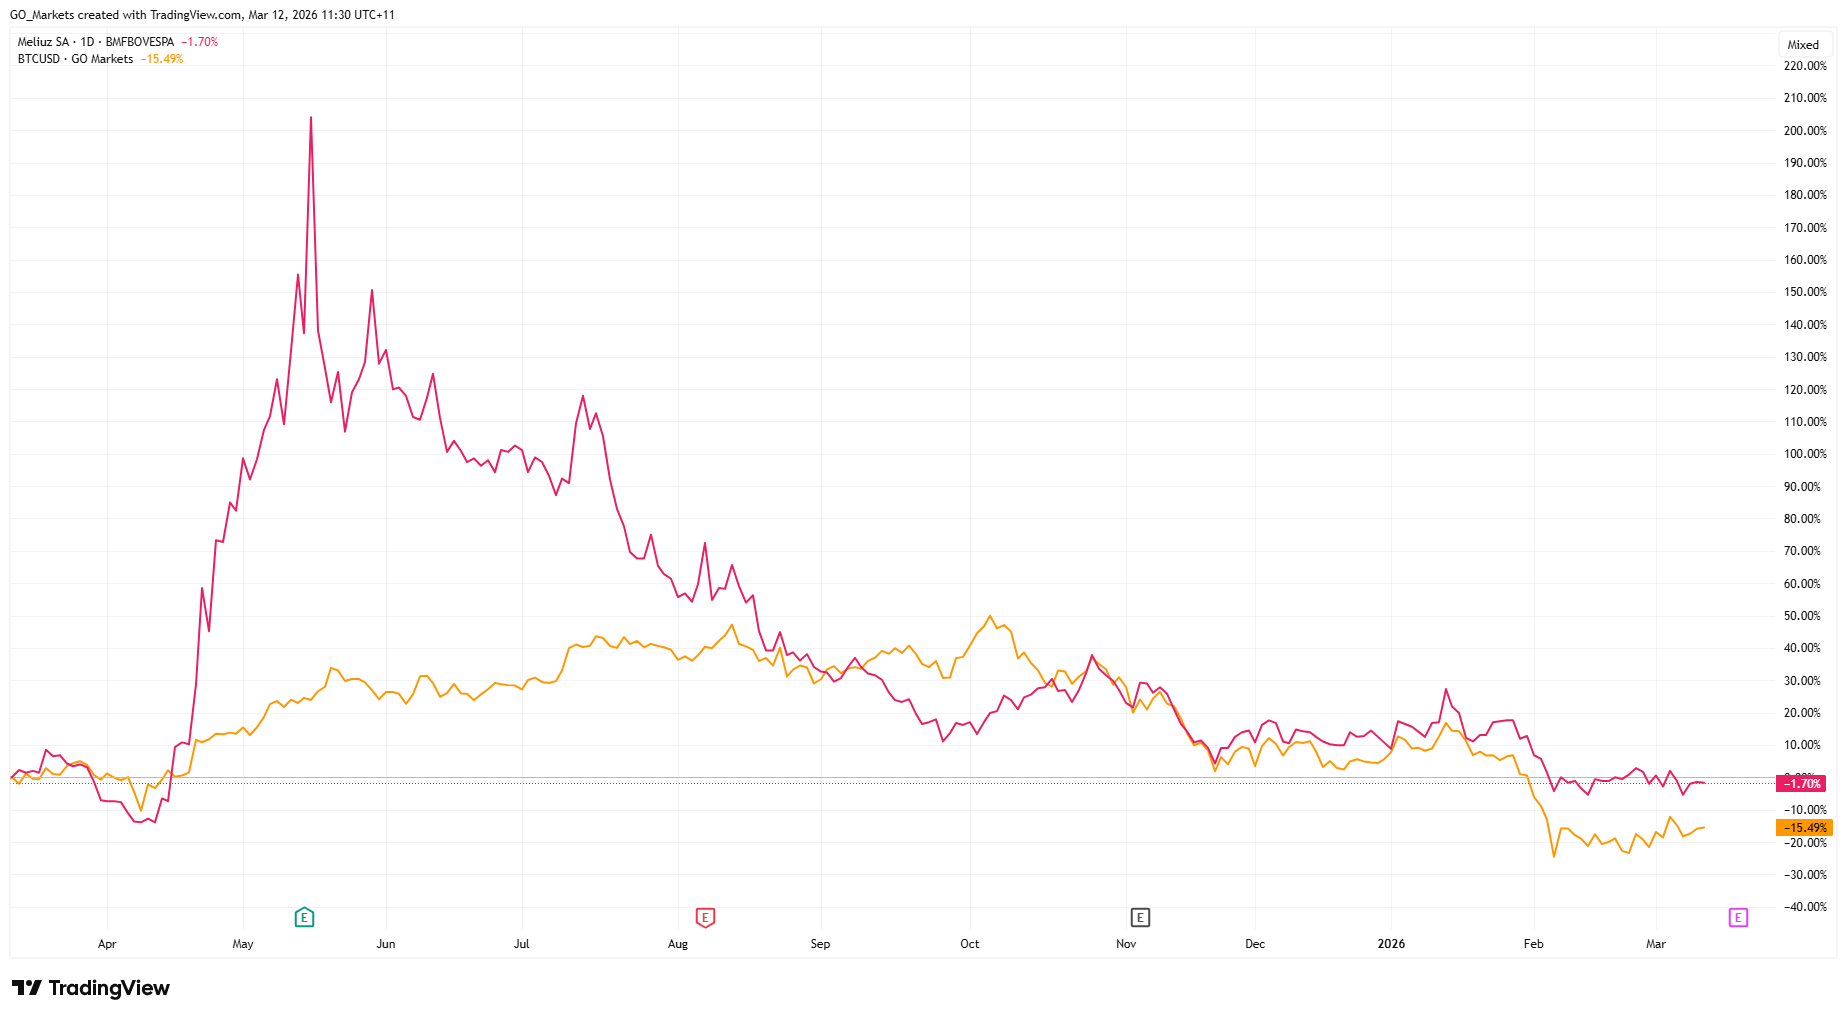
3. Méliuz (B3: CASH3.SA)
Fintech/Bitcoin treasury · Brazil's first listed Bitcoin treasury company
Méliuz is the most direct equity expression of the corporate Bitcoin treasury trend in LATAM. In early 2025, Méliuz became the first publicly traded company in Latin America to formally adopt a Bitcoin treasury strategy, receiving shareholder approval to allocate cash reserves toward Bitcoin accumulation.
Rather than issuing cheap dollar-denominated debt to buy BTC, Méliuz uses share issuance and operational cash flow. The company also sells cash-secured put options on Bitcoin to generate yield, a playbook borrowed from Japanese Bitcoin treasury firm Metaplanet, keeping 80% of BTC holdings in cold storage
CASH3 essentially acts as a leveraged vehicle for BTC exposure, capturing upside intensely in bull cycles, but generating greater volatility on the way down, especially where debt is involved.
The stock surged approximately 170% in May 2025 following the announcement of the Bitcoin strategy. However, it has since pulled back to its April 2025 levels, broadly tracking Bitcoin's price action and highlighting the stock's volatility.
What to watch
- Bitcoin price direction.
- BTC per share metric.
- Expansion of yield-generation strategies
- Any moves to list shares internationally.
4. OranjeBTC (B3: OBTC3.SA)
Pure-play Bitcoin treasury · LATAM's largest corporate Bitcoin holder
Where Méliuz is a fintech business that also holds Bitcoin, OranjeBTC is the opposite: a company whose entire purpose is Bitcoin accumulation.
The company listed on B3 in October 2025 through a reverse merger with education firm Intergraus, marking Brazil's first public debut of a firm whose business model centres entirely on Bitcoin accumulation.
OranjeBTC currently holds over 3,650 BTC and raised nearly $385 million in Bitcoin, with backing from notable investors including the Winklevoss brothers, Adam Back, FalconX, and Ricardo Salinas.
Its $210 million financing round was led by Itaú BBA, the investment arm of Brazil's largest bank, in a significant vote of institutional confidence.
In 2026, OBTC3 has fallen around 32% year-to-date, making it the hardest-hit of the two Brazilian Bitcoin treasury stocks. The stock hit an all-time high of 29.00 BRL on its listing day (October 7, 2025) and an all-time low of 6.06 BRL in February 2026.
It currently trades around 7.06 BRL, a steep discount to its debut, but one that closely mirrors Bitcoin's own pullback from peak levels.
OranjeBTC is the most volatile name on this list and should be treated as a high-beta Bitcoin vehicle. Liquidity is thinner than established names.
What to watch
- Bitcoin per share trajectory.
- Any capital raises or new BTC purchases.
- Potential international listing ambitions.
- How the market-value net asset value (mNAV) discount/premium evolves relative to Bitcoin's price.
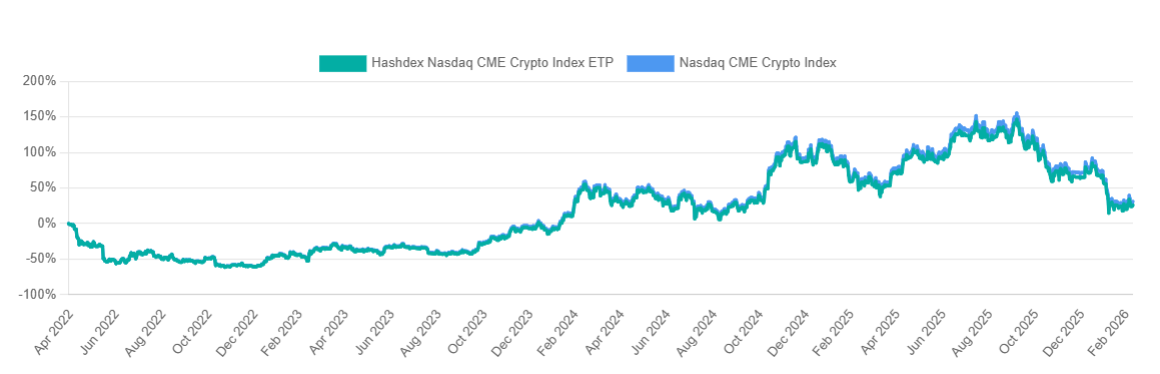
5. Hashdex — HASH11 (B3: HASH11)
Crypto Asset Management · Brazil's leading crypto ETF issuer
Hashdex offers a different kind of exposure to crypto. Rather than a single company's balance sheet or business strategy, HASH11 is a diversified basket of crypto assets wrapped in the familiarity of a regulated Brazilian ETF structure.
Brazil hosts 22 ETFs offering full or partial exposure to crypto assets, with Hashdex funds attracting 180,000 investors and daily transaction volumes averaging R$50 million.
Hashdex launched the world's first spot XRP ETF (XRPH11) on Brazil's B3 in April 2025, tracking the Nasdaq XRP Reference Price Index and allocating at least 95% of net assets to XRP.
The company also operates single-asset ETFs for Bitcoin (BITH11), Ethereum (ETHE11) and Solana (SOLH11), alongside its flagship HASH11 multi-asset index fund.
In mid-2025, Hashdex launched a hybrid Bitcoin/Gold ETF (GBTC11) that dynamically adjusts allocations between the two assets.
For investors who want diversified crypto market exposure rather than single-asset risk, HASH11 is the most accessible on-ramp through Brazil's regulated equity infrastructure.
However, as a multi-asset crypto index, HASH11 is still subject to the broad performance of digital asset markets. And unlike the equity names on this list, there is no operating business creating independent value.
What to watch
- Crypto market sentiment broadly.
- Potential expansion of Hashdex products into the US market.
- AUM growth as institutional adoption accelerates in Brazil.
- Relative performance of HASH11 vs single-asset alternatives.
What to watch next
Institutional infrastructure is still in early innings — Deutsche Börse's Crypto Finance Group entered LATAM in early 2026, and local exchanges have opened over 200 BRL-denominated trading pairs since 2024. The pace of that buildout will set the tone for all five names.
Regulatory progress in Brazil, Mexico, and Chile is the key enabler for the next wave of capital. Any setbacks would hit the higher-beta names like OBTC3 and CASH3 hardest.
Stablecoin volume is the region's most reliable real-time signal. Despite a global slowdown in early 2025, LATAM still recorded $16.2 billion in trading volume between January and May, up 42% year-on-year. Watch whether that momentum holds — a reacceleration lifts all five; a reversal pressures them equally.

From AI infrastructure to pet care, semiconductors, and gold exploration, here are the five top candidates most likely to list on the ASX in 2026.
What is an Initial public offering (IPO)?
1. Firmus Technologies
Firmus Technologies is building AI-powered data centre infrastructure in Tasmania, and it may be one of the most strategically positioned tech companies in Australia right now.
Firmus is an Nvidia Cloud Partner and has joined the GPU maker's Lepton marketplace. The company has designed its modular, liquid-everywhere AI Factory platform to evolve with Nvidia's latest architectures, including Nvidia Spectrum-X Ethernet networking.
A September 2025 raise of A$330m closed at a post-money valuation of A$1.85 billion for the company. By November 2025, after a further A$500m raise, that valuation had trebled to approximately A$6 billion.
A subsequent A$100m investment from Maas Group in early 2026 confirmed the November valuation. Firmus is reported to be contemplating an ASX IPO within the next 12 months and, given the A$6 billion private valuation, any public raise is expected to be well above A$1 billion.
With Australia's growing demand for sovereign AI compute capacity and Tasmania's cool climate and renewable energy advantage for large-scale data centre operations, Firmus stands as one of the largest-scale ASX IPO candidates in 2026.
However, although market interest in Firmus appears to be growing, timing is everything when it comes to IPOs. Watch for confirmation of exact IPO timing, AI data centres sentiment, and whether Nvidia signals deepening its involvement as a strategic anchor investor post-listing.
2. Rokt
Sydney-founded Rokt has quietly become one of Australia's most valuable private tech companies. The e-commerce adtech platform aimed at helping brands monetise the “transaction moment” is now valued at ~US$7.9 billion.
A term sheet prepared by MA Financial projected an exit share price of US$72 under base-case scenarios, when shares are freed from escrow in November 2027.
Rokt is expected to potentially dual-list in the US and on the ASX in 2026, possibly as soon as the first half of the year. IG The most widely discussed structure is a primary Nasdaq listing with an ASX CDI (CHESS Depositary Interest) structure for Australian investors, rather than a full dual listing.
Rokt’s revenue for the year ending August 2025 is projected at US$743m (up 48% year-over-year), with EBITDA forecast at US$100m and a gross profit margin of approximately 43%. It is currently projected to cross the $US1 billion annual revenue milestone by August 2026.
Amazon, Live Nation, and Uber are all reported to be Rokt customers, and the company has expanded rapidly across North America and Europe.
Whether Rokt opts for a primary Nasdaq listing with an ASX CDI structure, or a full dual listing, could significantly affect liquidity and local investor access.
3. Greencross
Greencross, the business behind Petbarn, City Farmers, and Greencross Vets, is preparing to relist on the ASX after being taken private by US private equity firm TPG in 2019.
TPG currently owns 55% of Greencross, while AustralianSuper and the Healthcare of Ontario Pension Plan (HOOPP) hold the remaining 45%.
The company reported revenue of A$2 billion for the 2025 financial year, a modest increase from A$1.95 billion in 2024. TPG paid A$675 million in equity value for the business in 2019; it sold a 45% stake in 2022 at a valuation of more than A$3.5 billion. The proposed IPO implies a valuation of more than A$4 billion.
TPG is targeting an initial public offering of at least A$700 million. The IPO will mark Greencross's return to the ASX after an eight-year absence. TPG's relatively small raise size suggests the firm is banking on strong aftermarket performance before fully exiting.
TPG's exit timeline announcement is still a watch for whether a 2026 IPO is on the cards. And whether the company pursues a traditional IPO or a trade sale, which remains an alternative path.
4. Morse Micro
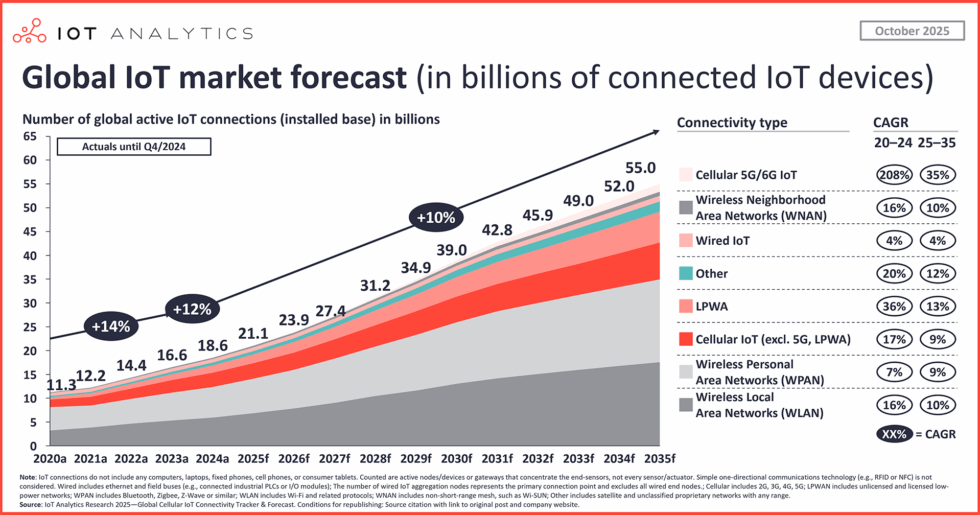
Morse Micro is a Sydney-based semiconductor company developing Wi-Fi HaLow chips designed for IoT applications across agriculture, logistics, smart cities, and industrial monitoring.
Morse Micro held a Series C round in September 2025, raising US$88 million, followed in November 2025 by a US$32 million pre-IPO raise, taking total funding to over A$300 million.
It is targeting an ASX listing in the next 12–18 months. The Series C was led by Japanese chip giant MegaChips and the National Reconstruction Fund Corporation.
Global IoT device connections forecast to exceed 30 billion by 2030, and Morse Micro would be a rare ASX-listed pure-play semiconductor company, which could attract significant interest from tech-focused fund managers.
Morse Micro’s Revenue traction with tier-one hardware partners ahead of listing is a watch, and whether the company seeks a concurrent US listing given the depth of US semiconductor investor appetite.
5. Bison Resources
Bison Resources is a newly incorporated US-focused gold and precious metals explorer currently in the middle of its ASX IPO.
The offer closes on 20 March 2026, with an ASX listing targeted for mid-April 2026. At an indicative market capitalisation of A$13.25 million on full subscription, Bison is the most speculative name on this list by a significant margin.
The company holds four exploration projects in north-east Nevada, within the Carlin Trend (one of the world's most prolific gold-producing belts), responsible for approximately 75% of US gold output.
The IPO seeks to raise A$4.5 to A$5.5 million (22.5 to 27.5 million shares at A$0.20 per share). The team has prior experience at Sun Silver (ASX: SS1) and Black Bear Minerals, giving it a track record in ASX junior mining listings out of Nevada.
Global IPOs: What are the biggest IPOs happening globally in 2026?
Bottom line
Australia's 2026 IPO calendar spans the full risk spectrum. A Nvidia-backed AI infrastructure play, a billion-dollar e-commerce platform, and a junior gold explorer with its IPO already underway.
Each candidate reflects a different stage of maturity and a different investor profile. Together, they suggest the ASX could see a meaningful injection of new listings across sectors that have been largely absent from the local market in recent years.

Volatility doesn't discriminate. But it can punish the unprepared.
Stops getting hit on moves that reverse within minutes. Premiums on short-dated options climbing. And the yen no longer behaving as the reliable hedge it once was.
For traders across Asia, navigating this environment means asking harder questions about risk, timing, and the assumptions baked into strategies built for calmer markets.
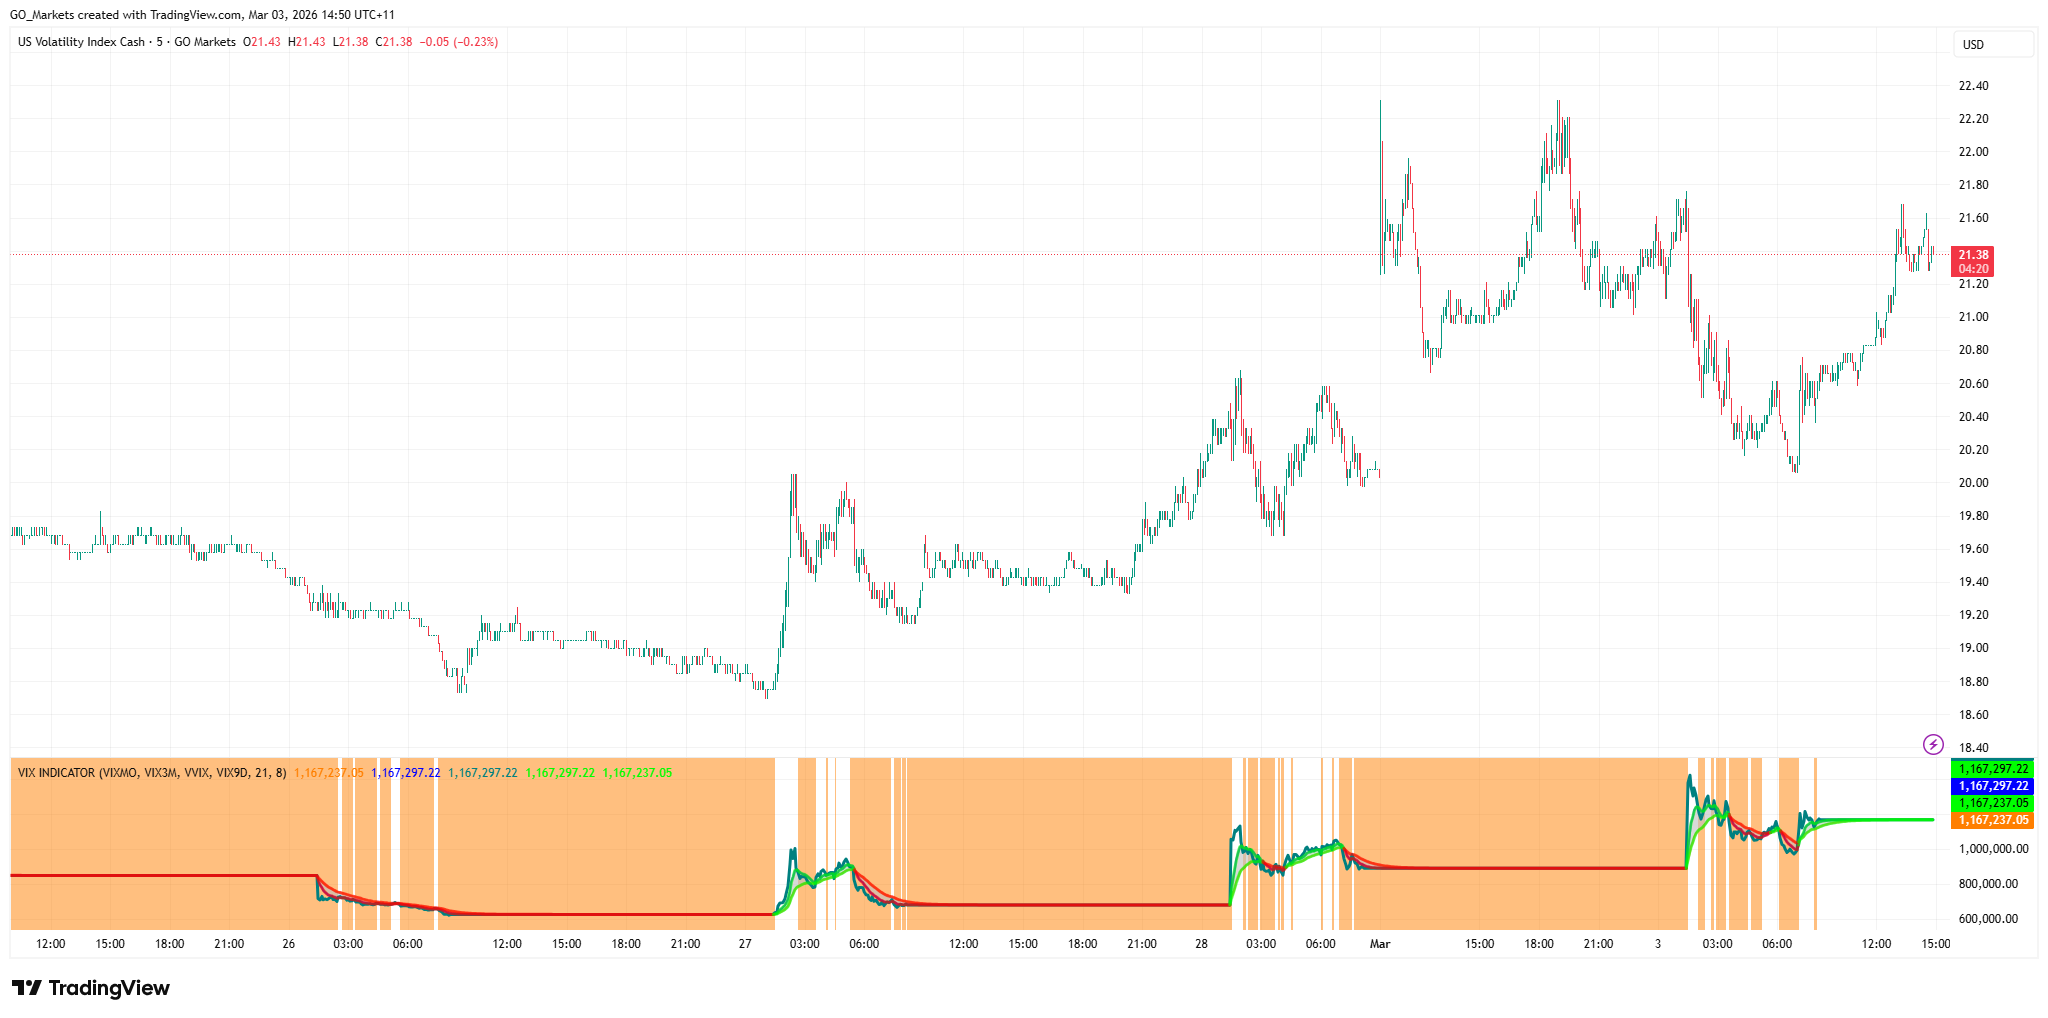
1. How do I trade VIX CFDs during a geopolitical shock?
The CBOE Volatility Index (VIX) measures the market’s expectation of 30-day implied volatility on the S&P 500. It is often called the “fear gauge.” During geopolitical shocks such as the current Iran escalations, sanctions announcements, and surprise central bank actions, the VIX can spike sharply and quickly.
What makes VIX CFDs different in a shock
VIX itself is not directly tradeable. VIX CFDs are typically priced off VIX futures, which means they carry contango drag in normal conditions.
During a geopolitical shock, several things can happen at once
- Spot VIX may spike immediately while near-term futures lag, creating a disconnect.
- Spreads on VIX CFDs can widen significantly as liquidity thins.
- Margin requirements may change intraday as broker risk models adjust.
- VIX tends to mean-revert after spikes, so timing and duration are critical.
What this means for Asian-hours traders
Asian market hours mean many geopolitical events can break while local traders are active or just starting their session.
A shock that hits during Tokyo hours may already be priced into VIX futures before Sydney opens.
Some traders use VIX CFD positions as a short-term hedge against equity portfolios rather than a directional trade. Others trade the reversion (the move back toward historical averages once the initial spike fades). Both approaches carry distinct risks, and neither guarantees a specific outcome.
2. Why are my 0DTE options premiums so expensive right now?
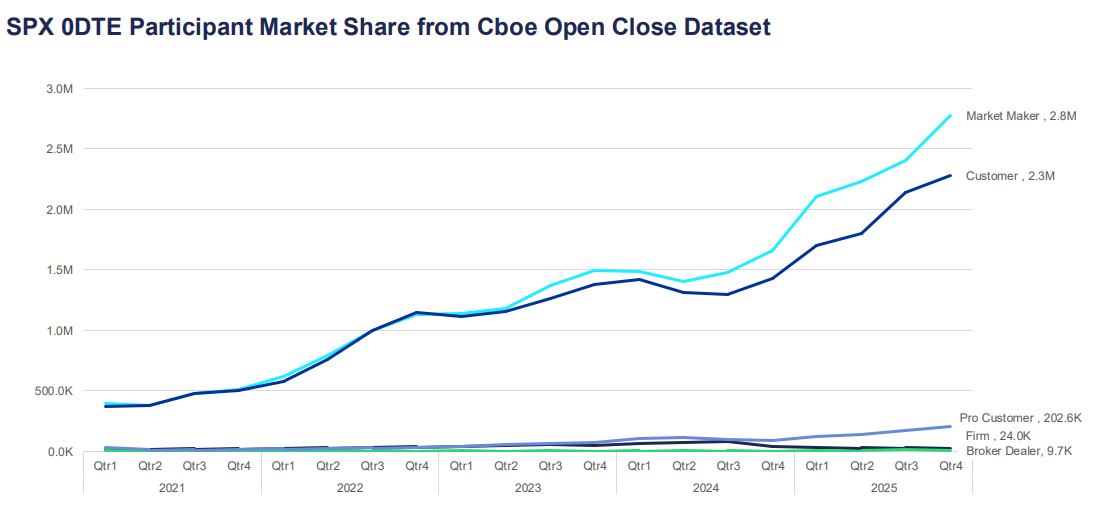
Zero days-to-expiry (0DTE) options expire on the same day they are traded. They have become one of the fastest-growing segments of the options market, now representing more than 57% of daily S&P 500 options volume according to Cboe global markets data.
For Asian-based participants accessing US options markets, elevated premiums during volatile periods can feel like mispricing, but usually reflects structural pricing factors.
Why premiums spike
Options pricing is driven by intrinsic value and time value. For 0DTE options, there is almost no time value left, which might suggest they should be cheap but the implied volatility component compensates for that.
When uncertainty increases, sellers may demand greater compensation for the risk of sharp intraday moves.
This can be reflected in
- Higher implied volatility inputs.
- Wider bid-ask spreads.
- Faster adjustments in delta and gamma hedging.
In higher-VIX environments, hedging flows can contribute to short-term feedback loops in the underlying index. This can amplify price swings, particularly around key levels.
What this means for Asian-hours traders
Many 0DTE options contracts see their most active pricing and hedging flows during US trading hours. Entering positions during the Asian session may mean facing stale pricing or wider spreads.
If you are seeing expensive premiums, it may reflect the market accurately pricing the risk of a large same-day move. Whether that premium is worth paying depends on your view of the likely intraday range and your risk tolerance, not on the absolute dollar figure alone.
3. How do I adjust my algorithmic trading bot for a high-VIX environment?
Many algorithmic trading systems are built on parameters calibrated during lower-volatility regimes. When VIX spikes, those parameters can become outdated quickly.
The regime mismatch problem
Most trading algorithms use historical data to set position sizes, stop distances, and entry thresholds. That data reflects the conditions during which the system was tested. If VIX moves from 15 to 35, the statistical assumptions underpinning those settings may no longer hold.
Common failure modes in high-VIX environments include
- Stops triggered repeatedly by noise before the intended directional move occurs.
- Position sizing based on fixed-dollar risk, which becomes relatively small compared to actual intraday ranges.
- Correlation assumptions between assets breaking down.
- Slippage on execution that erodes edge.
Approaches some algorithmic traders consider
Rather than running a single fixed set of parameters, some systems incorporate a volatility regime filter. This is a real-time check on VIX or ATR that triggers a switch to different settings when conditions shift.
Approach adjustments that some traders review in high-VIX environments
- Widen stop distances proportionally to ATR to reduce noise-driven exits.
- Reduce position size to maintain constant dollar risk relative to wider expected ranges.
- Add a VIX threshold above which the system pauses or moves to paper trading mode.
- Reduce the number of simultaneous positions, as correlations tend to rise during market stress.
No adjustment eliminates risk. Backtesting new parameters on historical high-VIX periods can provide some indication of likely performance, though past conditions are not a reliable guide to future outcomes.
4. Is the Japanese Yen (JPY) still a reliable safe-haven trade?
During periods of global risk aversion, capital has historically flowed into JPY as investors unwind carry trades and seek lower-volatility holdings. However, the reliability of this dynamic has become more conditional.
Why has the yen historically moved as a safe haven?
Japan’s historically low interest rates made JPY the funding currency of choice for carry trades and when risk-off sentiment hits, those trades unwind quickly, creating demand for yen.
Additionally, Japan’s large net foreign asset position means Japanese investors tend to repatriate capital during crises, further supporting JPY.
What has changed
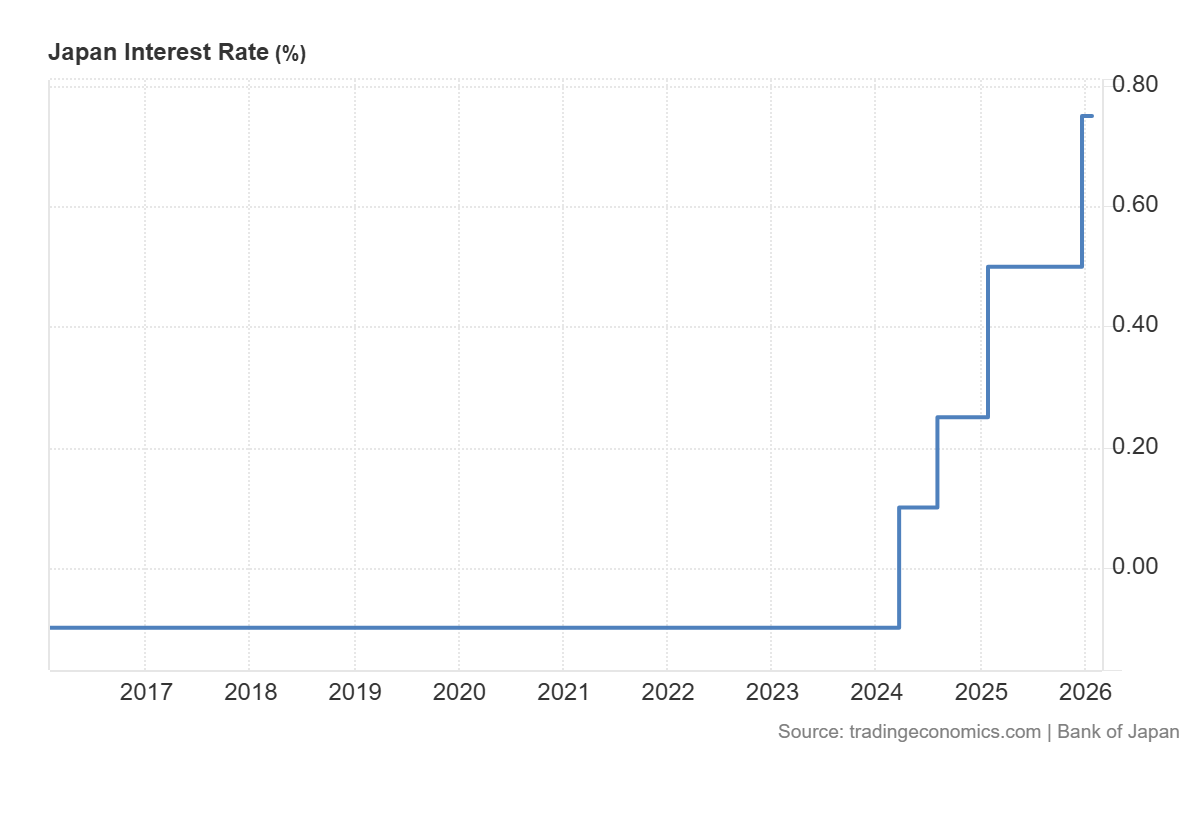
The Bank of Japan’s shift away from ultra-loose monetary policy in recent years has complicated the traditional safe-haven dynamic.
As Japanese interest rates rise:
- The scale of carry trade positioning may change.
- USD/JPY can become more sensitive to interest rate spreads.
- BoJ communication and domestic inflation data may influence JPY independently of global risk appetite.
The yen can still behave as a safe haven, particularly during sharp equity sell-offs. But it may respond more slowly or inconsistently compared to earlier cycles when the policy divergence between Japan and the rest of the world was more extreme.
What to watch
For traders monitoring JPY as a safe-haven signal, BoJ meeting dates, Japanese CPI releases, and real-time US-Japan rate spread data have become more relevant inputs than they were a few years ago.
5. How do I avoid ‘whipsawing’ on energy CFDs?
Whipsawing describes the experience of entering a trade in one direction, getting stopped out as the price reverses, then watching the price move back in the original direction.
Energy CFDs, particularly crude oil, are especially prone to this in volatile markets. And for traders in Asia, the combination of thin liquidity during local hours and sensitivity to geopolitical headlines can make this particularly challenging.
Why energy CFDs whipsaw
Crude oil is sensitive to a wide range of headline drivers: OPEC+ production decisions, US inventory data, geopolitical supply disruptions, and currency moves.
In high-volatility environments, the market can react strongly to each headline before reversing when the next one arrives.
- Price spikes on a headline, stops are triggered on short positions.
- Traders re-enter long, expecting continuation.
- A second headline or profit-taking reverses the move.
- Long stops are hit. The cycle repeats.
Approaches traders may consider to manage whipsaw risk
Some traders choose to change their risk controls in volatile conditions (for example, reviewing stop placement relative to volatility measures). However these may increase losses; execution and slippage risks can rise sharply in fast markets
Other approaches that some traders review:
- Avoid trading crude oil CFDs in the 30 minutes before and after major scheduled data releases.
- Use a longer timeframe chart to identify the prevailing trend before entering on a shorter timeframe, reducing the chance of trading against larger institutional flows.
- Scale into positions in stages rather than committing full size on initial entry.
- Monitor open interest and volume to distinguish between moves with genuine participation and low-liquidity fakeouts.
Whipsawing cannot be eliminated entirely in volatile energy markets. The goal of risk management in these conditions is not to predict which moves will hold, but to ensure that losses on false moves are smaller than gains when a genuine directional move follows.
Practical considerations for volatile Asian markets
Asian markets carry structural characteristics that interact with volatility differently from US or European markets:
- Thinner liquidity during local hours can exaggerate moves on thin volume, particularly in energy and FX CFDs.
- Events in China, including PMI releases, trade data, and PBOC policy signals, can move regional indices.
- BoJ policy decisions have become a more active driver of JPY and Nikkei volatility in recent years.
- Overnight gaps from US session moves are a persistent structural risk for traders unable to monitor positions around the clock.
- Margin requirements on leveraged products can change at short notice during high-VIX periods.
Frequently asked questions about volatility in Asian markets
What does a high VIX reading mean for Asian equity indices?
VIX measures expected volatility on the S&P 500, but elevated readings typically reflect global risk aversion that flows across markets. Asian indices such as the Nikkei 225, Hang Seng, and ASX 200 can often see increased volatility and negative correlation with sharp VIX spikes.
Can 0DTE options be traded during Asian hours?
Access depends on the platform and the specific instrument. US equity index 0DTE options are most actively priced during US trading hours. Asian traders may face wider spreads and less representative pricing outside those hours.
Are algorithmic trading strategies inherently riskier in high-volatility conditions?
Strategies calibrated during low-volatility periods may perform differently in high-VIX environments. Regular review of parameters against current market conditions is prudent for any systematic approach.
Has the JPY safe-haven trade changed permanently?
The Bank of Japan’s policy normalisation has introduced new dynamics, but JPY has continued to strengthen during some risk-off episodes. It may be more conditional on the nature of the shock and the BoJ’s concurrent posture.
What is the best way to set stops on energy CFDs in high-volatility conditions?
There is no universally best method. Many traders reference ATR to calibrate stop distances to prevailing conditions rather than using fixed levels. This does not guarantee exit at the desired price and does not eliminate whipsaw risk.